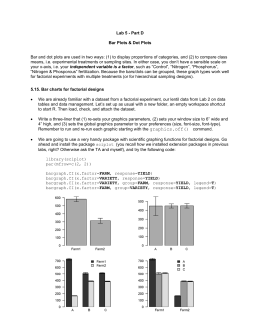
Crop yield predictions using seasonal climate forecasts
Simone M. S. Costa and Caio A. S. Coelho
Instituto Nacional de Pesquisas Espaciais – INPE, São Paulo - SP
This study aims to investigate the potential of using monthly mean climate forecasts from the European Centre for
Medium-range Weather Forecast (ECMWF) model for producing maize yield predictions in RS in 5 months in advance.
SEASONAL WEATHER DATA INTO CROP MODEL
STUDY AREA
Brazil is the 3rd main maize producer in the entire
world after USA and China, and RS State is the 2nd
greatest producer in Brazil (IBGE, 2006). Maize
yields interseasonal variability is high due to irregular
rainfall during the cropping seasons.
Monthly Mean
Rainfall (ECMWF)
Weather Generator
(IRI)
A stochastic weather generator was used to disaggregate the 11
ensemble members of monthly mean rainfall into daily rainfall.
Then the disaggregated daily rainfall was used as input data to a
process-based crop model to predict maize crop yield.
Weather generator estimates the rainfall occurrence based
on a 1st-order Markov chain and the amount on a gamma
distribution fit to 11-yrs of daily observed rainfall.
Daily rainfall
Figure 1 - RS state map showing the main maize
producer region and the 11 municipalities.
Crop Model
(GLAM)
Crop model - General Large Area Model, GLAM is a
process-based model for annual crops and requires daily
data of solar radiation, temperature and rainfall.
Maize grain
Yield
Data - Rainfall - ECMWF forecasts (bias corrected).
Radiation &Temp. - observed climatology (INMET,
FEPAGRO).
RESULTS
ECMWF couple seasonal forecast model
does show skill on monthly mean rainfall
forecasts during the maize crop cycle
(Fig.2), suggesting the potential use this
information for crop prediction.
Correlation Between ECMWF monthly Forecasts and
Observed Rainfall Anomalies (1981-2005), Issue Sep.
A reasonable agreement is noticed between
the observed and disaggregated histograms
(Fig.3), indicating that the used weather
generator can reproduce the observed daily
rainfall distribution accordingly.
Daily rainfall histogram for Santa Rosa county
There is a generally good agreement between the
simulated and the predicted yield, particularly for
the last 10yrs. For most years the obs. yield is
within 95% prediction interval, indicating good
reliability of yield predictions.
Grain yield prediction for indiv. Municipality
produced six months in advance for 16 years
3
sept.
oct.
5
nov.
7
dec.
jan.
feb.
Fcst.
Figure 2 – High positive correlation is noticed over
nearly all South America in September, indicating good
association between observed and forecast anomalies.
Figure 3 – Daily rainfall histogram for Sept. to
Feb. (1989 – 2005) based on observed rainfall and
disaggregated rainfall for two of the 11 ECMWF
ensemble members.
Obs.
Figure 4 - Grain yield prediction produced 5 months in
advance for 3 municipalites (3, 5 and 7, Fig1). Black line is
the ensemble mean grain yield (i.e. mean of the 11 dots).
Dashed lines indicate the 95% prediction interval.
Preliminary results show promising usefulness of monthly mean rainfall forecasts
produced by ECMWF model for predict maize yield for RS in 5 months in advance.
This work was supported by the EUROBRISA network project (F/00 144/AT) kindly funded by the Leverhulme Trust. The dynamical ensemble forecast data were kindly provided by
ECMWF as part of the EUROSIP project. Three forecasting centres are the partners in EUROSIP (ECMWF, the UK Met Office and Meteo-France). The authors thank Vicent Moron for
making the weather generator software available at IRI website. CASC thanks the FAPESP (process 2005/05210-7 and 2006/02497-6) for funding part of the EUROBRISA project.
Baixar