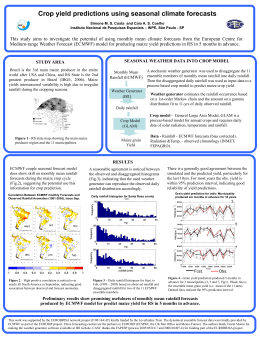
Australian Journal of Basic and Applied Sciences, 6(10): 42-47, 2012
ISSN 1991-8178
Maize (Zea mays L.) Genotypes Diversity Study by Utilization of Inter-Simple Sequence
Repeat (ISSR) Markers
1
Atif Elsadig Idris, 2Nada Babiker Hamza, 1Samia Osman Yagoub, 2Ali I.A. Ibrahim and
2
Haitham K.A. El-Amin2
1
Department of Agronomy, College of Agricultural Studies, Sudan University of science and
Technology, Shambat, P.O.Box, 71, Khartoum North, Sudan.
2
Commission for Biotechnology & Genetic Engineering, National Centre for Research,
P.O.Box, 2404, Khartoum, Sudan.
Abstract: Analysis of the extent and distribution of genetic diversity in crop plants is essential for
optimizing sampling and breeding strategies. Several methods were identified for the existence of
diversity in maize for the aim of perfect selection based on great diversity among maize genotypes. In
this study, Inter-simple sequence repeat (ISSR) markers were used to assess genetic diversity in a
selected group of maize inbred ( Zea mays L.) genotypes. A high level of polymorphism of 69% was
detected among these genotypes. The ISSR primers showed 10 fingerprints for six genotypes out of 9
studied which are Frantic, Huediba-1, Balady, Huediba-2, Giza 2 and Mogtamaa 45-2. The maximum
genetic distance of 0.48% was detected between Huediba-2 and Mogtama- 45-2. While, the minimum
genetic distance of 0.16 percent was observed between Giza-2 and Var.113. The results indicated that
variation can be attributed to use of ISSR.
Key words: (ISSR) markers, DNA polymorphism, Maize, Genotypes, Genetic diversity.
INTRODUCTION
Maize (Zea mays L.) ranks as one of the world’s three most important cereal crops, it is cultivated in a wide
range of environments more than wheat and rice because of its greater adaptability (Koutsika-Sotiriou, 1999).
So due to its importance as food and forage crop in Sudan, it has been subjected to intensive genetic and
cytogenetic studies (Asif et al., 2006). Several analysis of the maize genetic variability have been performed
using molecular markers to assess the crop evolutionary aspects (Wu, 2000, Srdic et al., 2007, Abuali et
al.,2011) or to obtain genotype characterization (Gethi et al., 2002) or to estimate heterosis among inbred lines
(Ishag, 2004). The use of hybrid vigor or heterosis in maize culture is an outstanding successful example in
applied genetics as it allowed a better understanding of the genetic phenomenon and plant breeding in general
(Springer and Stupar, 2007).
Molecular markers are stable and detectable in all plant tissues regardless of the growth, differentiation,
development or status of cells. Besides, they are not affected by environmental, pleiotropic and epistatic effects
(Agarwal et al., 2008; Collard and Mackill, 2008; Moose and Mumm, 2008). For such, the use of DNA markers,
compared to phenotypic aspects, becomes even more important. There are many markers available, among them
are: the simple sequence repeats (SSR) markers (Tautz, 1989), randomly amplified polymorphic DNA (RAPD)
(Welsh and McCleland, 1990), inter simple sequence repeats (ISSR) (Zietkiewicz et.al, 1994), amplified
fragment length polymorphism (AFLP) (Vos et al., 1995), single nucleotide polymorphisms (SNPs) (Chen and
Sullivan, 2003) and diversity array technology (DArT) (Kilian et al., 2005).
These different types of molecular markers have potential to differentiate and detect differences among
genotypes, in relation to cost, easiness of use, consistency and repeatability of the Results (Schlötterer, 2004;
Schulman, 2007; Bernardo, 2008). One of these techniques is inter simple sequence repeats (ISSR) technique is
considered simple and fast like RAPD, but has more stringency than RAPD. Also, ISSR markers are highly
polymorphic, which makes them useful for studies on genetic diversity, phylogeny, genetic coding, genomic
mapping and evolutionary biology (Reddy et al., 2002).
In the present study nine genotypes of maize from different sources were assessed for diversity by
utilization of ISSR analysis.
MATERIALS AND METHODS
Seed Material:
Nine maize genotypes obtained from different sources (Table, 1). Seeds of all genotypes were sown at the
experimental farm, Sudan University of Science and Technology, College of Agricultural Studies, Shambat. The
Corresponding Author: Atif Elsadig Idris, Department of Agronomy, College of Agricultural Studies, Sudan University of
science and Technology, Shambat, P.O. Box 71, Khartoum North, Sudan.
E-mail: [email protected]
42
Aust. J. Basic & Appl. Sci., 6(10): 42-47, 2012
leaf samples of maize genotypes were collected into labeled bags and stored in dry ice until DNA extraction was
done.
Table 1: Genotypes name source and days to 50% flowering.
NO
Name of Genotypes
Source
1
Frantic
Received from ARC
2
Huediba 1
Open –pollinated variety improved by ARC
3
Balady
Local variety
4
Huediba 2
Open –pollinated variety improved by ARC
5
Giza 2
Introduced by ARC from Egypt
6
Mogtamaa 45-1
Introduced by ARC from Egypt
7
Var 113
Local material selected by ARC
8
Mogtamaa 45-2
Introduced by ARC from Egypt
9
Panama
Introduced and released by ARC
ARC : Agricultural Research Corporation, Sudan.
Days to 50% flowering
62.30
60.84
50.84
59.65
64.30
62.64
58.00
59.15
61.50
DNA Extraction:
DNA was extracted from fresh leaf tissue of the nine maize genotypes using modified CTAB method
(Porebski et al., 1997). The modification was made in intention to improve the DNA quantity and the quality. In
this method the fine powdered plant materials were immediately transferred into 15 ml Falcon tubes containing
5 ml of pre-warmed lysis solution. Tubes containing the samples were then incubated in a water bath at 60ºC
with gentle shaking for 60 min and left to cool at room temperature for 10 min. Chloroform: Isoamylalcohol
mixture (24:1) was added to each tube and the phases were mixed gently for 5 min at room temperature to make
a homogenous mixture. The cell debris was removed by centrifugation at 4000 rpm for 15 min and the resulted
clear aqueous phases (containing DNA) were transferred to new sterile tubes. The step of the chloroform:
isoamyl alcohol extraction was repeated twice. The nucleic acids in the aqueous phase were precipitated by
adding equal volume of deep cooled Isopropanol. The contents were mixed gently and collected by
centrifugation at 4000 rpm for 10 min. The formed DNA pellet was washed twice with 70% Ethanol and the
Ethanol was discarded. The remained ethanol was removed by leaving the pellet to dry at room temperature.
The pellet was dissolved in TE buffer (10 mM Tris, 1 mM EDTA, pH 8) and stored at -20ºC for further use.
DNA Quality and Quantity:
The extracted DNA samples were observed under UV illumination after staining with Ethidium Bromide
and agarose gel electrophoresis. The purity and the concentrations of the DNA were then
Spectrophotometrically assessed following Sambrook et al., (1989) method.
PCR of the ISSR Technique:
25 ISSR primers were used in the polymerase chain reaction (PCR) in a final volume of 25 μL containing
1.0 μL DNA diluted, 0.5 μL Taq polymerase, 2.5 μL 10X buffer, 2.5 μL (2mM/μl) dNTPs, 1.5 μL (50 mM)
MgCl2, 2.0 μL (10 pmol/ μl) ISSR primer and 15 μL ddH2O. The amplifications were performed in a thermal
cycler following the program: 94°C for 5 min, 40 cycles (1 min at 94°C, 1 min at 43°C and 1 min at 72°C) and
final elongation of 7 min at 72°C.
DNA Photograph:
5 µl of PCR product were mixed with 2 µl of loading dye and 1.4 µl of 1 Kbp DNA ladder, then were
electrophoresed using 2% agarose gel at 80 Volts followed by staining with Ethidium Bromide then the
separated fragments were visualized with an ultraviolet (UV) transilluminator.
ISSR Data Analysis:
The number of polymorphic and monomorphic bands were determined for each primer. Genotypes were
scored (1) for present band and (0) for absent band and then entered into a data matrix. Percentage of
polymorphism was calculated as the following equation: (polymorphic bands / total number of bands x 100).
The tree diagram was produced by clustering the similarity data with the UPGMA method using STATISTCASPSS software Ver. 9 following the method as used by El-Amin and Hamza, (2012).
RESULTS AND DISCUSSION
Eight primers were used out of the 25 tested to produce 53 polymorphic bands of 69 total amplified bands,
with average of 6.5 bands per primer with 69% polymorphi. The ISSR primer 810 had the highest percentage of
polymorphic band with 92% (Table, 2). Júnior et al., (2011) results showed that ISSR primer ((GA) 8T) had
same results as we obtained, with total number of bands (11), with polymorphic number of bands (10) and the
percentage of polymorphic band (92%). The highest distance matrix was 0.48 between Huediba 2 and
43
Aust. J. Basic & Appl. Sci., 6(10): 42-47, 2012
Mogtamaa 45-2, the lowest was 0.16 between Giza 2 and Var 113.The obtained value in this study was little less
than the values previously obtained by Abuali et al., (2011) who used RAPD markers in 27 hybrids and inbred
lines of maize.
Ten DNA fingerprints were found for six genotypes out of nine studied, where three fingerprints were
found in the Frantic genotype using primer 814 and primer 872. Huediba-1 had three fingerprints with primers
810, 814 and 841. Balady had only one fingerprint with primer 808. One fingerprint was obtained for Huediba-2
with primer 841, Giza 2 with primer 872 and Mogtamaa 45-2 with primer 814. According to Kachapur et al.,
(2009) appearance of fingerprints may be due to the presence of unique alleles inside those genotypes, and such
alleles are important because they may be diagnostic for particular regions with a genome specific to a particular
type of maize. Using the ISSR primers. Access on specific DNA fingerprints will be of high value for maize
breeders working in the improvement of the crop. Also, the ISSR primers (808, 810, 814, 841, and 872) that
showed specific fingerprints can be used in between to screen longer spectrum of Sudanese maize accessions.
The phylogenetic analysis of this study distinguished that Frantic, Huediba-1 and Huediba-2 genotypes are
out of clusters. The first cluster contained two genotypes as sisters which are Panama and Mogtamaa 45-1. Also,
Balady and Mogtamaa 45-2 genotypes as second sisters. In the other cluster there is one sister Giza 2 and Var
113 (Figure 2). Our results are in agreement with reports of Ayana et al., (2000) and Iqbal et al., (2010) who
observed no genetic relationship with quantitative agro-morphological traits, which shows no correlation
between molecular markers and morphological traits. Ezzat et al., (2010) mentioned that the differences among
genotypes in agronomic traits are may due to the differences of weather patterns, soil type and the location to
another. So, this may be due to the influence of different environmental conditions on the phenotypic traits,
leading to apparent differences even among identical genotypes (Shehzad et al., 2009). So the indigenous names
cannot be considered good guide to the presence of diversity (Chakauya et al., 2006).
Fig 1: Amplification of the 9 maize genotypes with ISSR primers 810 and 872.
Where: M: DNA ladder (1 kbp), 1: Frantic, 2: Huediba-1, 3: Balady, 4: Huediba-2, 5: Giza-2, 6: Mogtamaa
45-1, 7: Var-113, 8: Mogtamaa 45-2 and 9: Panama.
Table 2: Polymorphism and monomorphism detected by the use of 8 polymorphic ISSR primers.
Primer name
Sequence
Total number of
Number of
Number of
(5’-3’)
bands
polymorphic bands
monomorphic bands
807
(AG)8T
10
8
2
808
(AG)8C
8
6
2
810
(GA)8T
12
11
1
814
(CT)8A
11
10
1
841
(GA)8YC
9
8
1
848
(CA)8 RG
4
1
3
858
(TG)8RG
4
1
3
872
(GATA)4
11
8
3
Total
69
53
16
Average
8.6
6.5
2
Table 3: DNA finger prints specific for six Maize genotypes of the nine studied.
NO.
Name of Genotypes
Number of fingerprints
1
Frantic
1
2
2
Huediba-1
1
1
1
3
Balady
1
4
Huediba-2
1
5
Giza-2
1
6
Mogtamaa 45-2
1
44
Percentage of
polymorphic bands
80%
75%
92%
91%
89%
25%
25%
73%
69%
Primer
814
872
810
814
841
808
841
872
814
Aust. J. Basic & Appl. Sci., 6(10): 42-47, 2012
Table 4: Distance matrix based on ISSR data among the 9 maize genotypes. Where: 1:
Giza-2, 6: Mogtamaa 45-1, 7: Var-113, 8: Mogtamaa 45-2 and 9: Panama.
1
2
3
4
5
1
0.00
2
0.43
0.00
3
0.35
0.23
0.00
4
0.42
0.39
0.39
0.00
5
0.36
0.28
0.25
0.35
0.00
6
0.30
0.25
0.22
0.32
0.23
7
0.38
0.32
0.29
0.30
0.16
8
0.32
0.23
0.20
0.48
0.30
9
0.36
0.33
0.28
0.35
0.32
Frantic, 2: Huediba-1, 3: Balady, 4: Huediba-2, 5:
6
7
8
9
0.00
0.19
0.28
0.17
0.00
0.29
0.28
0.00
0.25
0.00
Tree Diagram f or 9 Variables
Unweighted pair-group av erage
1-Pearson r
Frantic
Huediba 1
Balady
Mogtamaa 45-2
Mogtamaa 45-1
Panama
Giza 2
Var 113
Huediba 2
0.2
0.3
0.4
0.5
0.6
0.7
0.8
Linkage Distance
Fig. 2: UPGMA Dendrogram resulting from the analysis of 8 ISSR primers showing the relationships among
the 9 maize genotypes.
Conclusions:
Genetic diversity plays a key role in crop improvement. This study was aimed at identifying genetic
diversity in nine maize genotypes using 8 primers sets. The results showed that the estimation of genetic
distance among maize genotypes by utilization of ISSR markers could be used as a reliable method for the
characterization of maize genotypes. The DNA based markers represent a powerful tool in assessment of genetic
diversity among maize genotypes. They can be used to identify diverse sources in maize germplasm collections
or to select groups of genotypes with desirable characters and contrasting phenotypes, if large numbers are
employed. Particularly, genetic distance estimates determined by ISSR markers may help to identify suitable
maize germplasm for introgression into breeding stocks. It is recommended that these nine genotypes could be
used in efficient hybridizations techniques for the object of increasing levels of genetic polymorphism in maize
genotypes.
REFERENCES
Abuali, A.I., A.A. Abdelmula, M.M. Khalafalla, 2011. Assessment of genetic diversity in Sudanese maize
(Zea mays L.) genotypes using random amplified polymorphic DNA (RAPD) markers. African Journal of
Biotechnology. 10(42): 8245-8250.
Agarwal, M., N. Shrivastava, H. Padh, 2008. Advances In Molecular Marker Techniques And Their
Applications In Plant Science. Plant Cell Rep., 27(4): 617-631.
Asif, M., M. Ur-Rahman and Z. Yusuf, 2006. Genotyping Analysis Of Six Maize (Zea Mays L.) Hybrids
Using Dna Fingerprinting Technology. Pak. J. Bot., 38(5): 1425-1430.
Ayana, A., E. Bekele and T. Bryngelsson, 2000. Genetic variation in wild sorghum (Sorghum bicolor ssp.
Verticilliflorum (L.) Moench) germplasm from Ethiopia assessed by random amplified polymorphic DNA
(RAPD). Hereditas, 132: 249-254.
45
Aust. J. Basic & Appl. Sci., 6(10): 42-47, 2012
Bernardo, R., 2008. Molecular markers and selection for complex traits in plants: learning from the last 20
years. Crop Sci., 48(5): 1649-1664.
Chakauya, E., P. Tongoona, E.A. Matibiri and M. Grum, 2006. Genetic Diversity Assessment of Sorghum
Landraces in Zimbabwe Using Microsatellites and Indigenous Local Names. International Journal of Botany, 2:
29-35.
Chen, X., PF. Sullivan, 2003. Single nucleotide polymorphism genotyping: biochemistry, protocol, cost and
throughput. Pharmacogenomics J., 3(1): 77-96.
Collard, BCY., D. Mackill, 2008. Marker-assisted selection: an approach for precision plant breeding in the
twenty-first century. Phil. Trans. R. Soc., B 363: 557-572.
Ezzat, E.M., M.A. Ali and A.M. Mahmoud, 2010. Agronomic Performance, Genotype X Environment
Interactions and Stability Analysis of Grain Sorghum (Sorghum bicolor L. Moench). Asian Journal of Crop
Science, 2: 250-260.
Gethi, J.G., J.A. Labate, K.R. Lamkey, M.E. Smith, S. Kresovich, 2002. SSR variation in important U.S.
maize inbred lines. Crop Sci., 42: 951-957.
EL-Amin, H.K.A. and N.B. Hamza, 2012. Phylogenetic diversity of Sorghum bicolor (L.) Moench
accessions from different regions in Sudan American Journal of Biochemistry and Molecular Biology, ISSN
2150-4210/ DOI:10.3923/ajbmb.
Iqbal, A., B. Sadia, A.I. Khan, F.S. Awan, R.A. Kainth and H.A. Sadaqat, 2010. Biodiversity in the
sorghum (Sorghum bicolor L. Moench) germplasm of Pakistan,l online Journal, Genetics and Molecular
Research, ISSN: 1676 5680, 9(2): 756-764.
Ishag, A.A., 2004. Estimation of general and specific combining abilities of some maize inbred lines (Zea
mays L.) Ph.D.Thesis, Faculty of Agriculture ,University of Khartoum, Sudan.
Júnior, A.T. do Amaral., É.C. de Oliveira, L.S.A. Gonçalves, C.A. Scapim, L.S. Candido, T.R. da
Conceição Silva, C.V. and K.S. da Cunha1, 2011. Assessment of genetic diversity among maize accessions
using inter simple sequence repeats (ISSR) markers. African Journal of Biotechnology, 10(69): 15462-15469,
ISSN 1684-5315.
Kachapur, R.M., P.M. Salimath and B.V.S. Reddy, 2009. Genetic Diversity within Sweet Sorghum
(Sorghum bicolor L. Monech) Accessions as Revealed by RAPD Markers. Journal of Maharachtra Agri. Univ.,
34(1): 038-042.
Kilian, A., E. Huttner, P. Wenzl, D. Jaccoud, J. Carling, V. Caig, M. Evers, K. Heller-Uszynska, G.
Uszynski, C. Cayla, S. Patarapuwadol, L. Xia, S. Yang, B. Thomson, 2005. The Fast and the Cheap: SNP and
DArTbased Whole Genome Profiling for Crop Improvement. In: Proceedings of the International Congress in
the Wake of the Double Helix: From the Green Revolution to the Gene Revolution (Tuberosa R, Phillips RL and
Gale M, eds.). May 27-31, Bologna, 443-461.
Koutsika-Sotiriou, M., 1999. Hybrid seed production in maize. In Basra AS (Ed.), Heterosis and Hybrid
Seed Production in Agronomic Crops. Food Products Press, New York, pp: 25-64.
Moose, SP., RH. Mumm, 2008. Molecular plant breeding as the foundation for 21 st century crop
improvement. Plant Physiol., 147(3): 969-977.
Porebski, S., L.G. Bailey, R. Baum, 1997. Modification of a CTAB DNA extraction prot°Col for plants
containing high polysaccharide and polyphenol components. Plant Mol. Biol. Rep., 15(1): 8-15.
Reddy, MP., N. Sarla, EA. Siddiq, 2002. Inter simple sequence repeat (ISSR) polymorphism and its
application in plant breeding. Euphytica, 128(1): 9-17.
Sambrook, J., E. Fritsch, T. Maniatis, 1989. Molecular cloning. A laboratory manual. Second edition. Cold
Spring Harbor Laboratory Press, Cold Spring Harbor, New York, USA.
Schlötterer, C., 2004. The evolution of molecular markers-just a matter of fashion? Nat. Rev. Genet., 5: 6369.
Schulman, AH., 2007. Molecular markers to assess genetic diversity. Euphytica, 158(3): 313-321.
Shehzad, T., H. Okuizumi, M. Kawase and K. Okuno, 2009. Development of SSR-based sorghum
(Sorghum bicolor (L.) Moench) diversity research set of germplasm and its evaluation by morphological traits.
Gen. Res. Crop Evol., 56: 809-827.
Springer, NM., RM. Stupar, 2007. Allelic variation and heterosis in maize: How do two halves make more
than a whole? Genome Res., 17: 264-275.
Srdic, J., S. Mladenovic Drinic, Z. Pajic and M. Filipovic, 2007. Characterization of maize inbred lines
based on molecular markers, heterosis and pedigree data. – Genetika, 39(3): 355-363.
Tautz, D., 1989. Hypervariability of simple sequences as a general source for polymorphic DNA markers.
Nucleic Acids Res., 17(16): 6463-6471.
Vos, P., R. Hogers, M. Bleeker, M. Reijans, TV. Lee, M. Hornes, A. Friters, J. Pot, J. Paleman, M. Kuiper,
M. Zabeau, 1995. AFLP: a new technique for DNA fingerprinting. Nucleic Acids Res., 23(21): 4407-4414.
Welsh, J., M. McClelland, 1990. Fingerprinting genomes using PCR with arbitrary primers. Nucleic Acids
Res., 18(24): 7213-7218.
46
Aust. J. Basic & Appl. Sci., 6(10): 42-47, 2012
Wu, M., 2000. Genetic diversity and its relationship to hybrid performance and heterosis in maize as
revealed by AFLPs and RAPDs. Maize Genet. Coop. Newsl., 74: 62-63.
Zietkiewicz, E., A. Rafalski and D. Labuda, 1994. Genomic fingerprinting by simple sequence repeat
(SSR)- anchored polymerase chain reaction amplification. Genomics, 20: 176-183.
47
Baixar