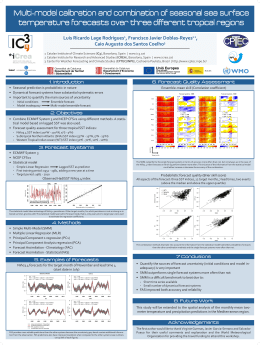
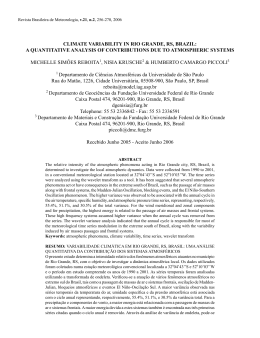
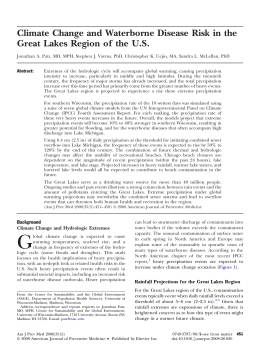
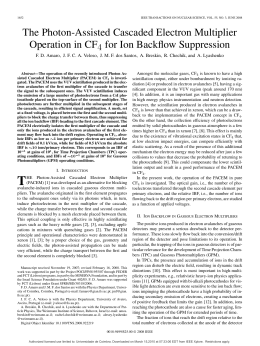
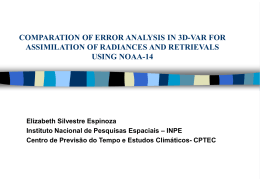
Two-dimensional Pattern of Forecast Model Drift in the Amazon Basin
José Antonio Aravéquia*
Pedro Leite da Silva Dias**
Centro de Previsão do Tempo e Estudos Climáticos
Instituto Nacional de Pesquisas Espaciais
Rod. Dutra km 39, CEP 12630-000 – Cachoeira Paulista – SP
E-mail: [email protected]
** Departamento de Ciências Atmosféricas – Instituto Astronômico e Geofísico –
Universidade de São Paulo
Rua do Matão, 1226 – CEP 05508-900 – São Paulo – SP
E-mail: [email protected]
ABSTRACT
The precipitation forecast drift (bias) at several time intervals of the CPTEC and the NCEP global
models were computed for the period of 1997-1999. The CPTEC model shows less precipitation
than the observations in the Amazon Basin during the summer, indicating that the model is not able
to sustain enough convective forcing. As a result of the precipitation negative bias it is shown that
the upper air flow develops a cyclonic drift. The NCEP model tends to overestimates the
precipitation in the northern portion of the basin and underestimate in the central and southern
portions.
This pattern is shown to be related to the precipitation bias in the Andes. The causes of the
precipitation bias are partially related to the convective parameterization and numerical constraints
associated with the numerical treatment of steep orography. Both models indicate that there is a
significant intraseasonal (20-60 day) signal in the precipitation bias of the 120hr forecast in the
Amazon region which is shown to be related to the Madden Julian oscillation. Thus, there are
periods of higher predictability of the precipitation and periods of lower predictability with period
of the order of 20-60 days.
INTRODUCTION
Several studies have shown that the models forecast drifts have same patterns for a long period (Silva
.
Dias et al., 1994, Caplan et al., 1997), indicating that the generating mechanisms of drift are always present in
the analysis-forecast system. The identification of the origin of the model drift is an essential part for the
improvement of the models.
In this study two series of analysis and forecasts of CPTEC and NCEP global models, for the period of
April 1997 to August 1999, were studied with the objective to identify the main patterns of forecast drifts and
its relation with errors in the precipitation forecast.
The drift patterns that propagate with characteristics of intraseazonal oscillations are studied with the use
of wavelet analysis technique.
Fig. 5 - 72 h Geop. Drift - 200 hPa Mean 10S-10N – GCM CPTEC
Fig. 4 - GPI Precipitation Mean 10S-10N
Erroneous estimates of the intensity and position of anomalous heat sources, which are associated to the
resolution and parameterizations deficiencies of the models, are pointed out as one of possible sources of the
model drifts in the tropics.
Fig. 6 - Wavelet Analysis Geop. Height Drift at 500 hPa over Bolivia High
(A) CPTEC model and (B) NCEP model.
DATA AND METHODOLOGY
The CPTEC (T62) and NCEP (T126) global model forecasts and analysis from April 1997 until August 1999
were used in this study. The precipitation forecasts drift were computed using the CPC estimation.
(B)
(A)
Model Drift
Wavelet transform
Cross Wavelet
Phase
Cross Wavelet
Cross Wavelet
Coherency
Fig. 7 - Cross Wavelet Analysis of Bolivia High Geop. Height Drift at 500 hPa X Central Pacific OLR anomaly
(A) CPTEC model and (B) NCEP model.
RESULTS
As observações indicam que o Brasil Central, o Sudeste e o Nordeste estão sob a influência de uma baixa
em altos níveis, aspecto desfavorável a precipitação em função da subsidência associada a este tipo de circulação
em altitude. O modelo posiciona uma alta no Oceano Pacífico com máximo no oceano atuando também no sul da
América do Sul e na Antártida, sendo que o padrão observado apresenta uma alta sobre o Sul do Brasil e no
extremo sul da América do Sul novamente uma baixa em altitude. Um outro aspecto que não é reproduzido por
esta simulação do modelo é uma circulação anticiclônica que ocupa praticamente toda a América do Norte.
.
(A)
Fig. 3 - Estado médio do escoamento dos primeiros 30 dias (a) e
dos últimos 30 dias (b) da integração com o modelo
forçado com a anomalia de ROLE de janeiro de 2001.
(b)
Fig. 1 – (a) Mean CPTEC 72 h forecast drift of 200
hPa wind and divergence, and (b) 24h
forecast drift of precipitation.
(a)
.
(B)
SUMMARY
• Both, CPTEC and NCEP show similar statistic parameters;
• Drift fields demonstrate that the CPTEC model has weaker convective forcing in the Amazon region,
Bolivia and South Brazil, and anti-cyclonic drift to the east of Northeast Brazil (the Upper Tropospheric
Cold Low);
• Positive divergence drift in the north Argentina and east Andes in CPTEC and NCEP models;
• NCEP model underestimate the precipitation on SACZ, while CPTEC model overestimate after 48
forecast hours;
• NCEP model overestimate the convective forcing over land and tropical ocean region ( ITCZ).
• The drift of both models (CPTEC and NCEP) presents periods of high power in the intraseazonal
scales
• The cross wavelet spectrum show that the drift in the Amazon Bolivian High is connected with the
anomalous heat source in the Central Pacific Ocean.
REFERENCES:
Aravéquia, J. A. 2003: ”Funções de Influência com Dependência Temporal: Aplicações na Interpretação da
Deriva de Prognósticos de Tempo e da Gênese de Anomalias Climáticas”. Tese de Doutorado. Instituto
Astronômico, Geofísico e de Ciências Atmosféricas – Universidade de São Paulo IAG/USP. São Paulo-SP, 2003.
257 p.
Jones, C. and Schemm, J.-K. E., 2000: The Influence of Intraseasonal Variations on Medium- to ExtendedRange Weather Forecast over South America. Mon. Wea. Rev., 128(2), 486-495.
Fig. 3 - Diagram of upper tropospheric drift flow of (a) CPTEC global model
and (b) NCEP global model.
Silva Dias, P. L.; Silva Dias, M. A. F.; Caplan, P. and White, G., 1994: Diagnostic of the MRF forecast drift during
December 1993. VIII Congresso Brasileiro de Meteorologia e II Congresso Latino Americano e Ibérico de
Meteorologia - Belo Horizonte, 18 a 25 de outubro de 1994.
Torrence, C., and Compo, G. P., 1998: A pratical guide to wavelet analysis. Bull. Amer. Meteor. Soc., 79, 61-78.
ACKNOWLEDGEMENTS
Fig. 2 - NCEP 72 h forecast drift of precipitation.
This research is part of the PhD Thesis of the first author that was financial by a CNPq scholarship .
Download