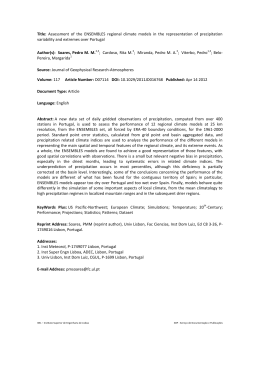
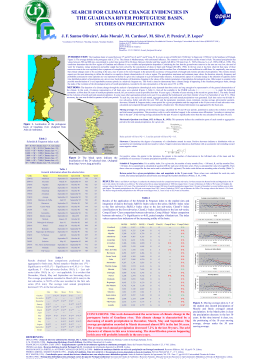
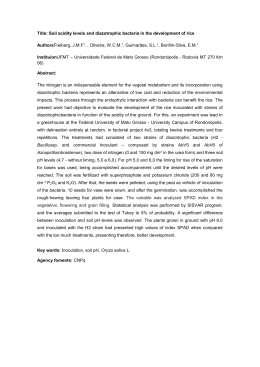
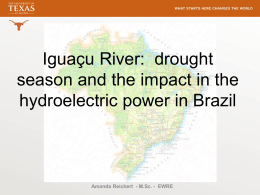
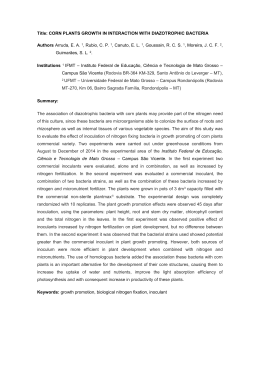
Climate Change and Waterborne Disease Risk in the
Great Lakes Region of the U.S.
Jonathan A. Patz, MD, MPH, Stephen J. Vavrus, PhD, Christopher K. Uejio, MA, Sandra L. McLellan, PhD
Abstract:
Extremes of the hydrologic cycle will accompany global warming, causing precipitation
intensity to increase, particularly in middle and high latitudes. During the twentieth
century, the frequency of major storms has already increased, and the total precipitation
increase over this time period has primarily come from the greater number of heavy events.
The Great Lakes region is projected to experience a rise these extreme precipitation
events.
For southern Wisconsin, the precipitation rate of the 10 wettest days was simulated using
a suite of seven global climate models from the UN Intergovernmental Panel on Climate
Change (IPCC) Fourth Assessment Report. For each ranking, the precipitation rate of
these very heavy events increases in the future. Overall, the models project that extreme
precipitation events will become 10% to 40% stronger in southern Wisconsin, resulting in
greater potential for flooding, and for the waterborne diseases that often accompany high
discharge into Lake Michigan.
Using 6.4 cm (2.5 in) of daily precipitation as the threshold for initiating combined sewer
overflow into Lake Michigan, the frequency of these events is expected to rise by 50% to
120% by the end of this century. The combination of future thermal and hydrologic
changes may affect the usability of recreational beaches. Chicago beach closures are
dependent on the magnitude of recent precipitation (within the past 24 hours), lake
temperature, and lake stage. Projected increases in heavy rainfall, warmer lake waters, and
lowered lake levels would all be expected to contribute to beach contamination in the
future.
The Great Lakes serve as a drinking water source for more than 40 million people.
Ongoing studies and past events illustrate a strong connection between rain events and the
amount of pollutants entering the Great Lakes. Extreme precipitation under global
warming projections may overwhelm the combined sewer systems and lead to overflow
events that can threaten both human health and recreation in the region.
(Am J Prev Med 2008;35(5):451– 458) © 2008 American Journal of Preventive Medicine
Background
Climate Change and Hydrologic Extremes
G
lobal climate change is expected to cause
warming temperatures, sea-level rise, and a
change in frequency of extremes of the hydrologic cycle (more floods and droughts). This study
focuses on the health implications of heavy precipitation, with an in-depth look at related health risks in the
U.S. Such heavy precipitation events often result in
substantial societal impacts, including an increased risk
of waterborne disease outbreaks. Heavy precipitation
From the Center for Sustainability and the Global Environment
(SAGE), Department of Population Health Sciences, University of
Wisconsin-Madison, Madison, Wisconsin
Address correspondence and reprint requests to: Jonathan Patz,
MD, MPH, Center for Sustainability and the Global Environment,
University of Wisconsin-Madison, 1710 University Avenue, Room 258,
Madison WI 53726. E-mail: [email protected].
can lead to stormwater discharge of contaminants into
water bodies if the volume exceeds the containment
capacity. The seasonal contamination of surface water
in early spring in North America and Europe may
explain some of the seasonality in sporadic cases of
many types of waterborne diseases. According to the
North American chapter of the most recent IPCC
report,1 heavy precipitation events are expected to
increase under climate change scenarios (Figure 1).
Rainfall Projections for the Great Lakes Region
For the Great Lakes region of the U.S., contamination
events typically occur when daily rainfall levels exceed a
threshold of about 5– 6 cm (2–2.5 in).2,3 Given that
rainfall extremes are expressions of climate, there is
heightened concern as to how this type of event might
change in a warmer future climate.
Am J Prev Med 2008;35(5)
© 2008 American Journal of Preventive Medicine • Published by Elsevier Inc.
0749-3797/08/$–see front matter
doi:10.1016/j.amepre.2008.08.026
451
Precipitation response (%)
70 N
70 N
70 N
50 N
50 N
50 N
30 N
30 N
30 N
10 N
180
140 W
100 W
60 W
20 W
10 N
180
140 W
100 W
60 W
20 W
10 N
50%
30
20
15
10
5
0
–5
–10
–15
–20
–30
–50
180
140 W
100 W
60 W
20 W
Figure 1. Projected changes in total precipitation from the late twentieth to the late twenty-first centuries, based on
middle-of-the-road increases in greenhouse gases: annual (left), winter (center), and summer (right). Source: IPCC, 20071
Meteorologic theory indicates that the intensity of a
precipitation event is regulated primarily by the local
amount of moisture in the atmosphere during a storm
and that the moisture-holding capacity of the atmosphere increases exponentially with temperature.4 Consequently, expectations are high that more intense
precipitation will accompany global warming. This possibility is supported by many modeling studies that have
simulated the climatic response to increasing concentrations of greenhouse gases.5– 8 Precipitation intensity
(total precipitation divided by the number of wet days)
is projected to increase almost everywhere, particularly
in middle and high latitudes where average precipitation is also expected to increase.9 Most of the Great
Lakes region is projected to experience a rise in both
average and extreme precipitation events.1,10
These anticipated future changes are consistent with
recent trends over the U.S., including the Great Lakes
area. Major storms have been occurring with greater
frequency during the twentieth century, and the total
precipitation increase over this period has resulted disproportionately from the increase in heavy events.11–13 This
trend has been accentuated by the increase in heavy
events toward the end of the century, the time of most
pronounced global warming.14,15
These large-scale findings were tailored to the
Wisconsin–Chicago region, where we are conducting
research on the health impacts of extreme events. In
one example, the recent and future simulated precipitation rate of the 10 wettest days were computed for the
Madison WI area from seven global climate models
(GCMs) used in the UN Intergovernmental Panel on
Climate Change (IPCC) Fourth Assessment Report1
(Figure 2). For each ranking (tenth wettest day to the
wettest day), the precipitation rate of these very heavy
events increases in the future, and the enhancements
are most pronounced for the most extreme events (wettest and second wettest days). Overall, the models project
that these extremely heavy precipitation events will become 10% to 40% stronger in southern Wisconsin,
resulting in greater potential for flooding and for the
waterborne diseases that often accompany high discharge into Lake Michigan.3
452
A somewhat different approach was used to estimate
future changes in extreme precipitation over Chicago.
For this application, the GCM output from two representative models, the geophysical fluid dynamics laboratory (GFDL) model and the parallel climate model
(PCM) was statistically downscaled to provide higherresolution information. Statistical downscaling uses historical observational data to tailor projections from a
global model to a local scale. A statistical relationship is
first established between a location’s measured precipitation and the corresponding climate model output
during a prior time interval, typically around 30 years.
This historical relationship— between climate model
output at the relatively coarse scale of the GCM and
the daily precipitation values recorded on the local
scale—is then used to downscale future model projections to the same local scale. This method assumes that
Figure 2. GCM-simulated precipitation amounts in southern
Wisconsin for the 10 wettest days in the late twentieth and late
twenty-first centuries (10 days total for each century), based
on middle-of-the-road projected increases in greenhouse
gases.
GCM, global climate model
American Journal of Preventive Medicine, Volume 35, Number 5
www.ajpm-online.net
variable that is expected to increase in the future.17 The
combination of future thermal and hydrologic changes
may affect the usability of recreational beaches. Chicago beach closures are dependent on the magnitude
of recent precipitation (within the past 24 hours), lake
temperature, and lake stage (i.e., height of the water
surface above an established level).18 Projected increases in heavy rainfall, warmer lake waters, and
lowered lake levels19 would all be expected to enhance
beach contamination in the future. Although more
extreme rainfalls would seem to contradict the projection of lower lake levels, the latter expectation stems
from a large anticipated increase in evaporation at the
lake surface (which can offset the precipitation gain)
and a higher proportion of future precipitation falling
as heavy events, even if the total precipitation amount
does not rise.
Vulnerability Factors
Figure 3. Projected change in the frequency of heavy precipitation in Chicago by the late twenty-first century, based on
downscaled climate model output for high-end and low-end
greenhouse gas emissions scenarios from two global climate
models used in the Chicago Climate Impact Assessment.
Source: Hayhoe and Wuebbles2
the relationships between large- and small-scale processes remain the same over time.
The change was analyzed in the frequency of heavy
daily precipitation events, ranging from 1 to 5 cm
(0.4 –2.0 in), between the late twentieth and late twentyfirst centuries (Figure 3). Although the precise changes
are dependent on the assumed greenhouse gas emissions
scenario, the results clearly indicate more frequent extreme events, ranging from ⱕ10% increases for 1–1.5 cm
(0.4 – 0.6 in) events to ⬎60% for the heaviest storms
(ⱖ4 cm [ⱖ1.6 in]) in the high-emissions scenario.
Using 6.35 cm (2.5 in) of daily precipitation as the
threshold for initiating combined sewer overflow into
Lake Michigan,2 the frequency of these events is expected to rise by 50%–120% by the end of this century.
This translates into an expected occurrence of about
one event every other year in the recent past to
approximately one event every year (low-emissions scenario) to 1.2 events every year (high-emissions scenario) by the end of this century.2
The expected changes in the hydrologic cycle, including increases in extreme precipitation events,
should have a direct bearing on waterborne diseases in
the Great Lakes. For example, the 1993 Cryptosporidium
outbreak in Milwaukee was preceded by the heaviest
rainfall in 50 years in the associated watersheds.16
Summertime bacteria concentrations in an inland lake
in Wisconsin (Lake Geneva) exhibit positive, significant
correlations not only with mean summertime rainfall
but also with the duration between rainfall events, a
November 2008
Even today, many of our community water systems can
be overburdened by extreme rainfall events. Heavy
rainfall or snow melt can exceed the capacity of the
sewer system or treatment plant, which are designed to
discharge the excess wastewater directly into surface
water bodies.20,21 In urban watersheds, more than 60%
of the annual loads of all contaminants are transported
during storm events.22 In general, turbidity increases
during storm events, and studies have recently shown a
correlation between increases in turbidity and illness in
communities.23,24 Also, higher winter temperatures
could further enhance flooding from the contribution
of snow melt.
Combined Sewage Overflows and Aging
Water Infrastructure
Older cities around the nation have combined sewer
systems, which are designed to capture both sanitary
sewage and stormwater and convey these flows to
a wastewater treatment plant. Large rain events can
overwhelm these systems, causing untreated sewage
mixed with stormwater to be released directly into receiving waters. The U.S. Environmental Protection Agency
(EPA) has estimated that 770 communities release
more than 3.2 trillion liters (850 billion gallons) of
combined sewage to the nation’s waterways annually.25
As infrastructure improvements to sewer system capacity are made, the number of combined sewer
overflows can be decreased. For example, the construction of an inline storage system in Milwaukee
reduced the number of combined sewer overflows
from 40 – 60 per year to 0 – 4 per year (with the
average approximating 1.5 per year over the past 10
years). However, it remains difficult to capture the most
extreme events. Changing weather patterns that bring
Am J Prev Med 2008;35(5)
453
more extreme storms to some regions may outpace the
infrastructure improvements.
Case Study
Climate and water quality in Milwaukee. The urban
environment presents unique risks of water contamination. Runoff from impervious surfaces contains metals,
pesticides, pathogens, and fecal indicator bacteria. It
has been linked to adverse public health effects.26 –28 In
most municipal areas, urban stormwater is conveyed in
separated sewer systems and discharged directly into
receiving waters. Aging infrastructure may cause sanitary sewage to infiltrate into stormwater pipes, where it
is essentially discharged with no treatment. Beaches are
often located in urbanized areas and highly susceptible
to stormwater impacts.29 –31 Accelerating development
of urban coastal areas and changing storm patterns may
synergistically increase the amounts of urban stormwater released into coastal systems.
The Milwaukee River Basin consists of 1440 km2 (556
miles2) of rural, agricultural, suburban, and urban land
use. The basin’s watersheds drain to three major rivers
that converge in downtown Milwaukee and discharge
through a 140 m (0.09 mile) channel leading to Lake
Michigan. Following storm events, the fecal indicator
bacteria Escherichia coli can be detected in the channel
at levels as high as 2000 –7000 colony forming units
(CFU)/100 ml. These levels are 10 times higher than
the EPA-recommended limit for recreational waters.32
The presence of E. coli demonstrates that fecal pollution is present; however, given the complexity of this
system, the bacteria may come from agricultural runoff,
urban stormwater, or sanitary sewage. Human viruses
have been detected at this same site following storm
events with no reported sewage overflows, providing
evidence that sanitary sewage may be continually released into the basins tributaries. Storm events of ⬎3
inches of rainfall within 24 hours may overwhelm the
combined sewer systems and lead to an overflow. In this
case, the levels of E. coli detected in the channel leading
to Lake Michigan can be up to 10 times higher (e.g.,
20,000 –50,000 CFU/100 ml) than when there are no
sewage overflows.3 These events generally occur less
than three times per year, and do not occur at all in dry
years (Figure 4).
Milwaukee is not unique in terms of its impact on the
lake; many cities around the Great Lakes are situated
near major rivers that come from a complex mixture of
watershed sources. The Great Lakes, which serve as a
drinking water source for more than 40 million people,
are particularly susceptible to fecal pollution and can
become reservoirs for waterborne diseases. Ongoing
studies and past events illustrate a strong connection
between rain events and the amount of pollutants
entering the Great Lakes. The 1993 Cryptosporidium
outbreak in Milwaukee, which sickened more than
454
Figure 4. Levels of E. coli in the Milwaukee estuary, which
discharges to Lake Michigan, 2001–2007, during base flow
(n⫽46); following rain events with no CSO (n⫽70); and
following CSO events (n⫽54). Boxes indicate 75% of values,
with median values drawn in each. Whiskers are 95% of values
and outliers are shown as closed circles. There were significant differences in E. coli levels following rainfall and CSOs
compared to base flow (pⱕ0.05).
CFU, colony forming units; CSO, combined sewer overflow
400,000 people, coincided with record high flows in the
Milwaukee River, a reflection of the amount of rainfall
in the watershed.16
Land-Use Patterns
Land cover conversion to impervious surfaces (such as
roadways and parking lots) increases both the volume
and velocity of stormwater runoff, while also reducing
groundwater infiltration.33 The percentage of impervious surface within a watershed, for example, explains
most of the variability for indicator bacteria across
watersheds.34 Bacteria levels also tend to be elevated in
agricultural catchments with higher levels of grazing
cattle and sheep.35 Zoning and development policies
can be a strong influence on the amount of impervious
surface within each municipality.36
Pathways of Human Exposure
Drinking Water
Waterborne disease outbreaks stemming from drinking
water source contamination require a combination of
determining factors. The requirements include: contamination of the source water, transport of the contaminant to the water intake or well of the drinking
water system, insufficient treatment to reduce the level
of contamination, and exposure to the contaminant.
Recontamination of treated water may also occur at
the public or homeowner’s distribution system level.37
Waterborne disease outbreaks from all causes in the
U.S. are distinctly seasonal, clustered in key watersheds,
and associated with heavy precipitation.16 In Walkerton, Ontario, in May 2000, heavy precipitation com-
American Journal of Preventive Medicine, Volume 35, Number 5
www.ajpm-online.net
Precipitation events and subsequent runoff may flush
pathogens and indicator bacteria directly into water bodies
and overwhelm or decrease the
efficiency of the sewage disposal infrastructure. Although
pathogens tend to co-occur
with indicator bacteria, indicators are prone to false positive readings. Indicator bacteria may survive in soil
sediments or beach sand, become re-suspended during a
precipitation event, and confound estimates of waterborne
disease risk.30,43,44 The periodicity and amplitude of contamination events are likely affected
by processes that re-suspend or
transport pathogens.45,46 Indicator bacteria are influenced by
precipitation events up to a week
prior to sample collection although recent precipitation
Figure 5. Relationship between rainfall and beach contamination, Lake Geneva, Wisconsin
CFU, colony-forming units
(0 –3 days) tends to exhibit
the strongest relationships with
their numbers.16 Interval time
between rainfall events can inbined with failing infrastructure contaminated drinkcrease
pollutant
accumulation
and subsequent loading water with E. coli 0157:H7 and Campylobacter jejuni,
18,47
ing
into
water
bodies.
A
disproportionately
large
resulting in an estimated 2300 illnesses and seven
38
pollutant
mass
similarly
may
be
transported
with
the
deaths.
first precipitation event following the dry season in
mid-latitude locations.48,49 Figure 5 shows an example
Recreational Water and Stormwater Issues
of rainfall and contamination levels for Lake Geneva
Heavy runoff after severe rainfall can also contaminate
WI. Unseasonably high precipitation typically increases
recreational waters and increase the risk of human
indicator bacteria loading into water bodies.50 Earth
39
illness through higher bacterial counts. This associasystem processes like the El Niño Southern Oscillation
tion is strongest at beaches closest to rivers.40 Ear, nose,
(ENSO) strongly influence interannual precipitation
and throat; respiratory; and gastrointestinal illnesses
and therefore must be taken into account, especially
are commonly associated with recreational swimming
for contamination events between September and
in fresh and oceanic waters. Less abundant and potenMarch.50 –52
tially more severe waterborne diseases such as hepatitis,
giardiasis, cryptosporidiosis, and toxic algal blooms
Resulting Waterborne Illnesses
pose serious health threats to vulnerable human populations and local wildlife. Swimmers have an elevated
Agents of disease. More than 100 different types of
risk of contracting gastrointestinal illnesses versus nonpathogenic bacteria, viruses, and protozoa can be
swimmers, and this risk generally increases with profound in contaminated water.53–55 Many of these have
41
longed exposure. Frequent water users, such as lifebeen implicated in a variety of illnesses transmitted by
guards or recreational enthusiasts, are at risk for
food or water.
waterborne disease, and young children, the elderly,
Waterborne and foodborne diseases continue to
pregnant women, and the immunocompromised have
cause significant morbidity in the U.S. In 2002, there
the greatest risk of suffering serious complications.41,42
were 1330 water-related disease outbreaks,56 34 from
Macrodemographic trends toward an older and more
recreational water and 30 from drinking water.57,58 In
immunocompromised U.S. population suggest that vulrecreational water, bacteria accounted for 32% of outnerability to waterborne pathogens will continue to
breaks, parasites (primarily Cryptosporidium) for 24%,
increase.
and viruses for 10%.57 Bacteria were the most comNovember 2008
Am J Prev Med 2008;35(5)
455
monly identified agent in drinking water (29%, primarily Campylobacter) followed by parasites and viruses
(each 5%).58 Gastroenteritis continues to be the primary disease associated with food and water exposure.
In 2003 and 2004, gastroenteritis was noted in 48% and
68% of reported recreational and drinking water outbreaks, respectively.57,58
Surveillance
Variability of indicator bacteria is controlled by the
physical dynamics of each water body, and quality can
be inferred from water’s chemical and biologic qualities. Prevailing wind direction, toward or away from the
beach, modulates biophysical environment and indicator bacteria relationships in large water bodies.46 Tidal
cycles in large water bodies enhance indicator bacteria
exchange from subsurface and soil reservoirs.59,60 Elevated nitrate, ammonium, and caffeine in water quality
measurements suggest recent cross-contamination with
sewage-like materials.61,62 Recent advances in molecular detection techniques have developed alternative
indicators that are human-specific (e.g., demonstrating
sewage inputs) such as human-specific Bacteroides spp.,
Methanobrevibacter smithii, and the surface protein gene
present in enterococcus (esp).63– 65 Precipitation and
subsequent runoff events increase nutrient loading into
water bodies, potentially enhancing floral productivity
and water chlorophyll levels.46 Indicator bacteria survival is inversely related to water salinity and survival
exponentially decreases with the duration and magnitude of solar radiation exposure.66 Surface water runoff
also disturbs and re-suspends sediments, increases water turbidity, decreases solar radiation, and proportionally increases indicator bacteria loading into water
bodies.46
Conclusion and Recommendations
A broad range of improvements can be made toward
attaining safe water quality in the U.S. These include
such activities as data collection/surveillance, infrastructure improvements, land use planning, education,
and research. Ultimately, better assessment of water
quality and risk to the drinking water system from the
watershed to the tap, as well as recreational water
exposures, will allow for better prevention and controls
to limit the impact of contamination events.
Data Collection
Based on the current state of surveillance, better indicators of fecal pollution are required. Public health
officials and water managers need especially to be
informed about the source of contamination, which
could be from farm runoff, stormwater, or sanitary
sewage.67 Progress has been made in the field of
microbial source tracking in terms of identifying
456
source-specific alternative indicators, and molecular
approaches offer a broader range of target organisms
because they are not dependent on culture (for reviews, see Santo Domingo et al.68 and Savichtcheva and
Okabe69). These have been used successfully in field
studies.70 –72 However, widespread implementation will
require extensive validation (including geographic differences), further assay development to reduce cost
and complexity of new assay procedures, and standardization for use in public health laboratories.
One of the disadvantages of the current system is that
the outbreaks are detected after the fact—that is, after
the contamination event and after individuals have
become ill. The disease surveillance system is incapable
of detecting outbreaks when diagnosed cases are not
reported to health departments, such as when mild
symptoms are attributed to other causes or when health
problems cannot be treated medically. In addition,
delays exist in detecting outbreaks because of the time
necessary for laboratory testing and reporting of findings. Predictive forecasts of swimming-related health
risk currently support beach management decisions at
some U.S. coastal oceanic and Great Lakes beaches.46,73,74 Near-term forecast models require knowledge
of the relationships between beach-specific environments and swimming health risks, collected and refined
over multiple years of observations. Forecast models
tend to have high sensitivity but relatively lower specificity and are therefore prone to false positive predictions of unsafe swimming conditions. Future research
should investigate the extent to which dynamic environmental conditions can augment alternative humanspecific pathogen indicators.
Infrastructure Improvements
This article has given specific examples of shortcomings
in our current water systems. Upgrading sewage/stormwater infrastructure will obviously decrease the incidence of waterborne pathogen pollution.59,75 For example, ⱕ20% of childhood bacterial or viral diarrheal
illnesses can be attributed to the density of holding
tanks and other septic tanks.76 Improperly managed
holding septic tanks discharge untreated sewage and
contaminate surface water. Improving infrastructure
may further reduce risks of contamination from extreme weather events.
Land use/watershed protection. Watershed protection
will continue to be an extremely important factor
influencing water quality.67 Watershed water quality has
a direct impact on source water and processed water
quality as well as on recreational sites and coastal
waters. Better farming practices (to capture and treat
agricultural wastes) and surrounding vegetation buffers, along with improved city disposal systems to capture and treat wastes, would reduce the runoff of
nutrients, toxic chemicals, trace elements, and micro-
American Journal of Preventive Medicine, Volume 35, Number 5
www.ajpm-online.net
organisms flowing into reservoirs, groundwater, lakes,
rivers, estuaries, and coastal zones.
Education and research. According to Rose and others,67 coordinated monitoring of physical, chemical,
and biologic parameters should go toward building
databases and integrated models that include environmental, ecologic, and social conditions, consequences,
and costs. Collaborative, multidisciplinary training and
research—involving health and veterinary professionals, biologists, ecologists, physical scientists, database
specialists, modelers, and economists—is required to
carry out comprehensive assessments and management
plans. Interagency agreements will be needed to coordinate and support this initiative. Testing models and
hypotheses based on observed temporal and spatial
co-occurrences may help focus research policies. It is
essential to better delineate—in time and location—the
occurrence of disease and to maintain standardized
health databases.
Waterborne diseases remain a major public health
problem in the U.S. and around the world. Enhanced
understanding of the weather-sensitivity of many waterborne diseases is necessary along with improved surveillance, watershed/source water protection, and educational programs to improve the safety of our water.
Scenarios of future global warming accompanied by
climatic extremes only increase the importance of these
improvements.
The research conducted by Jonathan Patz, Stephen Vavrus,
and Christopher Uejio is supported under a grant from the
U.S. EPA STAR grants program, grant # R 832752010 entitled
Health Risks from Climate Variability and Change in the
Upper Midwest: a Place-based Assessment of Climate-related
Morbidity. Contributions by Sandra McLellan are supported
by NOAA Oceans and Human Health Initiative extramural
grant NA05NOS4781243.
No financial disclosures were reported by the authors of
this paper.
References
1. Intergovernmental Panel on Climate Change. Climate change 2007: impacts, adaptation and vulnerability. Contribution of Working Group II to
the Fourth Assessment Report of the Intergovernmental Panel on Climate
Change. Parry ML, Canziani OF, Palutikof JP, van der Linden PJ, Hanson
CE, eds. Cambridge UK: Cambridge University Press, 2007. www.ipcc.ch/
ipccreports/ar4-wg2.htm.
2. Hayhoe K, Hellmann J, Lesht B, Nadelhoffer K, Wuebbles D. 2008: Climate
change and Chicago: projections and potential impacts. An Assessment
Prepared for the City of Chicago. In press.
3. McLellan SL, Hollis EJ, Depas MM, Van Dyke M, Harris J, Scopel CO.
Distribution and fate of Escherichia coli in Lake Michigan following
contamination with urban stormwater and combined sewer overflows. J
Great Lakes Res 2007;33:566 – 80.
4. Trenberth KE. Conceptual framework for changes of extremes of the
hydrological cycle with climate change. Clim Change 1999;42:327–39.
5. Barnett DN, Brown SJ, Murphy JM, Sexton DMH, Webb MJ. Quantifying
uncertainty in changes in extreme event frequency in response to doubled
CO2 using a large ensemble of GCM simulations. Clim Dynamics
2006;26:489 –511.
November 2008
6. Kharin VV, Zwiers FW. Estimating extremes in transient climate change
simulations. J Clim 2005;18:1156 –73.
7. Meehl GA, Arblaster JM, Tebaldi C. Understanding future patterns of
increased precipitation intensity in climate model simulations. Geophys
Res Lett 2005;32:doi:10.1029/2005GL023680.
8. Wilby RL, Wigley TML. Future changes in the distribution of daily precipitation totals across North America. Geophys Res Lett 2002;29:
doi:10.1029/2001GL013048.
9. Tebaldi C, Hayhoe K, Arblaster JM, Meehl GA. Going to the extremes. Clim
Change 2006;79(3– 4):185–211.
10. Diffenbaugh NS, Pal JS, Trapp RJ, Giorgi F. Fine-scale processes regulate
the response of extreme events to global climate change. Proc Natl Acad
Sci 2005;102:15774 – 8.
11. Changnon SA, Kunkel KE. Climate-related fluctuations in Midwestern
floods during 1921–1985. J Water Resources Plann Manage 1995;121:
326 –34.
12. Karl TR, Knight RW. Secular trends of precipitation amount, frequency,
and intensity in the United States. Bull Am Meteor Soc 1998;79:231– 41.
13. Karl TR, Knight RW, Plummer N. Trends in high-frequency climate
variability in the 20th-century. Nature 1995;377:217–20.
14. Groisman PY, Knight RW, Karl TR, Easterling DR, Sun BM, Lawrimore JH.
Contemporary changes of the hydrological cycle over the contiguous
United States: trends derived from in situ observations. J Hydrometeorology 2004;5:64 – 85.
15. Kunkel KE, Easterling DR, Redmond K, Hubbard K. Temporal variations of
extreme precipitation events in the United States: 1895–2000. Geophys Res
Lett 2003;30:doi:10.1029/2003GL018052.
16. Curriero FC, Patz JA, Rose JB, Lele S. The association between extreme
precipitation and waterborne disease outbreaks in the United States,
1948 –1994. Am J Public Health 2001;91:1194 –9.
17. Allen MR, Ingram WJ. Constraints on future changes in climate and the
hydrologic cycle. Nature 2002;419:224 –32.
18. Olyphant GA, Whitman RL. Elements of a predictive model for determining beach closures on a real time basis: the case of 63rd Street Beach
Chicago. Environ Monit Assess 2004;98(1–3):175–90.
19. Kunkel R, Wendland F, Hannappel S, Voigt HJ, Wolter R. The influence of
diffuse pollution on groundwater content patterns for the groundwater
bodies of Germany. Water Sci Technol 2007;55:97–105.
20. Perciasepe R. Combined sewer overflows: where are we four years after
adoption of the CSO control policy? Washington DC: EPA Office of
Wastewater Management, 1998.
21. Rose JB, Simonds J. King County water quality assessment: assessment of
public health impacts associated with pathogens and combined sewer
overflows. Seattle WA: Report for Water and Land Resources Division, Dept
of Natural Resources, 1998.
22. Fisher GT, Katz BG. Urban stormwater runoff: selected background
information and techniques for problem assessment with a Baltimore
Maryland case study. Baltimore MD: U.S. Geological Survey Water-Supply
Paper 2347, 1988.
23. Morris RD, Naumova EN, Levin R, Munasinghe RL. Temporal variation in
drinking water turbidity and diagnosed gastroenteritis in Milwaukee. Am J
Public Health 1996;86:237–9.
24. Schwartz J, Levin R, Hodge K. Drinking water turbidity and pediatric
hospital use for gastrointestinal illness in Philadelphia. Epidemiology
1997;8:615–20.
25. U.S. Environmental Protection Agency. Impacts and control of CSOs and
SSOs. Washington DC: U.S. Environmental Protection Agency Office of
Water, 2004. Report No.: EPA 833-R-04-001.
26. Bannerman RT, Owens DW, Dodds RB, Hornewer NJ. Sources of pollutants in Wisconsin stormwater. Water Sci Technol 1993;28(3–5):241–59.
27. Gaffield SJ, Goo RL, Richards LA, Jackson RJ. Public health effects of
inadequately managed stormwater runoff. Am J Public Health 2003;93:
1527–33.
28. Haile RW, Witte JS, Gold M, et al. The health effects of swimming in ocean
water contaminated by storm drain runoff. Epidemiology 1999;10:355– 63.
29. Scopel CO, Harris J, McLellan SL. Influence of nearshore water dynamics
and pollution sources on beach monitoring outcomes at two adjacent Lake
Michigan beaches. J Great Lakes Res 2006;32:543–52.
30. Whitman RL, Nevers MB. Foreshore sand as a source of Escherichia coli in
nearshore water of a Lake Michigan beach. Appl Environ Microbiol
2003;69:5555– 62.
31. Yamahara KM, Layton BA, Santoro AE, Boehm AB. Beach sands along the
California coast are diffuse sources of fecal bacteria to coastal waters.
Environ Sci Technol 2007;41:4515–21.
Am J Prev Med 2008;35(5)
457
32. US Environmental Protection Agency. Improved enumeration methods for
recreational water quality indicators: Enterococci and Escherichia coli.
Washington DC: US Environmental Protection Agency Office of Water,
Office of Science and Technology, 2000. Report No: EPA 821/R-97/004.
33. Arnold CL, Gibbons JC. Impervious surface coverage. J Am Plann Assoc
1996;62:243–58.
34. Mallin MA, Williams KE, Esham EC, Lowe RP. Effect of human development on bacteriological water quality in coastal watersheds. Ecol Appl
2000;10:1047–56.
35. Crowther J, Kay D, Wyer MD. Faecal-indicator concentrations in waters
draining lowland pastoral catchments in the UK: relationships with land
use and farming practices. Water Res 2002;36:1725–34.
36. Stone B, Bullen JL. Urban form and watershed management: how zoning
influences residential stormwater volumes. Environ Plann B Plann Des
2006;33:21–37.
37. Anonymous. Cryptosporidium in water supplies. London: Department of
the Environment, Department of Health, 1990.
38. Hrudey SE, Payment P, Huck PM, Gillham RW, Hrudey EJ. A fatal
waterborne disease epidemic in Walkerton Ontario: comparison with other
waterborne outbreaks in the developed world. Water Sci Technol
2003;47:7–14.
39. Schuster CJ, Ellis A, Robertson WJ, Charron DF, Aramini JJ, Marshall B,
Medeiros DT. Infectious disease outbreaks related to drinking water in
Canada, 1974 –2001. Can J Public Health 2005;96:254 – 8.
40. Dwight RH, Semenza JC, Baker DB, Olson BH. Association of urban runoff
with coastal water quality in Orange County California. Water Environ Res
2002;74:82–90.
41. Wade TJ, Pai N, Eisenberg JN, Colford JM, Jr. Do U.S. Environmental
Protection Agency water quality guidelines for recreational waters prevent
gastrointestinal illness? A systematic review and meta-analysis. Environ
Health Perspect 2003;111:1102–9.
42. Gerba C, Rose J, Haas C, Crabtree K. Waterborne rotavirus: a risk
assessment. Water Res 1996;30:2929 – 40.
43. Colford JM Jr, Wade TJ, Schiff KC, Wright CC, Griffith JF, Sandhu SK, et al.
Water quality indicators and the risk of illness at beaches with nonpoint
sources of fecal contamination. Epidemiology 2007;18:27–35.
44. McLellan SL, Salmore AK. Evidence for localized bacterial loading as the
cause of chronic beach closings in a freshwater marina. Water Res
2003;37:2700 – 8.
45. Kim JH, Grant SB, McGee CD, Sanders BF, Largier JL. Locating sources of
surf zone pollution: a mass budget analysis of fecal indicator bacteria at
Huntington Beach California. Environ Sci Technol 2004;38:2626 –36.
46. Nevers MB, Whitman RL. Nowcast modeling of Escherichia coli concentrations at multiple urban beaches of southern Lake Michigan. Water Res
2005;39:5250 – 60.
47. Ackerman D, Weisberg SB. Relationship between rainfall and beach
bacterial concentrations on Santa Monica Bay beaches. J Water Health
2003;1:85–9.
48. Bertrand-Krajewski J, Chebbo G, Saget A. Distribution of pollutant mass vs
volume in stormwater discharges and the first flush phenomenon. Water
Res 1998;32:2341–56.
49. Krometis LA, Characklis GW, Simmons OD, 3rd, Dilts MJ, Likirdopulos CA,
Sobsey MD. Intra-storm variability in microbial partitioning and microbial
loading rates. Water Res 2007;41:506 –16.
50. Lipp EK, Kurz R, Vincent R, Rodriguez-Palacios C, Farrah SR, Rose JB. The
effect of seasonal variability and weather on microbial fecal pollution and
enteric pathogens in a subtropical estuary. Estuaries 2001;24:266 –76.
51. Chigbu P, Gordon S, Strange T. Influence of inter-annual variations in
climatic factors on fecal coliform levels in Mississippi Sound. Water Res
2004;38:4341–52.
52. Emiliani F. Effects of hydroclimatic anomalies on bacteriological quality of
the Middle Parana River (Santa Fe Argentina). Rev Argent Microbiol
2004;36:193–201.
53. Asai S, Krzanowski JJ, Anderson WH, et al. Effects of toxin of red tide,
Ptychodiscus brevis, on canine tracheal smooth muscle: a possible new
asthma-triggering mechanism. J Allergy Clin Immunol 1982;69:418 –28.
54. American Society for Microbiology. Microbial pollutants in our nation’s
water: environmental and public health issues. Washington DC: American
Society for Microbiology, Office of Public Affairs, 1998.
55. American Water Works Association. Protecting public health. Boston:
AWWA, 1996.
458
56. Lynch M, Painter J, Woodruff R, Braden C. Surveillance for foodbornedisease outbreaks—United States, 1998 –2002. MMWR Surveill Summ
2006;55:1– 42.
57. Dziuban EJ, Liang JL, Craun GF, et al. Surveillance for waterborne disease
and outbreaks associated with recreational water—United States, 2003–
2004. MMWR Surveill Summ 2006;55:1–30.
58. Liang JL, Dziuban EJ, Craun GF, et al. Surveillance for waterborne disease
and outbreaks associated with drinking water and water not intended for
drinking—United States, 2003–2004. MMWR Surveill Summ 2006;55:
31– 65.
59. Boehm AB, Grant SB, Kim JH, et al. Decadal and shorter period variability
of surf zone water quality at Huntington Beach, California. Environ Sci
Technol 2002;36:3885–92.
60. Boehm AB, Weisberg SB. Tidal forcing of enterococci at marine recreational beaches at fortnightly and semidiurnal frequencies. Environ Sci
Technol 2005;39:5575– 83.
61. Olyphant GA, Thomas J, Whitman RL, Harper D. Characterization and
statistical modeling of bacterial (Escherichia coli) outflows from watersheds that discharge into southern Lake Michigan. Environ Monit Assess
2003;81(1–3):289 –300.
62. Scott TM, Rose JB, Jenkins TM, Farrah SR, Lukasik J. Microbial source
tracking: current methodology and future directions. Appl Environ Microbiol 2002;68:5796 – 803.
63. Bernhard AE, Field KG. Identification of nonpoint sources of fecal
pollution in coastal waters by using host-specific 16S ribosomal DNA
genetic markers from fecal anaerobes. Appl Environ Microbiol
2000;66:1587–94.
64. Scott TM, Jenkins TM, Lukasik J, Rose JB. Potential use of a host associated
molecular marker in Enterococcus faecium as an index of human fecal
pollution. Environ Sci Technol 2005;39:283–7.
65. Ufnar JA, Wang SY, Christiansen JM, Yampara-Iquise H, Carson CA,
Ellender RD. Detection of the nifH gene of Methanobrevibacter smithii: a
potential tool to identify sewage pollution in recreational waters. J Appl
Microbiol 2006;101:44 –52.
66. Whitman RL, Nevers MB, Korinek GC, Byappanahalli MN. Solar and
temporal effects on Escherichia coli concentration at a Lake Michigan
swimming beach. Appl Environ Microbiol 2004;70:4276 – 85.
67. Rose JB, Epstein PR, Lipp EK, Sherman BH, Bernard SM, Patz JA. Climate
variability and change in the United States: potential impacts on water- and
foodborne diseases caused by microbiologic agents. Environ Health Perspect 2001;109:S:211–21.
68. Santo Domingo JW, Bambic DG, Edge TA, Wuertz S. Quo vadis source
tracking? Towards a strategic framework for environmental monitoring of
fecal pollution. Water Res 2007;41:3539 –52.
69. Savichtcheva O, Okabe S. Alternative indicators of fecal pollution: relations
with pathogens and conventional indicators, current methodologies for
direct pathogen monitoring and future application perspectives. Water Res
2006;40:2463–76.
70. Bower PA, Scopel CO, Jensen ET, Depas MM, McLellan SL. Detection of
genetic markers of fecal indicator bacteria in Lake Michigan and determination of their relationship to Escherichia coli densities using standard
microbiological methods. Appl Environ Microbiol 2005;71:8305–13.
71. Brownell MJ, Harwood VJ, Kurz RC, McQuaig SM, Lukasik J, Scott TM.
Confirmation of putative stormwater impact on water quality at a Florida
beach by microbial source tracking methods and structure of indicator
organism populations. Water Res 2007;41:3747–57.
72. Santoro AE, Boehm AB. Frequent occurrence of the human-specific
Bacteroides fecal marker at an open coast marine beach: relationship to
waves, tides and traditional indicators. Environ Microbiol 2007;9:2038 – 49.
73. Bruesch ME, Biedrzycki PA. Preliminary comparative analysis of two models
used to predict E. coli levels in recreational water in Milwaukee. Great
Lakes Beach Conference, Oct 3, 2002.
74. Kuntz JE, Murray R. Non-point source of bacteria at the beach. Stamford
CT: Laboratory HD, 1996.
75. Nevers MB, Whitman RL, Frick WE, Ge Z. Interaction and influence of two
creeks on Escherichia coli concentrations of nearby beaches: exploration
of predictability and mechanisms. J Environ Qual 2007;36:1338 – 45.
76. Crowther J, Kay D, Wyer MD. Relationships between microbial water quality
and environmental conditions in coastal recreational waters: the Fylde
coast UK. Water Res 2001;35:4029 –38.
American Journal of Preventive Medicine, Volume 35, Number 5
www.ajpm-online.net
Download