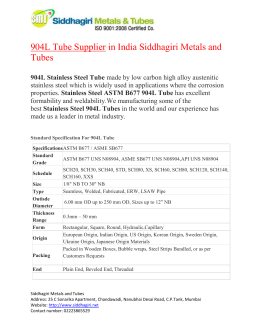
2012-36-0457
Structural Integrity Analysis of the Charging Air Tube Support for a
Diesel Engine of Commercial Vehicle
Thiago Barão Negretti , Helio Kitagawa
T-Systems do Brasil
Antonio Augusto Couto
Universidade Presbiteriana Mackenzie
IPEN-CNEN/SP
Carlos Miletovic, Alex Petruk
Mercedes-Benz do Brasil
Copyright © 2012 SAE International
ABSTRACT
The study is carried out through numerical and experimental
methods. The finite element method is used to simulate the
support mechanical behavior via modal analysis, and for the
evaluation of stress concentration regions through pressure
and thermoelastic static analyses, and dynamic analysis. The
fatigue life is calculated for the presented stresses.
Stress, acceleration and temperature data were obtained
through dynamic test. For material evaluation, chemical
analysis, hardness and metallographic analysis were carried
out. For thoroughness, a failed support fractography will be
presented.
The objective of this study is to correlate the data obtained by
numerical method with experimental data, and as a result, the
support failure mechanism was identified. A modified support
is presented to avoid the failure for the determined loads.
support life. Avoiding failure due to the new working
conditions motivates the structural components study.
The diesel engine charging air tube support has a important
structural function and it failure affects parts that precludes the
engine operation.
THE CHARGING AIR TUBE SUPPORT
The diesel engine charging air tube support, produced from
hot rolled steel, has the important structural function of
supporting the charging air tube, fixed on the turbine and the
intercooler. The tube or turbine failure precludes the engine
operation. The support also has the function of reducing the
displacements imposed on the turbine by engine vibrations
that may damage the structure of the mentioned assembly.
The Figure 1 illustrates the studied support. The Figure 2
presents the support position in the engine.
The support within the proposed modifications reduces the
current maximum stress in 41% and improved the fatigue life
in 4.99e5 cycles.
INTRODUCTION
In a diesel engine development process, the focuses are
performance, economy and ecological responsibility. In the
current economic condition and country growth, the
commercial vehicles manufacturers seek to meet the high
demand with dynamism and applicability for different power
requirements in the same engine, changing some components
such as turbine, air tubes, and air cooling system, among
others. However, with increasing engine power, the loads on
the support are amplified. This contributes to shortening the
Figure 1 – Charging Air Tube Support.
Figure 2 – Charging Air Tube Support Position in the engine.
The material used to manufacture the support should follow
the DIN EN 10149-3 1.0971 [1] (S260NC) standard chemical
composition, which was confirmed by testing.
The Table 1 shows the chemical composition obtained. The
material mechanical properties are shown in Table 2. E is the
elasticity modulus, ν is the Poisson Ratio, ρ is the density,
σRup is the rupture limit, σYield is the yield limit and σFat is the
fatigue limit.
Table 1 –Material chemical composition.
C
%
Mn
%
Si
%
P
%
S
%
Al
%
Nb
%
V
%
Ti
%
0,16
1,20
0,50
0,025
0,020
0,015
0,09
0,10
0,15
METHODOLOGY
The charging air tube support was modeled with solid
elements (HEXA). The exhaust tube was modeled with shell
elements (QUAD4).The bolts were modeled with bar elements
(BAR). The other components were modeled with solid
elements (TETRA4). The alternator pulleys were modeled
with mass element (CONM2). The static analyses considered
the motor and transmission rubber mounting, which were
modeled with spring elements (CBUSH). Contact between the
charging air tube support, spacer washers and charging air
tube were considered.
Figure 4 shows the model assembly boundary conditions for
modal and static analyses and Figure 5 shows the model
assembly boundary conditions for the dynamic analysis.
Table 2 – Material standard mechanical properties.
E
[N/mm2]
ν
ρ
[ton/mm³]
σRup
[N/mm2]
σYield
[N/mm2]
σFat
[N/mm2]
210000
0.30
7.85x10⁻⁹
340
240
127
The material fatigue limit was calculated considering the
Marin`s endurance limit equation coefficients [2].
σFat = ka.kb.kc.kd.ke.kf.(σYield//*.5)
Marin’s endurance limit equation for steel materials.
Where:
ka = surface condition modification factor;
kb = size modification factor;
kc = load modification factor;
kd = temperature modification factor;
ke = reliability factor;
kf = miscellaneous-effects modification factor;
σFat = Fatigue limit at the critical location of a machine part in
the geometry and condition of use;
The laboratory tests showed that the Rockwell B hardness is
78 HRB, which is according to the expected material hardness.
The metallographic analysis presented ferritic microstructure
with pearlite scattered islands as presented in Figure 3 [3].This
microstructure is typical of hypo-eutectoid carbon steels [4].
The low carbon percentage evidences the material ferritic
structure, which explains the low hardness.
Figure 4 – Modal and static analyses boundary conditions.
Clamp: Restrictions in directions 1, 2, 3, 4, 5 and 6
for the modal analysis.
Clamp: Restrictions in directions 1, 2, 3, 4, 5 and 6
for pressure at the tube socket and thermoelastic analyses.
Engine and Transmission rubber mountings for static
analysis.
Figure 5 – Dynamic analysis boundary conditions.
Large Mass, where Acceleration x Time loads, in the
X, Y and Z directions were applied.
SOFTWARE TOOLS
For the charging air tube support evaluation, the following
software tools were used:
Figure 3: ZE260 Material micrography
•
Medina Pre-processor - version 8.2, for finite element
modeling;
•
MD.NASTRAN Solver - version 2010.1.0, for the
modal and static calculations;
•
PERMAS Solver - version 13.00.216, for the
dynamic calculations;
•
Medina Pos-processor - version 8.2, for results
analysis.
LOADS & CRITERIA
For the modal analysis the frequency range used was 0 to 300
[Hz].
For the static analysis the pressure at the tube socket used was
2.1 [bar] which was measured in the vehicle engine. For the
thermoelastic analysis, a components temperature variation list
was obtained experimentally. Table 3 and Figure 6 shows the
temperature gradient imposed.
For the dynamic analysis, Acceleration x Time loads, in the X,
Y and Z directions were applied. The loads were measured at
the critical frequency range of 1541-1547 [rpm]. Figure 7
shows engine dynamic load graph.
Figure 7: Dynamic load graphs.
CRITERIA
Figure 6 – Thermoelastic static loads.
Table 3: Thermoelastic static loads.
Region
Exhaust Brake
Initial
Temp.[ºC]
26.5
Region
Exhaust Collector Tube
26.5
459.3
Region
Turbine Housing (hot)
26.5
232.1
Region
Turbine Housing (cold)
26.5
174.0
Region
Charging Air Tube
26.5
124.6
Region
Cylinder Head
26.5
120.5
Region
Charging Air Tube
26.5
124.6
Charging Air Tube Support
26.5
100.0
26.5
97.3
26.5
93.9
Regions
Region
Part
Region
Crankcase
Region
Water Tube
Final
Temp. [ºC]
470.9
In modal analysis, the first assembly natural frequency should
be equal to or greater than 182.00 [Hz], which is the 4 ½ order
frequency of the 6 cylinder engine, for a maximum of 2200
[rpm] with a 10% safety factor, according to Campbell
Diagram [5].
In the pressure at the tube socket and thermoelastic static
analyses and in the dynamic analysis, the stresses in the
support must not exceed the material fatigue limit [6].
RESULTS
The engine assembly presented their first natural frequencies
at 157.21 [Hz]. Figure 8 shows the modal analysis results.
1st Mode f1 = 157.21 [Hz]
Maximum displacement versor
x = -0.62; y = 0.49; z = 0,61
Maximum
displacement
point
Figure 8 - Modal analysis results.
Displacement
direction
The pressure at the air tube socket and thermoelastic static
analyses and dynamic analysis results are shown in Figure 9,
10 and 11 respectively. Values within a red frame are above
material fatigue limit. Table 4 shows the static and dynamic
analyses summary results.
The von Mises stresses are presented as a percentage of the
materials fatigue limits. The values presented in red are above
the material fatigue limit.
Table 4 - Static and dynamic analyses summary results.
Analyses
Support
σfat = 127 [N/mm²]
Pressure
143%
Thermoeslastic
55%
Dynamic
98%
FRACTOGRAPHY
A failed support fractography was made to further investigate
the failure cause. The aim was examine the origin of cracking
to reveal the cause of crack initiation. As a result of the
fractography, geometry modifications in the parts in contact
with the support were made in order to minimize its effects in
the crack initiation. The failed support presented the crack
initiation in the same maximum von Mises stresses calculated
region, showing that the mathematical model is consistently
modeled.
Figure 12 shows the support failure region. Figure 13 shows
the beach marks and suggests fatigue failure. Figure 14 shows
the ratchet marks which suggests the crack initiation point
according to the identified stress concentration region in the
mathematical model.
68
103
94
98
Figure 12: Support failure region.
143
108
Figure 9: Static analysis results - Pressure at the Tube Socket.
Figure 13 Beachmarks.
31
46
31
55
Figure 14: Ratchetmarks.
Figure 10: Static analysis results – Thermoelastic.
52
74
61
98
Figure 11: Dynamic analysis results.
FATIGUE LIFE STRESS CYCLES
A verification of the fatigue life stress cycles to failure (Nf)
were performed. For the studied support , the number of
cycles were calculated considering maximum von Mises
stresses obtained in the pressure at the Charging air tube
socket and the S260NC material fatigue limits, which is the
current material used in the support (σfat = 127 [N/mm2]). The
S700MC which follows the DIN EN 10149-2 1.8974 [7]
standard, is the proposed material in order to avoid the support
failure, plus a geometry modification in the Water Tube
contact region within the support from sharp to round edges.
The fatigue limit calculated for the S700MC is σfat = 159
[N/mm2].
Table 5 –Proposed material standard mechanical properties.
E
[N/mm2]
ν
ρ
[ton/mm³]
σRup
[N/mm2]
σYield
[N/mm2]
σFat
[N/mm2]
210000
0.30
7.85x10⁻⁹
750
700
159
The Shigley´s equations were used to calculate the fatigue
number of cycles-to-failure (Nf) [8]:
Nf=106*(σmax / σfat)1/b
REFERENCES
1.
2.
3.
4.
5.
6.
Where:
European Standard, DIN EN 10149-3 1.0971, 1995.
Marin, J., Mechanical Behavior of Engineering Materials,
Prentice-Hall, Englewood Cliffs, N.J., 1962, p. 224.
Tork, Controle Tecnológico de Materiais Ltda. , Material
Test Report num.:12015029MCSP, 2012.
William D. Callister, Jr., Materials Science and
Engineering, Seventh Edition, John Wiley & Sons, 2007.
Campbell, W., The Protection of Steam Turbine Disk
Wheels from Axial Vibration, Trans. ASME, Vol. 1924.
Negretti, T., Structural Analysis Report N1004-465: P2
Charging Air Tube and Supports, T-Systems do Brasil,
2011.
European Standard, DIN EN 10149-2 1.8974, 1995.
Shigley’s Mechanical Engineering Design, Eighth
Edition, McGraw−Hill Primis, 2008.
σmax = Maximum von Mises stress calculated in the pressure at
the charging air tube socket analysis;
σFat = Fatigue limit at the critical location of a machine part in
the geometry and condition of use;
b = 1/3 (log (0,9*σRup / σfat).
7.
8.
Table 6 shows the fatigue life stress cycles calculated for the
current and proposed modifications. Von Mises stresses
presented as a percentage of the material fatigue limits.
Thiago Barão Negretti
[email protected]
Table 6: Fatigue life stress cycles to failure calculated.
Helio Kitagawa
[email protected]
Part
Material
Von Mises
Stresses
Fatigue life
Nf [cycles]
S260NC
154 %
3.30 e4
S700MC
113 %
5.32 e5
"L" Support
SUMMARY/CONCLUSIONS
For the modal analysis, the first natural frequency is
157.21[Hz]. Although the engine support is excited below the
6 cylinders engines fourth and a half frequency order, not
meeting the established the criteria, the analyzed support
presented stresses below the fatigue limits in the dynamic
analysis, suggesting that vibration is not the assembly issue.
For the pressure at the tube socket static analysis, the engine
presented stresses above the fatigue limit at the support. For
the thermoelastic analysis, the support presented stresses
below the fatigue limit.
The engine charging air tube support is not according the
established criteria, which confirms the failure in the vehicle
due to pressure issues.
The current and with the proposed modifications supports are
not according the established criteria. The fatigue life stress
cycles to failure (Nf) of the supports were calculated. The
current support Nf shows a low cicle fatigue life, which
confirms the failures in the vehicle. The support within the
proposed modifications reduces the current maximum stress in
41% and improved the fatigue life in 4.99e5 cycles.
CONTACT INFORMATION
T-Systems do Brasil Ltda.
Av. Alfred Jurzykowski, 562
09680-100 São Bernardo do Campo – SP – Brasil
Internet: http://www.t-systems.com.br
Dr. Antonio Augusto Couto
[email protected]
Universidade Presbiteriana Mackenzie
Rua da Consolação, 930
01302-907 - Consolação - São Paulo - SP – Brasil
Internet: http://www.mackenzie.br
Alex Petruk
[email protected]
Carlos Miletovic
[email protected]
Mercedes-Benz do Brasil Ltda.
Av. Alfred Jurzykowski, 562
09680-100 São Bernardo do Campo – SP – Brasil
Internet: http://www.mercedes-benz.com.br
DEFINITIONS/ABBREVIATIONS
MEDINA: Finite Element Pre and Post-processor from
T-Systems.
σFat: Material Fatigue Stress Limit.
σRup: Material Rupture Stress Limit.
σYield: Material Yield Stress Limit.
Nf: Fatigue life stress cycles to failure.
Baixar