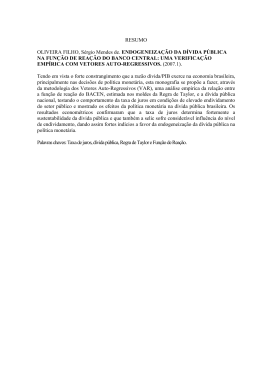
EVOLUÇÃO DOS PRINCIPAIS INDICADORES: 1990 - 1995
DESCRIÇÃO
EVOLUTION OF THE MAIN INDICATORS: 1990 - 1995
1990
1991
Variação Anual Percentual
Exportações
Petróleo
Outras
Importações
-
-11,2
-10,2
-23,8
-14,6
Em Percentagem do PIB
Balança Comercial
Exportações
Importações
Conta Corrente
Conta Financeira e de Capitais
Investimento directo estrangeiro (líq)
Total da dívida externa (stock)
Balança Global
-
-
Rácios sobre Importações e exportações de Bens e Serviços não Factoriais
Rácios das reservas brutas / meses de importações de bens
Rácio das reservas brutas / meses de importações de bens e serviços
Rácio das reservas brutas/semanas de importações de bens serviços
Rácio do serviço da dívida/exportações de bens e serviços
Rácio da dívida/exportações de bens e serviços (excluí perdão e reescalonamento
vincenda)
Rácio da dívida/exportações de bens e serviços (excluí perdão, reescalonamento
vincenda e corrente)
Rácio da dívida m/l prazo (stock)/exportações de bens e serviços
Rácio do total da dívida (stock)/exportações de bens e serviços
Itens do memorando (Em Milhões de US$)
PIB
Exportações de bens e serviços
(Em % do PIB)
Importações de bens e serviços
(Em % do PIB)
Exportações de volume de petróleo (milhões barris)
Preço Médio por Barril
Fonte: BNA/DES
-
1992
1994
1995
DESCRIPTION
11,1
10,3
23,2
47,6
-24,3
-20,9
-71,5
-26,4
4,0
2,7
55,4
-0,6
23,4
21,4
74,8
1,0
Annual Variation in Percentage
Exports
Oil
Other
Imports
23,1
48,0
24,9
-9,2
-4,8
3,6
100,4
-14,2
24,7
49,9
25,1
-11,5
-9,3
5,2
148,5
-25,8
38,5
74,3
35,8
-8,4
-11,6
4,2
227,0
-25,3
44,6
73,6
29,0
-5,8
-5,1
9,3
197,7
-16,7
In Percentage of the GDP
Trade Balance
Exports
Imports
Current Account
Financial and Capital Account
Foreign direct investiment
Total External Debt
Overall Balance
2,9
1,4
6,7
45,7
2,0
0,9
4,4
59,7
1,6
0,8
3,6
48,5
1,5
0,7
3,0
61,1
2,6
41,3
1993
-
-
-
-
-
182,4
-
209,5
-
201,7
-
287,3
-
291,0
-
3.992,4
3.385,0
159,5
22,1
3.620,0
3.185,8
171,0
18,5
7.989,0
3.976,3
49,8
4.031,0
50,5
186,5
18,7
5.819,0
3.006,7
51,7
3.024,3
52,0
170,4
16,1
4.060,0
3.167,3
78,0
3.016,3
74,3
184,3
15,3
In % of Imports and Exports of Goods and Services not Factorial
Gross reserves ratio/months of imports of goods
Gross reserves ratio/months of imports of goods and services
Gross reserves ratio/weeks of imports of goods and services
Debt service ratio/export goods and and services
Debt Service ratio/export of goods and and services (excluiding forgiveness
and rescudilling outstanding Debt)
Debt Service ratio/export of goods and services(excluiding forgiveness and
rescudilling outstanding and current Debt)
260,7 Medium and long Term Debt (stock)/export of goods and services
Total of Debt (stock)/export of goods and services
1,6
0,7
3,2
39,0
5.059,0
3.836,1
75,8
3.519,7
69,6
206,4
16,6
Memoradum Itens (In Million of US$)
GDP
Exports of goods and services
In % of the GDP
Imports of goods and services .
In % of the GDP
Export.Vol. Oil (million barrels)
Average Price per Barrel
Source:BNA/DES
Baixar