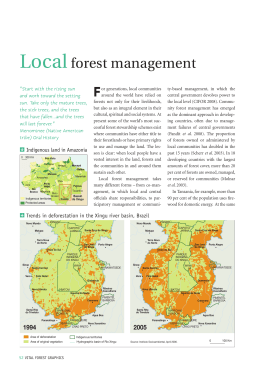
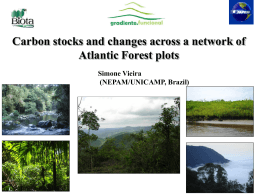
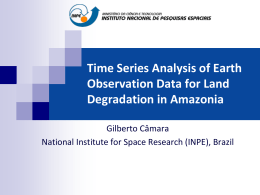
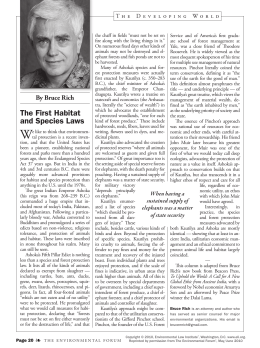
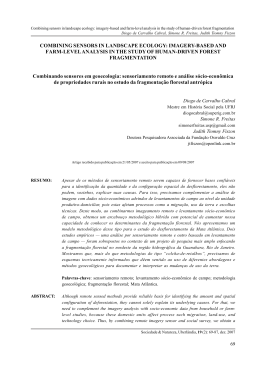
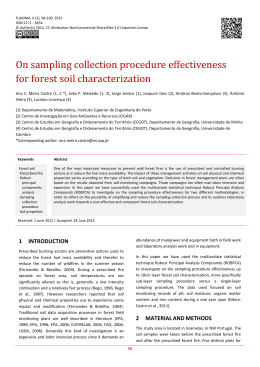
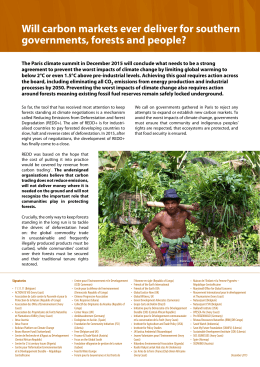
MODELING FIRE BEHAVIOR TO ASSIST FOREST MANAGEMENT IN PORTUGUESE LANDSCAPES Botequim, B1., Borges, J. G. 1, Calvo A. 1 , Marques S. 1, Silva, A.1 1 Centro de Estudos Florestais, Instituto Superior de Agronomia, Technical University of Lisbon, Portugal [email protected] I. Aims Vale do Sousa (Vsousa) Mixed Forest A comprehensive review integrating wildfire modeling processes with specific wildfire simulation exercises provides a unique opportunity to examine how alternative landscape management can potentially change fire spread. Therefore, we simulated fire spread and behavior in different managed Mata Nacional de Leiria (MNL) Pinus Pinaster Globland (Glob) Eucaliptus Globulus landscapes by developing multiple scenarios. The overall objective was to isolate and examine scenarios according to three important fire spread factors: landscape structure, weather, and fire - ignition location (Fig. 2). For that purpose, fire modeling was conducted by FARSITE and FlamMap systems in three Portuguese Forest areas (Fig. 1). Figure 1. Portugal map with the spatial distribution of the three case-studies Fuel Moisture contents II. Material and Methods Climate values Study area We considered three case-studies (Fig. 1): Mata Nacional de Leiria (MNL), a maritime pine (P. pinaster Ait.) public forest in the Centre (extended ≈ 10 881 ha); Vale de Sousa, a diverse forested MNL Glob V.Sousa landscape (Q. suber, Q. robur, Q. faginea, Fagus silvatica, P.pinaster , P. pinea, E. globulus) with multiple non-industrial private forest owners (NIPF) in the North (extending ≈ 12 308 ha). The third case study - Globland‘ area (Glob) - consists of a group of pulp mills‘ properties where eucalypt (E. globulus) is predominant (extend ≈ 11882 ha). This allowed us to make comparisons between different topographic and fuel structure patterns on different landscapes (Fig. 3). A data set Climate Scenarios Reduced Control Critical Reduced Control Critical Reduced Control Critical Wheater Station Monte Real (2002 - 2004) Marianos (2002 - 2004) Barragem C. Burgães (2004 -2005) T (° C) 27.8 30.6 35.9 35.8 37.8 40.1 30.4 32.6 36.4 H (%) 45.4 36.1 24.6 22.5 20.0 17.2 30.9 26.4 20.7 Dead Fuels Live Fuels 1h 10h 100h LiveH LiveW 7 8 11 70 95 5 6 9 70 95 3 4 7 70 95 4 5 8 70 95 3 4 7 70 95 2 3 6 70 95 4 5 8 70 95 3 4 7 70 95 2 3 6 70 95 LiveF 100 100 100 100 100 100 100 100 100 Reduced Surface Fire Climate Scenarios Control FlamMap Critical Reduced: 75th percentiles, i.e. higher values occur in 25% of the day in period June until September; Control : 90th percentiles and Critical: 99th percentiles. The fuel moistures were calculated using the model from Rothermel (1983) . Spread & Fire Behavior Topography FarSite Mata Nacional de Leiria Globland Vale do Sousa Management area 10881.0055 ha 11882.13874 ha 20763.058 ha Forest area 10881.0055 ha 11882.13874 ha 12308.41 ha Resolution Resolution Resolution DTM 25 x 25 m 25 x 25 m 90 x 90 m min max min max min max Elevation (m) 4 142 0 196 37 541 Slope (º) 0 35 0 35.9 0 37.4 More freq More freq More freq Aspect Nw Sw Sw Canopy Characteristics Crown Fire Forest Cover Ignition Point Location Fuel Model wilfires Probability models with explanatory biometric variables available for each specie encompassing 2504 inventories plots, was used to determine the crown structural characteristics Fuel Model required to run crown fire activities and detect significant differences in fire-landscape interactions. Elevation Slope Aspect Fuel Model INPUT FIRE SIMULATORS Description Case Study PPIN-03 P. pinaster plantations without understorey MNL PPIN-04 P. pinaster plantations with understorey MNL PPIN-05 Mature P. pinaster plantations MNL EUC-01 Young E. globulus plantations Glob EUC-02 E. globulus plantations without understorey Glob EUC-03 E. globulus plantations with understorey Glob F-PIN P. pinaster litter MNL M-ESC Broadleaf evergreen (or evergreen Reference Initial Input Fire Simulators Cruz (2005) Evaluation Matrix VSousa Information For Forest Manager hardwood) litter and understorey MNL Landscape data and forest canopy characteristics M-EUC M-H E. globulus litter and understorey Herbaceous understorey M-PIN P. pinaster litter and understorey V-MAa Tall Erica sp., Ulex sp. and Glob, VSousa VSousa MNL , VSousa Fernandes, VSousa et al. (2009) Pterospartum tridentatum shrubland V-MH V-MMa Young shrubs and grassland VSousa Tall Q. coccifera, Cistus ladanifer VSousa GUIDELINES Figure 2. Methodologie applied to modeling fire expected behavior and provided information to assess the effectiveness of methods for integating stande-level fuel treatment schedule and landscape-level management planning. Globland and Cytisus striatus shrubland 4.c) 4.b) 4.a) Figure 4. Forest canopy characteristics: stand height (4.a), crwn base height (4.b) and crown bulk density (4.c) based on the inventory plots and used as crown fuel data in Farsite and FlamMap systems. V. Sousa Intermediate Results Figure 5. Fire –ignition point dispersed by the landscape based on the probability of occurrence of fire. The estimation of canopy parameters were made using specific models developed to Portuguese species (Figure 4). Specifically, (1) we simulated fire spread in Portugal on three landscapes, each with a different structure and fuel model; (2) we examined how weather (wind speed´s of 8km/h, 12km/h and 18km/h) affects fire spread on all three landscapes – we applied also three climate scenarios labeled reduced, control and critical (gathered along the summers of 2002, Figure 3. Landscape files from the three case studie representing the required themes of topographic factor (elevation, slope and aspect) and surface fuel model used to compute fire behavior and simulate surface fire spread. 2003 and 2004) to examine weather influences; (3) and we explored spatial variation among fires ignited in different parts of the landscape. Fire ignition locations are based on the application of risk model using biometric variables from each inventories plot (Garcia et al. submitted) (Figure 5). The fire simulation systems were run to assess the resistance to fire of current landscape mosaics according to different canopy fuel structure and meteorological scenarios. III. Results For demonstrated purposes we considered Vale de sousa landscape: • Fire Perimeter (m) • Heat per area(kj/m2) • Flame lenght (m) • Crown Fire Activity (Index: 0= nome,1= surface fire,2= passive crown fire or 3=active crown fire) • Spread vectors (m/min) FARSITE OUTPUT FIRE SIMULATORS & ArcGIS FARSITE and FlamMap system have produced FLamMap specific elements of each fire. These Maps were evaluated to identify stand characteristics and Database spatial pattern metrics of fire prone areas. Furthermore, fire behavior characteristics in each pixel on the landscape computed with FlamMap were combined with initial landscape FlamMap FlamMap & ArcGIS & ArcGIS information to develop a database with all the possible scenarios combination. • Rate of Spread (m/min) • Fireline intensity (Kw/h) Guidelines to support Forest Management Fire behavior calculations provided information to compare the spatial distribution of forest stands in current landscapes and also to identify hazardous fuel and corresponding stand biometric features to support fire prevention in each study area. IV. Conclusion The Systems simulators have provided capabilities both for consistent representation of fire behavior and for spatial validation of fire prediction in the three study areas. Clearly, the knowledge that results from this study will help forest managers to identify the high-risk areas and to develop management priorities in managing fuels in their landscape. Thus, it will be instrumental for innovative and effective integration of forest and fire management planning activities and will be valuable to address the most important forest catastrophic event in Portugal. Acknownlegment This research was supported by Project PTDC/AGR-CFL/64146/2006 “Decision support tools for integrating fire and forest management planning” funded by the Portuguese Science Foundation (FCT) and The authors would like to thank FCT for funding the PhD of Brigite Botequim (SFRH-BD-44830-2008). References Cruz, M. (2005) Guia fotográfico para identificação de combustíveis florestais - Região centro . Centro de Estudos de Incêndios Florestais – associação para o desenvolvimento da Aerodinâmica Industrial , Coimbra, 39pp. Garcia-Gonzalo, J., Botequim, B., Zubizarreta-Gerendiain A., Ricardo A., Borges J. G.,Marques S., Oliveira M. M. , Tomé, M. and Pereira, J.M.C., Modelling wildfire risk in pure and mixed forest stands in Portugal, (submitted) Fernandes, P., Gonçalves, H., Loureiro, C., Fernandes., M., Costa., T., Cruz., M., Botelho., (2009)Modelos de combustível florestal para Portugal. Congresso Florestal Nacional ,Açores. Rothermel, R.C. (1983). How to predict the spread and intensity of forest and range fires. Genral Tecnhical Report INT-143. USDa Forest service, Intermountain forest and Range Experiment Station, Ogden. 161 pp.
Baixar