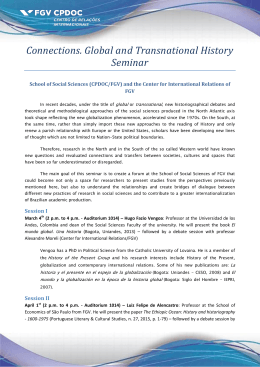
FOR RELEASE: 11:00 A.M. (RIO DE JANEIRO TIME), JUNE 17, 2014 The Conference Board ® THE CONFERENCE BOARD LEADING ECONOMIC INDEX® FOR BRAZIL, TOGETHER WITH FUNDAÇÃO GETULIO VARGAS AND RELATED COMPOSITE ECONOMIC INDEXES FOR MAY 2014 The Conference Board Leading Economic Index® for Brazil, together with Fundação Getulio Vargas (TCB/FGV Brazil LEI), decreased 1.5 percent and The Conference Board Coincident Economic Index® for Brazil, together with Fundação Getulio Vargas (TCB/FGV Brazil CEI), was unchanged in May. The TCB/FGV Brazil LEI fell sharply in May, driven by large declines in the services sector, manufacturing, and consumer surveys. With this month’s decrease, the leading economic index has declined 3.3 percent (about a −6.4 percent annual rate) between November 2013 and May 2014, more sharply than the decrease of 1.6 percent (about a −3.1 percent annual rate) for the previous six months. Moreover, the weaknesses among the leading indicators have remained very widespread, with all components declining in recent months. The TCB/FGV Brazil CEI, a measure of current economic activity, was unchanged in May. The coincident economic index decreased 0.3 percent (about a −0.6 percent annual rate) over the six-month period ending May 2014, a reversal from the increase of 0.9 percent (about a 1.7 percent annual rate) in the previous six months. Meanwhile, Brazil’s real GDP increased by 0.7 percent (annual rate) in the first quarter of 2014, down from 1.8 percent growth in the last quarter of 2013. The TCB/FGV Brazil LEI has been declining for five consecutive months through May. The six-month change in the index has fallen deeper into negative territory with very widespread weaknesses among the leading indicators. Meanwhile, the six-month change in the TCB/FGV Brazil CEI remains slightly negative. The prolonged weaknesses in the LEI, coupled with a stagnant CEI, suggest that the current modest rate of economic expansion is unlikely to accelerate in the second half of the year, and downside risks are increasing. LEADING INDICATORS. Two of the eight components that make up the TCB/FGV Brazil LEI increased in May. The positive contributors — in order from the larger positive contributor to the smaller — were the terms of trade index and the swap rate (inverted). The negative contributors to the index — in order from the largest negative contributor to the smallest — were the services sector survey: expectations index, the manufacturing survey: expectations index, the consumers survey: expectations index, the exports volume index*, stock prices, and the consumer durable goods production index*. The next release is scheduled for Thursday, July 17, 2014 at 11:00 A.M. (Rio de Janeiro time) In New York – Thursday, July 17, 2014 at 10:00 A.M. (ET) -2With the decrease of 1.5 percent in May, the TCB/FGV Brazil LEI now stands at 121.7 (2004=100). Based on revised data, this index declined 0.4 percent in both April and March. During the six-month span through May, the TCB/FGV Brazil LEI decreased 3.3 percent, and none of the eight components advanced (diffusion index, six-month span equals 0 percent). COINCIDENT INDICATORS. Three of the six components that make up the TCB/FGV Brazil CEI increased in May. The positive contributors to the index — in order from the largest positive contributor to the smallest — were occupied employed population*, average real income of workers*, and the volume of sales of the retail market index*. Shipments of corrugated paper declined, while industrial production* and industrial electric energy consumption* were unchanged in May. Holding steady in May, the TCB/FGV Brazil CEI now stands at 128.6 (2004=100). Based on revised data, this index increased 0.1 percent in April and declined 0.5 percent in March. During the six-month span through May, the TCB/FGV Brazil CEI decreased 0.3 percent, and two of the six components advanced (diffusion index, six-month span equals 33.3 percent). FOR TABLES AND CHARTS, SEE BELOW DATA AVAILABILITY AND NOTES. The data series used to compute the TCB/FGV Brazil LEI and the TCB/FGV Brazil CEI reported in this release are those available “as of” 5:00 P.M. (ET) on June 13, 2014. * The series in the TCB/FGV Brazil LEI that is based on our estimates was the consumer durable goods production index. The series in the TCB/FGV Brazil CEI that are based on our estimates were occupied employed population, volume of sales of the retail market, average real income of workers, and industrial electric energy consumption. METHODOLOGY REVISION OF SERIES FROM IBGE In May 2014, the Brazilian Institute of Geography and Statistics (IBGE) announced methodological changes in two data series: industrial production and production of durable goods. The changes date back to January 2002 and consisted of updating sector classifications, revising sector weights, and revising seasonal adjustment factors. These revisions impact one of the eight components used in the TCB/FGV Brazil LEI — Consumer Durable Goods Production Index — and one of the four components used in the TCB/FGV Brazil CEI — Industrial Production Index. These revised series were incorporated in the May 2014 release, including the normal LEI revisions going back six months. However, we will revise the entire history of the LEI to incorporate revisions in the underlying component data during our regular annual benchmark revisions, which take place once a year in January. Please note that the revisions did not impact the overall trend or their turning points of the indexes. For further information: The Conference Board New York: Jonathan Liu: 1-732- 991-1754 / [email protected] Carol Courter: 1-732-672-2817 / [email protected] Indicators Program: [email protected] The Conference Board Brussels: Andrew Tank: 32 2 675 5405 / [email protected] RIO DE JANEIRO: FGV/IBRE Thais Thimoteo: 55 21 3799 6836 | [email protected] Juliana Rocha: 55 21 3799 6913 | [email protected] -3THE CYCLICAL INDICATOR APPROACH. The composite economic indexes are the key elements in an analytic system designed to signal peaks and troughs in the business cycle. The leading and coincident economic indexes are essentially composite averages of several individual leading or coincident indicators. (See page 3 for details.) They are constructed to summarize and reveal common turning point patterns in economic data in a clearer and more convincing manner than any individual component—primarily because they smooth out some of the volatility of individual components. Historically, the cyclical turning points in TCB/FGV Brazil LEI have occurred before those in aggregate economic activity, while the cyclical turning points in TCB/FGV Brazil CEI have occurred at about the same time as those in aggregate economic activity. Further explanations of the cyclical indicator approach and the composite economic index methodology appear in The Conference Board’s Business Cycle Indicators report and website: www.conference-board.org/data/bci.cfm Brazil Composite Economic Indexes: Components and Standardization Factors Leading Economic Index 1. 2. 3. 4. 5. 6. 7. 8. SWAP Rate Manufacturing Survey: Expectations Index Services Sector Survey: Expectations Index Consumers Survey: Expectations Index Stock Prices: BOVESPA Index Terms of Trade Index* Consumer Durable Goods Production Index* Exports Volume Index Factor 0.3301 0.1241 0.0883 0.1155 0.0394 0.1912 0.0564 0.0550 Coincident Economic Index 1. 2. 3. 4. 5. 6. Industrial Production Industrial Electric Energy Consumption Shipment of Corrugated Paper Volume of Sales of the Retail Market Occupied Employed Population Average Real Income of Workers 0.1133 0.0832 0.0782 0.0855 0.5322 0.1076 The component factors are inversely related to the standard deviation of the month-to-month changes in each component. They are used to equalize the volatility of the contribution from each component and are normalized to sum to 1. These factors were revised effective with the release in January 2014. Updates to the leading and coincident indexes normally only incorporate revisions to data over the past six months. The factors above for the leading economic index were calculated using the July 2008 to December 2012 period as the sample period for measuring volatility. Separate sets of factors for the October 2005 to June 2008, October 1999 to September 2005, and February 1996 to September 1999 period, are available upon request. The factors above for coincident economic index were calculated using the February 2003 to December 2012 period as the sample period. Separate sets of factors for the April 2002 to January 2003, March 2002, February 1996 to February 2002 period, are available upon request. These multiple sample periods are the result of different starting dates for the component data. When one or more components are missing, the other factors are adjusted proportionately to ensure that the total continues to sum to 1. For additional information on the standardization factors and the index methodology, visit our Web site: www.conference-board.org/data/bci.cfm The trend adjustment factors for the leading economic index are 0.0930 (calculated over the 2004 – 2012 period) and -0.1055 (calculated over the 1996 – 2003 period). To address the problem of lags in available data, those leading and coincident indicators that are not available at the time of publication are estimated using statistical imputation. An autoregressive model is used to estimate each component. The resulting indexes are constructed using real and estimated data, and will be revised as the data unavailable at the time of publication become available. Such monthly data revisions are now a regular part of the U.S. Business Cycle and Global Indicators program. The main advantage of this procedure is to utilize in the leading economic index the data such as bond yields, stock prices, and change in consumer expectations that are available sooner than other data on real aspects of the economy such as durable goods production. Empirical research by The Conference Board suggests there are real gains in adopting this procedure to make all the indicator series as up-to-date as possible. NOTICES The 2014 schedule for TCB/FGV Brazil LEI updates is: June 2014 Data ... Thursday, July 17, 2014 July 2014 Data ... Monday, August 18, 2014 August 2014 Data ... Wednesday, September 17, 2014 September 2014 Data ... Friday, October 17, 2014 October 2014 Data ... Monday, November 17, 2014 November 2014 Data ... Wednesday, December 17, 2014 All releases are at 11:00 A.M. (Rio de Janeiro time). ABOUT THE CONFERENCE BOARD The Conference Board is a global, independent business membership and research association working in the public interest. Our mission is unique: to provide the world’s leading organizations with the practical knowledge they need to improve their performance and better serve society. The Conference Board is a non-advocacy, not-for-profit entity holding 501 (c) (3) tax-exempt status in the U.S. For additional information about The Conference Board and how it can meet your needs, visit our website at www.conference-board.org. ABOUT FGV/IBRE The Brazilian Institute of Economics (Instituto Brasilieiro de Economia—IBRE) at Fundação Getúlio Vargas (FGV) was founded in 1951 to research, analyze, produce and disseminate macroeconomic statistics and applied studies. Its purpose is to inform and help improve public policies and private activities in the Brazilian economy. IBRE is a leading institute in calculating the Brazilian GDP and producing price indices including the General Price Index (IGP) which served as Brazil´s official inflation index for many years. In addition to price indices, IBRE prepares trend and business cycle indicators that are widely used by administrators and analysts. www.fgv.br/ibre AVAILABLE FROM THE CONFERENCE BOARD: Business Cycle Indicators Internet Subscription (Includes monthly release, data, charts and commentary) $ 680 (for TCB members)/$ 865 (for non-TCB members) per year (1 user) Individual Data Series $65 per series downloaded Monthly BCI Report (PDF) (Sample available at http://www.conference-board.org/publications/publicationdetail.cfm?publicationid=852) $ 275 (for TCB members)/$ 340 (for non-TCB members) per year BCI Handbook (published 2001) PDF only – website download Corporate Site License Contact Indicators Program at [email protected] Business Cycle Indicators for the U.S., the Euro Area, France, Germany, China, India, Japan, Korea, Mexico, Spain, and the U.K., are available at $ 680 (for TCB members)/$ 865 (for non-TCB members) per country per year (1 user). Discounts are available to Associates of The Conference Board/FGV and accredited academic institutions. The Conference Board Leading Economic Index® and The Conference Board Coincident Economic Index® for Brazil, together with Fundação Getulio Vargas Table 1.--Summary of Brazil Composite Economic Indexes 2013 Leading index 2014 Nov. Dec. Jan. Feb. 125.8 126.2 125.3 124.6 Mar. 124.1 r Apr. 123.6 r May. 121.7 p Percent change -0.6 0.3 -0.7 -0.6 -0.4 r -0.4 -1.5 p Diffusion index 25.0 50.0 25.0 25.0 18.8 31.3 25.0 129.0 128.2 129.3 129.1 r 128.5 r Coincident index 128.6 p 128.6 p Percent change -0.1 -0.6 0.9 -0.2 -0.5 r Diffusion index 50.0 33.3 83.3 50.0 16.7 50.0 66.7 May to Jun to Jul to Aug to Sep to Oct to Nov to Nov Dec Jan Feb Mar Apr May Percent change -1.6 -0.9 0.6 -0.6 -1.7 r -2.3 r -3.3 p Diffusion index 25.0 31.3 37.5 25.0 12.5 Percent change 0.9 0.1 Diffusion index 83.3 66.7 0.1 p 0.0 p Leading index 0.0 0.0 Coincident index p Preliminary. 0.8 r 58.3 0.5 r 58.3 0.1 r 50.0 -0.4 p -0.3 p 33.3 33.3 r Revised (noted only for index levels and one-month percent changes). CALCULATION NOTE: The diffusion indexes measure the proportion of the components that are rising. Components that rise more than 0.05 percent are given a value of 1.0, components that change less than 0.05 percent are given a value of 0.5, and components that fall more than 0.05 percent are given a value of 0.0. For more information, visit our Web site at www.conference-board.org/data/bci.cfm Sources: The Conference Board, FGV/IBRE All Rights Reserved © The Conference Board 2014. All data contained in this table are protected by United States and international copyright laws. The data displayed are provided for informational purposes only and may only be accessed, reviewed, and/or used in accordance with, and the permission of, The Conference Board consistent with a subscriber or license agreement and the Terms of Use displayed on our website at www.conferenceboard.org. The data and analysis contained herein may not be used, redistributed, published, or posted by any means without express written permission from The Conference Board. COPYRIGHT TERMS OF USE. All material in this data table, this press release, and on Our Sites are protected by United States and international copyright laws. You must abide by all copyright notices and restrictions contained in Our Sites. You may not reproduce, distribute (in any form including over any local area or other network or service), display, perform, create derivative works of, sell, license, extract for use in a database, or otherwise use any materials (including computer programs and other code) in this data table, this press release, and on Our Sites (collectively, “Site Material”), except that you may download Site Material in the form of one machine readable copy that you will use only for personal, noncommercial purposes, and only if you do not alter Site Material or remove any trademark, copyright or other notice displayed on the Site Material. If you are a subscriber to any of the services offered on Our Sites, you may be permitted to use Site Material, according to the terms of your subscription agreement. TRADEMARKS. “THE CONFERENCE BOARD®”, the TORCH LOGO, "THE CONFERENCE BOARD LEADING ECONOMIC INDEX®", “THE CONFERENCE BOARD COINCIDENT ECONOMIC INDEX®", “THE CONFERENCE BOARD LAGGING ECONOMIC INDEX®", and any other logos, indicia and trademarks featured in this data table, this press release, or on Our Sites are trademarks owned by The Conference Board, Inc. in the United States and other countries (“Our Trademarks”). You may not use Our Trademarks in connection with any product or service that does not belong to us or in any manner that is likely to cause confusion among users about whether The Conference Board is the source, sponsor, or endorser of the product or service, nor in any manner that disparages or discredits us. Violators of these rights will be prosecuted to the full extent of the law. Nothing herein shall restrict the use of the information by news journalists using the information in a legitimate news publication or periodical. The Conference Board Leading Economic Index® and The Conference Board Coincident Economic Index® for Brazil, together with Fundação Getulio Vargas Table 2.--Data and Net Contributions for Components of TCB/FGV Brazil LEI 2013 Component 2014 Nov. Dec. Jan. Feb. Mar. Brazil Leading Economic Index component data Apr. May. SWAP Rate* (360 days, %)…………………………………………………………………………………………………………….. 10.73 10.55 10.97 11.37 11.35 11.33 11.26 Manufacturing Survey: Expectations Index (%, SA)……………………………………………………………………………………………………………………… 98.20 100.00 98.10 97.40 95.80 93.90 89.20 Services Sector Survey: Expectations Index (%, SA)………………………………………………………………………………………………………………………. 133.10 136.60 133.80 132.80 132.30 129.00 120.50 Consumers Survey: Expectations Index (%, SA)………………………………………………………………………………………………………………………… 108.80 108.40 105.60 104.50 104.00 103.60 100.60 47094.00 50414.00 51626.00 51239.00 Stock Prices (Bovespa Index, Mar 1997=100)…………………………………………………………………. 51846.00 51507.00 47638.00 Terms of Trade Index (Index, 2006=100, SA)............................................…..................... 117.59 118.04 r 120.38 r 117.67 r 117.17 r 116.24 r 116.64 Consumer Durable Goods Production Index (Index, 2002=100, SA)…………………………………………………… 103.80 98.80 r 101.50 r 106.10 r 102.60 r 100.90 r 100.54 ** Exports Volume Index (Index, 2006=100, SA)……………………………………………………………………………………….. 110.45 r 107.83 r 105.77 r 106.42 r 102.40 r 107.81 r 106.86 125.3 -0.7 124.6 -0.6 124.1 r -0.4 r 123.6 r -0.4 LEADING INDEX (2004=100)................................... Percent change from preceding month..................................... 125.8 -0.6 r 126.2 0.3 121.7 p -1.5 p Brazil Leading Economic Index net contributions SWAP Rate* (360 days, %)…………………………………………………………………………………………………………….. .... 0.06 -0.14 -0.13 0.01 0.01 0.02 Manufacturing Survey: Expectations Index (%, SA)……………………………………………………………………………………………………………………… .... 0.22 -0.24 -0.09 -0.20 -0.24 -0.58 Services Sector Survey: Expectations Index (%, SA)………………………………………………………………………………………………………………………. .... 0.31 -0.25 -0.09 -0.04 -0.29 -0.75 Consumers Survey: Expectations Index (%, SA)………………………………………………………………………………………………………………………… .... -0.05 -0.32 -0.13 -0.06 -0.05 -0.35 Stock Prices (Bovespa Index, Mar 1997=100)…………………………………………………………………. .... -0.05 0.27 0.09 -0.03 Terms of Trade Index (Index, 2006=100, SA)............................................…..................... .... Consumer Durable Goods Production Index (Index, 2002=100, SA)…………………………………………………… .... -0.03 0.07 r -0.28 -0.31 0.38 r 0.15 Exports Volume Index .... -0.13 r -0.11 r (Index, 2006=100, SA)……………………………………………………………………………………….. p Preliminary. r Revised. -- * Inverted series; a negative change in this component makes a positive contribution. ** Statistical Imputation (See page 2 for more details) interpolation Data Sources: IBRE and Fundação Getulio Vargas (FGV) CALCULATION NOTE--The percent change in the index does not always equal the sum of the net contributions of the individual components (because of rounding effects and base value differences). -0.44 r -0.08 r -0.15 r 0.07 0.25 r -0.19 r -0.09 r -0.02 0.03 r -0.21 r 0.28 r -0.05 ** © The Conference Board 2014. All data contained in this table are protected by United States and international copyright laws. The data displayed are provided for informational purposes only and may only be accessed, reviewed, and/or used in accordance with, and the permission of, The Conference Board consistent with a subscriber or license agreement and the Terms of Use displayed on our website at www.conferenceboard.org. The data and analysis contained herein may not be used, redistributed, published, or posted by any means without express written permission from The Conference Board. COPYRIGHT TERMS OF USE. All material in this data table, this press release, and on Our Sites are protected by United States and international copyright laws. You must abide by all copyright notices and restrictions contained in Our Sites. You may not reproduce, distribute (in any form including over any local area or other network or service), display, perform, create derivative works of, sell, license, extract for use in a database, or otherwise use any materials (including computer programs and other code) in this data table, this press release, and on Our Sites (collectively, “Site Material”), except that you may download Site Material in the form of one machine readable copy that you will use only for personal, noncommercial purposes, and only if you do not alter Site Material or remove any trademark, copyright or other notice displayed on the Site Material. If you are a subscriber to any of the services offered on Our Sites, you may be permitted to use Site Material, according to the terms of your subscription agreement. TRADEMARKS. “THE CONFERENCE BOARD®”, the TORCH LOGO, "THE CONFERENCE BOARD LEADING ECONOMIC INDEX®", “THE CONFERENCE BOARD COINCIDENT ECONOMIC INDEX®", “THE CONFERENCE BOARD LAGGING ECONOMIC INDEX®", and any other logos, indicia and trademarks featured in this data table, this press release, or on Our Sites are trademarks owned by The Conference Board, Inc. in the United States and other countries (“Our Trademarks”). You may not use Our Trademarks in connection with any product or service that does not belong to us or in any manner that is likely to cause confusion among users about whether The Conference Board is the source, sponsor, or endorser of the product or service, nor in any manner that disparages or discredits us. Violators of these rights will be prosecuted to the full extent of the law. Nothing herein shall restrict the use of the information by news journalists using the information in a legitimate news publication or periodical. The Conference Board Leading Economic Index® and The Conference Board Coincident Economic Index® for Brazil, together with Fundação Getulio Vargas Table 3.--Data and Net Contributions for Components of TCB/FGV Brazil CEI 2013 Component Nov. 2014 Dec. Jan. Feb. Mar. Apr. May. Brazil Coincident Economic Index component data Industrial Production (Index, 2002=100, SA)…………………………………………………………………………………………. 102.3 r 98.7 r 101.0 r 101.2 r 100.7 r 100.4 r 100.4 ** Industrial Electric Energy Consumption (GWh, SA)………………………………………………………………………………………………………………… 15558.8 r 15480.9 r 15343.1 r 15363.2 r 15284.8 r 15285.1 ** 15282.1 ** Shipments of Corrugated Paper (Tonnes, SA)……………………………………………………………………………………………………………… 288891.7 r 281278.5 r 287929.3 r 292161.2 r 281265.9 r Volume of Sales of the Retail Market (Index, 2011=100, SA)………………………………………………………………………………………….. 114.1 r 112.5 115.3 r 112.8 r 111.7 r 112.4 r 112.7 ** 23175.5 r 23136.3 r 23123.5 r 23133.6 r 23155.5 ** 1851.7 r 1857.6 r 1855.3 r 1867.1 r 1866.2 ** 1870.6 ** 128.2 -0.6 129.3 r 0.9 r 129.1 r -0.2 128.5 r -0.5 r 128.6 p 0.1 p 128.6 p 0.0 p Occupied Employed Population (Thousands of people, SA)…………………………………………………………………………. 23048.1 r 23098.8 r Average Real Income of Workers (Thousand R$, deflated by CPI, SA)……………………………………………………… 1844.5 r COINCIDENT INDEX (2004=100).............................. Percent change from preceding month................................. 129.0 -0.1 281398.7 r 278522.0 Brazil Coincident Economic Index net contributions Industrial Production (Index, 2002=100, SA)…………………………………………………………………………………………. .... -0.41 r 0.26 r 0.02 r -0.06 -0.03 r 0.00 ** Industrial Electric Energy Consumption (GWh, SA)………………………………………………………………………………………………………………… .... -0.04 r -0.07 r 0.01 r -0.04 r 0.00 ** 0.00 ** Shipments of Corrugated Paper (Tonnes, SA)……………………………………………………………………………………………………………… .... -0.21 r 0.18 0.11 r -0.30 r 0.00 r Volume of Sales of the Retail Market (Index, 2011=100, SA)………………………………………………………………………………………….. .... -0.12 r 0.21 -0.19 r -0.08 r 0.05 r 0.02 ** Occupied Employed Population (Thousands of people, SA)…………………………………………………………………………. .... 0.12 0.18 -0.09 r -0.03 r 0.02 r 0.05 ** Average Real Income of Workers (Thousand R$, deflated by CPI, SA)……………………………………………………… .... 0.03 -0.01 0.07 r 0.00 ** 0.03 ** 0.04 -0.08 p Preliminary. r Revised. -- * Inverted series; a negative change in this component makes a positive contribution. ** Statistical Imputation (See page 2 for more details) interpolation Data Sources: IBRE and Fundação Getulio Vargas (FGV) CALCULATION NOTE--The percent change in the index does not always equal the sum of the net contributions of the individual components (because of rounding effects and base value differences). © The Conference Board 2014. All data contained in this table are protected by United States and international copyright laws. The data displayed are provided for informational purposes only and may only be accessed, reviewed, and/or used in accordance with, and the permission of, The Conference Board consistent with a subscriber or license agreement and the Terms of Use displayed on our website at www.conferenceboard.org. The data and analysis contained herein may not be used, redistributed, published, or posted by any means without express written permission from The Conference Board. COPYRIGHT TERMS OF USE. All material in this data table, this press release, and on Our Sites are protected by United States and international copyright laws. You must abide by all copyright notices and restrictions contained in Our Sites. You may not reproduce, distribute (in any form including over any local area or other network or service), display, perform, create derivative works of, sell, license, extract for use in a database, or otherwise use any materials (including computer programs and other code) in this data table, this press release, and on Our Sites (collectively, “Site Material”), except that you may download Site Material in the form of one machine readable copy that you will use only for personal, noncommercial purposes, and only if you do not alter Site Material or remove any trademark, copyright or other notice displayed on the Site Material. If you are a subscriber to any of the services offered on Our Sites, you may be permitted to use Site Material, according to the terms of your subscription agreement. TRADEMARKS. “THE CONFERENCE BOARD®”, the TORCH LOGO, "THE CONFERENCE BOARD LEADING ECONOMIC INDEX®", “THE CONFERENCE BOARD COINCIDENT ECONOMIC INDEX®", “THE CONFERENCE BOARD LAGGING ECONOMIC INDEX®", and any other logos, indicia and trademarks featured in this data table, this press release, or on Our Sites are trademarks owned by The Conference Board, Inc. in the United States and other countries (“Our Trademarks”). You may not use Our Trademarks in connection with any product or service that does not belong to us or in any manner that is likely to cause confusion among users about whether The Conference Board is the source, sponsor, or endorser of the product or service, nor in any manner that disparages or discredits us. Violators of these rights will be prosecuted to the full extent of the law. Nothing herein shall restrict the use of the information by news journalists using the information in a legitimate news publication or periodical. Brazil Composite Economic Indexes 140 TCB/FGV Brazil LEI 130 Index (2004 = 100) 120 110 100 90 May-14 80 96 98 00 02 04 06 08 10 12 14 130 TCB/FGV Brazil CEI Index (2004 = 100) 120 110 100 90 May-14 80 96 98 00 02 04 06 08 10 12 14 © The Conference Board 2014. All data contained in this table are protected by United States and international copyright laws. The data displayed are provided for informational purposes only and may only be accessed, reviewed, and/or used in accordance with, and the permission of, The Conference Board consistent with a subscriber or license agreement and the Terms of Use displayed on our website at www.conferenceboard.org. The data and analysis contained herein may not be used, redistributed, published, or posted by any means without express written permission from The Conference Board. COPYRIGHT TERMS OF USE. All material in this data table, this press release, and on Our Sites are protected by United States and international copyright laws. You must abide by all copyright notices and restrictions contained in Our Sites. You may not reproduce, distribute (in any form including over any local area or other network or service), display, perform, create derivative works of, sell, license, extract for use in a database, or otherwise use any materials (including computer programs and other code) in this data table, this press release, and on Our Sites (collectively, “Site Material”), except that you may download Site Material in the form of one machine readable copy that you will use only for personal, noncommercial purposes, and only if you do not alter Site Material or remove any trademark, copyright or other notice displayed on the Site Material. If you are a subscriber to any of the services offered on Our Sites, you may be permitted to use Site Material, according to the terms of your subscription agreement. TRADEMARKS. “THE CONFERENCE BOARD®”, the TORCH LOGO, "THE CONFERENCE BOARD LEADING ECONOMIC INDEX®", “THE CONFERENCE BOARD COINCIDENT ECONOMIC INDEX®", “THE CONFERENCE BOARD LAGGING ECONOMIC INDEX®", and any other logos, indicia and trademarks featured in this data table, this press release, or on Our Sites are trademarks owned by The Conference Board, Inc. in the United States and other countries (“Our Trademarks”). You may not use Our Trademarks in connection with any product or service that does not belong to us or in any manner that is likely to cause confusion among users about whether The Conference Board is the source, sponsor, or endorser of the product or service, nor in any manner that disparages or discredits us. Violators of these rights will be prosecuted to the full extent of the law. Nothing herein shall restrict the use of the information by news journalists using the information in a legitimate news publication or periodical.
Baixar