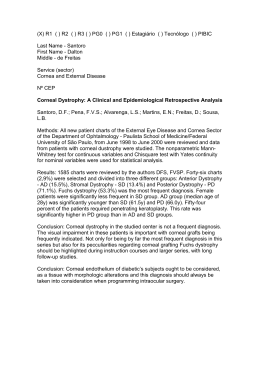
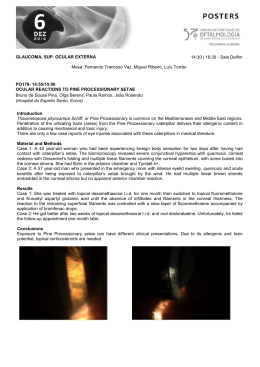
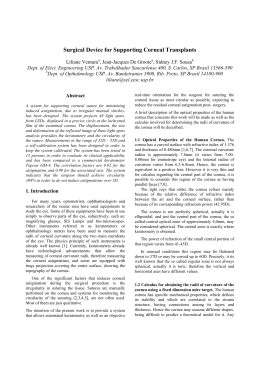
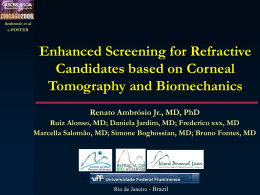
Revista de Fı́sica Aplicada e Instrumentação, vol. 16, no. 1, Março, 2003
7
Computer Algorithm for Simulation of the Human Optical
System and Contribution of the Cornea to the
Optical Imperfections of the Eye
Luis Alberto Carvalho∗
Instituto de Fı́sica de São Carlos-Grupo de Óptica
Av. Dr. Carlos Botelho, 1465, 13560-970, São Carlos – SP
and UNIFESP - Universidade Federal de São Paulo, Escola Paulista de Medicina
[email protected], [email protected]
Recebido em 10 de agosto, 2002. Versão revisada recebida em 5 de dezembro, 2002.
Aceito para publicação em 15 de dezembro de 2002.
The main objective of this work is to demonstrate the relation between corneal surface imperfections and retinal
image imperfections. Its originality resides on the fact that specialized literature approximate the eye and the
cornea as mathematical surfaces to explain simple refraction problems (myopic, hyperopic, astigmatic), whereas
in the present work we have used topographic data for in vivo corneas and other refractive imperfections may be
analyzed. This data was collected in a specialized instrument denominated Corneal Topographer. With this true
corneal data we could understand how more complex imperfections, directly related to more delicate surface
curvature differences, degrade the retinal images. It is well known that the cornea contributes to approximately
2/3 of the total refraction of the eye. Nevertheless, there is very few knowledge of its contribution to the optical
aberrations of the images formed at the retina. Most corneal diagnostic equipments (Corneal Topographers
and Keratometers) measure only its dioptric power (proportional to curvature) and, in certain cases, shape,
but do not calculate or estimate the corneal contribution to the quality of image formation at the retina. On
the other hand, auto-refractors and wave-front sensors measure the optical aberrations of the eye as a single
optical “device”, and therefore do not indicate individual contributions. We have developed algorithms that
read elevation data from a commercial corneal topographer and use this data and ray-tracing algorithms to
estimate the image quality formed at the retina. Conventional optical design test functions such as the Point
Spread Function (PSF) and longitudinal shift in focus position, together with the two-dimensional curvature
maps obtained from corneal topography, are plotted and used to analyze retinal image quality.
O objetivo principal deste trabalho é mostrar a relação entre as imperfeições da córnea e as imperfeições das
imagens formadas na retina. Trata-se de um tema original visto que na literatura especializada são usados
apenas modelos matemáticos aproximados do olho e da córnea para explicar problemas simples de refração
(astigmatismo, miopia e hipermetropia), sendo que no atual trabalho utilizamos dados de córneas in vivo. Estes
dados foram colhidos num instrumento especializado denominado Topógrafo de Córnea. Com isso pudemos
entender como imperfeições mais complexas, relacionadas diretamente a diferenças sutis na curvatura da superfı́cie da córnea, degradam a imagem da retina. Sabe-se que a córnea é responsável por aproximadamente 2/3
da refração total do olho. No entanto, há pouca informação a respeito da influência das aberrações ópticas da
córnea na formação das imagens na retina. A maioria dos equipamentos de diagnóstico da superfı́cie da córnea
(ceratômetro, topógrafo de córnea) mede apenas o poder óptico da mesma (proporcional à curvatura) e, em
alguns casos, a forma tri-dimensional. No entanto, não há estimativa das contribuições da córnea na formação
de imagens no fundo do olho. Por outro lado, auto-refratores e modernos instrumentos chamados “Wave-Front”
medem toda refração do olho como se este fosse um sistema óptico constituı́do por uma única lente, e, portanto
não considera individualmente as contribuições do cristalino e da córnea. Neste trabalho foram desenvolvidos algoritmos que lêem dados topográficos de córneas in vivo mensuradas em um aparelho comercial, depois
fazem um traçado de raios para estimar a imagem formada na retina de um olho padrão. Funções convencionais
para testes ópticos, como a “Point Spread Function” (PSF) e deslocamento longitudinal na posição do foco
(aberração longitudinal), juntamente com mapas bidimensionais de curvatura da córnea (em Dioptrias), obtidos
dos dados da topografia de córnea, são impressos e utilizados para analisar a qualidade das imagens da retina.
∗ The author has no financial interest in the products presented in this work. This work was partially conducted at the Computer Science Department at
the University of California – Berkeley, in 1999, when the author was conducting his Post-Doc.
Luis Alberto Carvalho
8
1 Introduction
The interest for the physiological and optical properties of
the human eye, and how they are related in terms of visual
quality, come from very ancient times [1]. A very thorough study was undertaken by Helmholtz in the 19 th century and was compiled by himself in the famous collection
Helmholtz Treatese in Phisiological Optics [2]. From this
time up to modern days an incredible amount of techniques
and instrumentation for visual quality measurements were
implemented. Today they form a collection of tools that aid
the eye- care professional in providing the best diagnostic
and treatment available to their patients.
With the advent of refractive surgeries for correction
of myopia in the early 80’s, better instrumentation was required in order to analyze the pre and post shape of the entire
corneal surface. The earlier techniques such as manual keratometers [3, 4], which measure only the central 3 mm, were
no longer sufficient. With the advent of more powerful low
cost microcomputers a new line of equipments for corneal
surface analysis started to take place of the conventional keratometers. These instruments, popularly known as Corneal
Topographers, are based on the 19 th century Placido Disc
[5], but surface curvature and calculations are based on sophisticated image processing [6, 7] and computer graphics
techniques for surface reconstruction [8, 9]. They allow
the eye-care professional to analyze a 8-10 mm in diameter
region over the cornea, displaying curvature data for thousands of points.
The first refractive surgery techniques (RK – Radial Keratectomy) were based on the application of radial incisions
to flatten the central cornea. This was an empiric method
and based on data collected from human cadavers and animal eyes. During this same period certain companies and
research laboratories started to investigate an alternative
method for corneal intervention. At the end of the 1980’s
and beginning of the 1990’s some companies made available for tests the first excited dimmer laser for corneal tissue
ablations. These lasers became popularly known as excimer
lasers and the first generations were primarily designed
for myopic correction, and procedures became commonly
known as PRK – Photorefractive Keratectomy. These lasers
rapidly took over the place of conventional RK techniques,
which were very aggressive to the corneal tissue since incisions could go as deep as 90% of the corneal depth. In the
late 1990s and beginning of this century a series of technological advances allowed refractive surgery to be taken to
higher levels of precision and there fore patient satisfaction.
Excimer lasers with flying spot beams and eye tracking systems (to eliminate misalignment of laser treatment caused
by involuntary eye movements) provide sufficient precision
for practically sculpting the cornea to any desired shape [10,
11] and a high resolution auto-refractor inspired in astronomical instruments [12] measures the eye’s wave-front optical aberrations with such a high precision, that refractive
surgery can now be undertaken in a patient-to-patient base,
allowing what became known as customized corneal abla-
tions.
With the advent of these techniques other important
questions arrived. For instance: what is the best correction
for the aberrations of an eye? Does the lens accommodation process influence on this choice? If it does, than should
one determine the best ablation profile based on age factors,
such as presbyopia?
These and other questions still have no answer and in
this work we are attempting to solve the relation between
corneal imperfections and retinal image imperfections. This
is only part of the problem. Further research should attempt to answer questions related directly to the crystalline
lens, such as presbyopia mentioned above. The originality of our present work resides on the fact that we are not
using a purely theoretical eye to understand low order aberrations (myopic, hyperopic, astigmatic). These are already
very well understood. Instead, we are using a simple model
eye with no crystalline, and instead of a mathematical model
surface for the cornea (such as a sphere or a ellipsoid) we
are attaching topographical data from in vivo corneas measured in a sophisticated device called Videokeratograph (or
Corneal Topographer). This allows us to understand how
corneal imperfections degrade images formed at the fovea.
Algorithms based on a hybrid mathematical/biological
model eye and computer graphics visualization and raytracing techniques [13]. As we’ll see, our preliminary
eye model, different from those in literature, has in vivo
corneal topography data for voluntary individuals applied to
a schematic eye globe, based on statistical data. In a previous joint work with the Computer Science Department of
the Universidade de São Paulo (ICMC) [14] a simulation of
Snellen optotypes was implemented also using true corneal
topography from our Corneal Topography equipment [15,
16]. The difference is that in the previous work a sophisticated ray tracing software package was used (VTK – Visualization Toolkit [17, 18]) and the visualization approach
of the retinal images were different from the one presented
in this article. Also, in this work we have worked out the
ray tracing equations one by one and used a different modeling tool (Matlab, www.mathworks.com) to implement the
algorithms and visualization. We believe this technique can
lead to further contributions to the understanding and visualization of the optical imperfections of the eye and planning
process for customized refractive surgeries.
2
Material and Methods
Eye model
There are several schematic models for the human eye,
from very traditional models [2, 3, 4] to modern ones [19].
One of the most popular is that of Gullstrand which is a
simplification of Helmholtz’s eye model [2]. Although this
model is reasonably accurate, there are several other models
in the literature that have, each one, its own advantages depending on the desired application. In our specific case we
do not dispose of lens data of each patient so we decided not
Revista de Fı́sica Aplicada e Instrumentação, vol. 16, no. 1, Março, 2003
to use statistical data for the accommodated lens. Instead
we use a model eye, known as Emsley Schematic Eye, that
substitutes the lens and cornea for a single refractive surface
and an equivalent refractive index for the interior of the eye
(see Figure 1), such that the lens power is taken into account
9
in this index so there is no need to apply it’s shape and specific indexes. The main advantage of this eye is that we may
simply “attach” to it our corneal topography data and apply
the ray tracing all the way to the retina.
Figure 1. Emsley squematic eye and parameters.
The axial distance for this eye is 22.22 mm. The net
dioptric power of the eye is due to the single corneal surface
and has value of 60D for a 5.55 mm radius cornea shown
in the diagram. This is the refracting surface that we’ll be
replacing with our topography data for in vivo eyes. The
refractive index of the entire eye is 1.333.
The corneal topography data was collected from an instrument developed previously in our own laboratory at the
IFSC – USP [15, 16], for which the main principle is shown
in Figure 2. This instrument consists of a conic pattern
with concentric black and white discs (usually referred to
as Placido Discs, after its inventor [5]) painted on its surface that faces the cornea and on its back illuminated by
“donut” shaped fluorescent lamp. The image reflected from
the cornea is amplified by an optical system and focused at
a CCD camera also behind the Placido Disc. The CCD signal is sent to a frame grabber installed on a Pentium III 600
MHz microcomputer, running Microsoft Windows 98 OS.
The programming languages used for software implementation are Borland’s Delphi 4.0-6.0 and Paradox 7.0. The
digitized Placido images are processed using conventional
image processing techniques [6] and the extracted informa-
tion is then inserted in mathematical algorithms for retrieval
of corneal shape and curvature [16, 20]. This data is manipulated in the desired way since we have access to all
the original code, which was implemented previously. For
this specific project we chose to save the corneal data in
ASCII files containing three types of information in cylindrical coordinates (please see Figure 3 for coordinate system
scheme): the corneal dioptric power, proportional to curvature (diop.txt), corneal height or elevation in the positive z
direction (z c.txt), and Placido image disc edge positions in
the radial direction ρ (rho c.txt).
Ray-tracing Scheme
The coordinate system chosen and ray-tracing scheme
may be seen in Figure 3.
Since we have corneal topography data for 360 semimeridians (angle θ) we consider data for each semi-meridian
one at a time. This means that our ray-tracing procedure
happens in a two-dimensional plane, which is a slice of the
cornea containing the optic axis zand the semi-meridian at
angle θ. An initial ray of light with direction defined by
the unit vector V̂i hits the cornea at point (ρ c , θc ). Since we
Luis Alberto Carvalho
10
consider light coming from an object point located at infinity
(>6m) the unit vector is
V̂i = k̂
(1)
and therefore is parallel to the zaxis. Notice that this is not
a paraxial approximation since the incident rays will hit the
cornea a several points close and far from the z axis. This
is actually a very important fact since one of our objectives
is to find out what happens with the image quality at the
retina for peripheral rays. In order to calculate the direction
of the refracted ray we need to now the normal vector to the
surface at point (ρ c , θc ), which may be written as
Figure 2. Optical principle of the corneal topographer.
Figure 3. Ray tracing scheme.
Revista de Fı́sica Aplicada e Instrumentação, vol. 16, no. 1, Março, 2003
n̂ = cos αi (−k̂) + senαi ρ̂
αi = arcsen(ρ/R)
(3)
where Ris the axial radius of curvature of the cornea at point
(ρc , θc ). It is calculated from the dioptric power (D) file
(diop.txt) and equation
(nc − 1)
(4)
R
where Dis the dioptric power (or axial curvature, as some
like to refer to [21]) used in ophthalmic instruments, Ris
the radius of curvature in meters and n c is the equivalent refracted index of the cornea and internal optics of the Emsley
eye (given in Table 1). From the angle of incidence and the
incident vector we may calculate the refracted vector using
Snell’s Law in its vector form
D=
nc V̂i = nair V̂r + γ n̂
(5)
where nair is the refraction index of air (for which we use
the value 1) and
γ = nc cos αr − nair cos αi
(6)
from equations (5) and (6) we may calculate the refracting
vector components
Vrρ
V̂r =
(7)
Vrz
and therefore the parametric equation of line r:
ρ
ρc
Vrρ
=
+t
z
zc
Vrz
(8)
Now that we have the parametric equation of the refracted ray we may calculated the two parameters of interest,
i. e., the focal distance (z f ) along the zaxis and the point of
intersection with the retinal plane (ρ r , θr ). In order to do
this we find the parameter t when ρ = 0. From (8) we have
tf =
ρc
Viρ
(9)
and then substitute this value in
zf = zc + Viz tf
and the retinal point parameter is
tr =
(2)
where ρ̂is the unit vector in the radial direction and angle α i
is the incident angle formed between the incident vector V̂i
and the corneal normal n̂. From the slice shown in Figure 3,
αi may be written as
(10)
11
zr − zc
Viz
(11)
and the retinal point coordinates are then given by applying
the value tr in equation and (8).
Using equations (5) – (11) 16 rays were traced for each
of 360 semi-meridians (θ) separated by 1 0 angles, totalizing 5760 rays for each cornea. We also applied techniques
commonly used in optical design softwares (see CODE V
at www.opticalres.com, or ZEEMAX at http://www.focussoftware.com, for example) to visualize the quality of the
images at the retinal plane (PSF – Point Spread Function)
and color maps of the corneal topography (axial curvature)
for comparison. We following present results for the 4
corneas analyzed.
3
Results
4 corneas of the right eyes of 4 healthy voluntaries were examined at the corneal topographer. The keratometry of each
cornea may be seen in Table 1 and the axial curvature map of
each cornea may be seen in Figure 4. Although many other
corneas could be examined, corneas were chosen such that
they represented specific but common pathologies: the first
cornea (A) is considered a “normal” cornea since it has regular curvature along all meridians and represent the desired
type of cornea for a healthy eye; the second (B) and fourth
(D) corneas are with-the-rule astigmatisms, but we chose a
severe astigmatic and a moderate astigmatic in order to evaluate their differences; the third cornea (C), keratoconic, is
more rare in the population, but since it represents one of
the corneal pathologies that most degrade visual acuity, we
decided to analyze an example of a severe case here.
Data files (z c.txt, rho c.txt and diop.txt) for each exam
were inserted in a Matlab (see www.mathworks.com) codification of the algorithm described in equations (5) – (11).
Figures 5-8 show results for each case.
Notice in Figure 6 from the SL graph that the focusing
distance decreases as the pupil dilates, but contrary to the
“normal” cornea (A), curves are totally different for the vertical and horizontal semi-meridians, which is expected since
this eye has greater with the rule astigmatism. The SR is
also in accordance to the expected variation in retinal image size for the four semi-meridians, but this time the four
curves are not so close to each other, as it should be for an
astigmatic cornea. The PSF in the IL graph shows symmetric rings but in elliptic form, i. e., closer to each other in
the vertical meridian and, as expected, the IR graph shows
a small variation in axial curvature from center to periphery
of the cornea, with vertical and horizontal meridians varying
differently.
Luis Alberto Carvalho
12
Eye
Corneal Shape
A
“Normal”, smooth variation in curvatures, low astigmatism.
B
Regular astigmatism with the rule (moderate).
C
Keratoconic, steep region of high curvature surrounded by
lower curvatures.
D
Regular astigmatism with the rule (severe).
Keratometry (steep meridian, flat
meridian and difference)
47.87 D (7.05 mm) @ 77 o
47.60 D (7.09 mm) @ 167 o
0.27 D (-0.04 mm)
49.27 D (6.85 mm) @ 90 o
48.07 D (7.02 mm) @ 180 o
1.20 D (-0.17 mm)
54.50 D (6.19 mm) @ 65 o
54.10 D (6.24 mm) @ 155 o
0.40 D (-0.05 mm)
47.69 D (7.08 mm) @ 88 o
44.36 D (7.61 mm) @ 178 o
3.33 D (-0.53 mm)
Table 1. Keratometric data for the corneas used for ray-tracing.
Figure 4. Axial curvature maps for corneas shown in Table 1. The two-dimensional maps are color-coded in accordance to their respective
carvature scales to the left (in diopters). The lower left values on each map are the same keratometry values shown in Table 1.
The four graphs in Figure 5 illustrate typical information which is useful for the analysis of the optical quality of
the eye. These same graphs will be repeated for the other
corneas (B, C and D) for comparison. The graphs are as fol-
lowing: (superior left - SL) Focal distances along optic axis
Z versus pupil diameter; (superior right - SR) Radial size of
retinal images (ρr ) versus pupil diameter; (inferior left - IL)
PSF for retinal image and (inferior right - IR) axial curvature
Revista de Fı́sica Aplicada e Instrumentação, vol. 16, no. 1, Março, 2003
obtained directly from corneal topography files (diop.txt and
rho c.txt). We may notice from the SL graph that the focusing distance decreases as the pupil dilates, which is in
accordance to the expected spherical aberration commonly
present in the eye. The important fact in this graph is to
notice the small difference in the curves for different semimeridians, which also makes sense since this first cornea
(A) has regular curvature and very low astigmatism. Nevertheless one may easily notice that curves for the vertical
meridians (with the rule, angles 90 0 and 270 0 ) are closer to
each other and slightly lower than curves for the horizontal
meridian (against the rule, angle 0 0 and 180 0 ) which can be
explained by the very low, but present, with the rule astigmatism of cornea (A) – see steeper meridian in map (A) of
Figure 4. The SR is also in accordance to the expected variation in retinal image size for the four semi-meridians, i.
e., a gradual increase in size as the pupil dilates and four
curves very close to each other, as it should be for a “normal” cornea. The PSF in the IL graph follows quite closely
(although in a negative sense) the pattern of corneal surface
curvature, which is quite expected since corneal power is
directly proportional to curvature (or inversely proportional
to radius of curvature) – see equation (4). This is an important feature since it indicates that traditional curvature maps,
which have been in use for quite a while by eye-care professionals, actually gives a good idea of the contribution of the
cornea to image formation. Of course this is just an approximate view of what is happening in practice since we’re not
considering refraction by the lens and eye in vivo eye dimensions. The PSF shows symmetric and concentric rings,
as expected and the IR graph shows a small variation in axial curvature from center to periphery of the cornea, with
semi-meridians varying very closely.
In Figures 6-8 we print the same information as those for
Figure 5 for the other eyes.
Notice in Figure 7 that focus and image size in SL and
SR start close to each other for small pupils, become very
distant apart for intermediate pupils (between 2-6 mm) and
then, as the conic region on the cornea is very localized interiorly, these points rejoin on the periphery. Unfortunately
during most periods of the day our pupils are in between 2-6
mm in diameter and become larger at night. For this specific
eye a better visual quality may happen in very bright light
13
situations during the day and at very low brightness such
as when driving at night. Notice, again, that the PSF in IL
follows very closely the pattern seen in the curvature map
(Figure 4 (C)).
4
Discussion
Important information may be extracted from the graphs of
Figures 5-8. We may observe a significant variation in the
PSF plots for different corneas. In general terms there is a
growing degradation of retinal image quality as the corneal
surface becomes more irregular, which is clearly shown in
the PSF images. Also, for the same corneal surface, the
PSF has local variations in accordance to local smoothness
or abruptness of corneal curvature and shape. Actually, this
is probably a good explanation for the reasonably good refraction correction with sphero-cylindrical lenses even for
cases of irregular astigmatism and keratoconus. This fact
indicates that although the corneal surface might have high
local variations in curvature and elevation, there are regions
of reasonable smoothness that probably contribute for decreasing the distortion of the retinal image [22].
Comparing, for example, two cases that may be considered opposite in our examples, the “normal” and the “keratoconic” corneas, we may notice very distinct behavior. For
the “normal” cornea the focal distance and retinal image size
vary similarly for all semi-meridians. This means that the
retinal image quality deteriorates uniformly for the entire
corneal surface as the pupil dilates. Even if this patient is
myopic or hyperopic, there is a greater chance of a better
correction with any of the current methods available (PRK
or LASIK, contact lenses or spectacles). The opposite happens to the keratoconic patient. It is easy to notice that once
the pupil dilates there is a totally different behavior for different semi-meridians. For small pupils the focal distances
are very close but as the pupil dilates, for certain meridians
the focal point is brought closer to the cornea, but for others they are positioned further away. And for the keratoconic
case this is even worse, as we may notice, compared to astigmatism, given that keratoconic corneas behave as coma like
surfaces, that is, they have no axis of symmetry, making it
hard for the accommodation system to find a region of least
confusion.
Luis Alberto Carvalho
14
Figure 5. Results of ray-tracing for first eye (A).
Figure 6. Results of ray-tracing for second eye (B).
Revista de Fı́sica Aplicada e Instrumentação, vol. 16, no. 1, Março, 2003
Figure 7. Results for Keratoconic cornea (C).
Figure 8. Results for the severe astigmatic cornea (D).
15
16
It is important to notice that the simulations implemented in this work are not actual measurements of the retinal image quality of in vivo patients, but otherwise a close
study of the aberrations caused by corneal irregularities that
are present in common eyes found in healthy populations.
This is so because we used in vivo corneal topography data
in a schematic eye that has dimensions based on mean statistical data of the population. Another important fact is that
we do not consider here the lens and therefore accommodation factors, and also differences in refractive indexes of
the interior components of the eye. An equivalent refractive index is used for the entire eye in the accommodated
state, which we know is not the case for the human in vivo
eye. Nevertheless this model is a reasonable approximation
to the human accommodated eye since 2/3 of our refraction
occurs at the air-corneal interface.
More accurate eye models [19] and even Physical optics
(using waves) [22] should be considered, taking into account
not only the shape of the anterior and posterior lens surface
and thickness, but also the variation of these parameters with
accommodation [23] and with age [24, 25]. Also, by collecting results from a wave-front device and the corneal topographer one may input data in the algorithms presented here
in order to estimate the Zernike coefficients of the optical
aberration contribution of the crystalline lens.
Acknowledgements
This research was partially funded by FAPESP, process number 01/03132-8. We would also like to thank
Eyetec Equipamentos Oftálmicos – São Paulo – BRAZIL
(www.eyetec.com.br) for providing the calibrating eye and
optical setup for measurements and for figure 3 editing.
References
[1] Scheiner C, Sive fundamentum opticum, Innspruk, 1619.
[2] Helmholtz von HH (1909) Handbuch der Physiologishen Optik. In Southall, J.P.C. (Translator), Helmholtz’s treatise on
physiological optics (1962). New York: Dover.
[3] Stone, J., The Validity of Some Existing Methods of Measuring Corneal Contour
Compared with Suggested New Methods, Brit. J. Physiol.
Opt., 1962;19:205-230.
[4] Le Grand, Y., El Hage, S. G., Physiological Optics, Springer
Series in Optical Sciences, Springer-Verlag, 1980;13.
[5] Placido, A., Novo Instrumento de Exploração da Cornea, Periodico d’Oftalmológica Practica, Lisboa, 1880;5:27-30.
[6] Gonzales RC, Woods R. E., Digital Image Processing,
Addison-Wesley,1992.
[7] Carvalho LA, Stefani M, Romão AC, Tonissi S, Castro J, Digital Processing of image reflectd from the Lachrymal Film of
the Anterior Corneal Surface, Revista Brasileira de Engenharia Biomédica, v.17, n. 3, 113-123, set/dez 2001.
Luis Alberto Carvalho
[8] Klyce S.D., Computer-Assisted Corneal Topography, High
Resolution Graphics Presentation and Analyses of Keratoscopy, Invest. Ofthalmol.Vis. Sci.,1984;25:426-435.
[9] Mandell, R. B., York, M. A., A New Calibration System for
Photokeratoscopy, Am. J. Optom., 1969, 46(11):818-825.
[10] Krueger PR, In perspective: Eye tracking and Autonomous
laser radar, J. Refract Surg 1999;2:145-149.
[11] Pettit G. H., Campin J.A., Housand B. J., Liedel K. K. Customized corneal ablation: wavefront guided laser vision
correction, AUTONOMOUS TECHNOLOGY (ORLANDO,
FL) ARVO (The Association for Research in Vision and
Ophthalmology), Annual Meeting, Fort Lauderdale, Florida
(USA), May 9-14,1999.
[12] Thibos LN, The prospects of perfect vision, Journal of Refractive Surgery, Vol. 16, September/October 2000, 540-545.
[13] Maria Cristina Ferreira de Oliveira, Rosane Minghim, Uma
Introdução à Visualização Computacional, XVI JAI - Jornada
de Atualização em Informática, Brası́lia-DF, 2-8 Agosto de
1997, p. 85-127.
[14] Rogério Eduardo da Silva, “Um Simulador para o Sistema
Visual Humano usando Ray Tracing”, master degree Thesis
presented at the ICMC- USP, Brazil, March, 2001.
[15] Carvalho LAV, Tonissi SA, Romão AC, Santos LE, Yasuoka
F, Oliveira AC, Schor P, Chamon W, Castro JC, Desenvolvimento de um Instrumento Computadorizado para Medida do
Poder Refrativo da Córnea (Videoceratógrafo), Arq. Bras.
Oftal., Dezembro/1998;61(6).
[16] L. A. V. de Carvalho, S. J. de Faria e Souza e Jarbas C. Castro,
Desenvolvimento de um sistema para medida da curvatura da
córnea durante o ato cirúrgico, RFAI, 1996,11:119-126.
[17] William J. Schroeder, Kenneth M. Martin, Lisa S. Avila, C
Charles Law, The Visualization Toolkit User’s Guide, Version 4.0 (with CD-ROM)
by, Kitware, Inc., December 2001.
[18] The Visualization ToolKit (VTK) is an open source, freely
available software system for 3D computer graphics, image processing, and visualization. VTK includes a textbook
published by Prentice-Hall (The Visualization Toolkit, An
Object-Oriented Approach To 3D Graphics, 2nd edition”
ISBN 0-13-954694-4 ). More information may be found at:
http://public.kitware.com/VTK/what-is-vtk.php
[19] Doshi JB, Sarver EJ, Applegate RA, Schematic eye models
for simulation of patient visual performance, J Refract Surg
2001 Jul-Aug;17(4):414-9, Erratum in: J Refract Surg 2001
Sep-Oct;17(5):498-9.
[20] Carvalho, L; Tonissi, SA; Castro, JC; Preliminary tests and
construction of a computerized quantitative surgical keratometer, J Cataract Refract Surg 1999; 25: 821-826.
[21] Roberts C, The accuracy of ’power’ maps to display curvature data in corneal topography systems, Invest Ophthalmol
Vis Sci 1994 Aug;35(9):3525-32.
[22] Garcia DD, Van de Pol C, Barsky BA, Klein SA, Wavefront
Coherence Area for Predicting Visual Acuity of Post-PRK
and Post-PARK Refractive Surgery Patients, SPIE conference on Ophthalmic Technologies IX, San Jose, California,
January 1999; Proc. SPIE Vol. 3246, p. 290-298, Ophthalmic
Technologies VIII, Pascal O. Rol; Karen M. Joos; Fabrice
Manns; Eds. ; Publication date: 6/1998.
Revista de Fı́sica Aplicada e Instrumentação, vol. 16, no. 1, Março, 2003
[23] Brown N (1973) The change in shape and internal form of
the lens of the eye on accommodation, Exp. Eye Res., 15,
441-459.
[24] Koretz JF, Handleman GH (1986) Modeling age-related accommodative loss on the human eye. Mathematical Mod-
17
elling, 7, 1003-1014.
[25] Koretz, J.F. and Handelman, G.H. 1988. How the human eye
focuses. Scientific
American 256 (7): 92-99.
Baixar