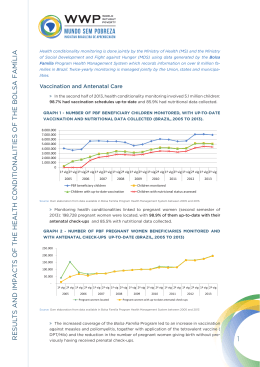
Contributions of the Social Development
Programs in Brazil to Eradicate Hunger,
Reduce Poverty and Other Social
Vulnerabilities
Brazilian Welfare Policy Framework
SOCIAL
PROTECTION
Cash
Transfer
Social Welfare
Full Provision
Social Welfare
Partial Provision
Incentives to participate or
return to the labor market
SOCIAL
DEVELOPMENT
Support to Rural Economic Activities
Brazil
•Population: 180 million
•5 regions
•Area: 8,514,215.3 km²
•26 States and the Federal District
5,564 municipalities
•Poor families: Approximately 11.2
million families (44 million people)
•Extremely poor families:
Approximately 4.5 million families
Source: Ministry of Social Development and Fight Against Hunger
Budget Evolution of MDS - 2004 a 2007
1real ~2dollars
30.000,0
25.000,0
20.000,0
Lei + Créditos
15.000,0
Liquidação
10.000,0
5.000,0
2004
2005
2006
2007
Between 2004 and 2006 budget execution was around 97%
History and Basic Features
Inclusion of social assistance as a basic right in the
1988 constitution (independent of social security
contribution)
Many legislative actions to formalize social assistance (
Organic Law of Social Assistance - 1993)
CCT Initiatives in Campinas and in the Federal District –
1995
ZERO HUNGER – 2003 january
Bolsa Familia – september 2003
Separation of contributive and non-contributive social
protection with the creation of MDS - 2004
Creation of SUAS (Single System of Social Assistance).
BF Objectives
Alleveate poverty
Promoting health
Empowerment of the
families
Direct cash transfer
(short term)
Health attendance as
conditin to stay in
(mid-term)
Education attendance
and continuation(long
term)
Link to complimentary
services
Obtained Results in Social Management:
a) Merger of four income-transfer programs, which had been spread out
among four different ministries, into one, called Bolsa Família (family
fund). This pays up to 95 reais ($48) a month to 11.1m of Brazil's poorest
families (achieved in 2006).
b) The Bolsa Família Program has been recognized by independent studies
as world example of a well focused initiative to alleviate poverty
c) BF has increased attendance and reduced dropout rates
d) Breaks down clientelism and helps to strength the notion of Social Rights
in the field of Social Policy and Social Assistance
e) More efficiency and transparency, using Information systems to aid
social management
f) Improvement of programs and actions by using information
as a result of social research realized by independent
institutions.
Survey with beneficiaries of the Bolsa
Familia Program, december 2004
Bolsa Familia Program image among
beneficiated families
Bolsa Família allows attended families to have
better quality and variety nourishment
Bolsa Família allows attended families
consume a greater amount of food per family
member
Agree
93,1%
92,5%
Over 75% of the families spend more than 75% of the
benefit with food.
Eligibility
Bolsa Familia elegibility
Extreme poverty
Situation of poverty
Amount per
capita
Benefit
Up to U$30.00
Basic = $25.00
+ 7.5 per child
up to three
children
U$30 to U$60
No basic benefit
+ $7.5 up to
three children
Performance of
Policies, Programs
and Actions
Three Pillars mark MDS social actions:
1. Fight against Hunger and Malnutrition
2. Reduction of poverty and inequality
3. Enlargement of the network of Social
Assistance Services (SUAS)
1) Fight Against
Hunger and
Malnutrition
Landmarks of the Policy for Food and Nutritional Security
a) Reactivation and strengthening of CONSEA in 2003
b) Approval of the Organic Act of Social Assistance
(LOSAN), in 2006
Principal MDS programs that aim to guarantee access to food:
a) Bolsa Família Program
b) Food Acquisition Program - PAA
c) Cistern Program
d) Decentralized systems for food security (Restaurantes Populares
Program (low-income restaurants); Community Kitchens; Food
Banks; Community Gardens)
e) Food Baskets
Some Results from the Fight Against Malnutrition
In the Semi-arid region, participation in Bolsa Família
reduced the risk of chronic malnutrition in children under
five by 30%
The largest benefit was seen for children between the
ages of 6 and 11 months, for whom there was a 62%
reduction in the risk of chronic malnutrition.
Source: Inquiry “Chamada Nutricional” – MDS/MS 2006.
Other contributions from Bolsa Família
85.6% of the benefited families consider that the family’s
food either “improved” or “improved greatly” after the start
of the program.
94,2% of the benefited families declare that children under
the age of five eat three or more meals per day.
Source: DataUFF/Ufba/MDS, 2006.
Food Acquisition Program (PAA):
Approximately one billion reals were invested in the
program between 2003 and 2006, benefiting 114
thousand farmers.
In 2006, the food acquired through the PAA was destined
for approximately 7 million people who were in situations
without food or nutritional security.
PAA-Milk
The program buys 700 thousand liters of milk/day
distributing the product to 647 thousand families daily.
Furthermore, the PAA contributes to the development
of Family Agriculture
PAA
•
Elevation in the income and insertion of farmers into local markets.
•
Family farmer beneficiaries possess receipts of commercialization of
agriculture production almost three times greater than non
beneficiaries – a difference associated with sales to the PAA
PAA-Milk
•
Source: USP/FEALQ (2006)
Has provoked growth and stability in the market and elevation in the
levels of employment and income in regions benefited by the
Program.
Source: UFPE (2006)
Cistern Construction in the Semi-Arid
A partnership between the MDS and the Association for the Semi-arid (ASA)
enabled the construction of 200 thousand cisterns, benefiting 800 thousand
people. From 2003 to 2006, the MDS invested 273 million reals in the
program.
26.4% of the benefited families spent more than 2 hours per day transporting
water. This percentage dropped to 3% after the construction of a cistern.
According to declarations made by those interviewed, the percentage of
people who had diarrhea fell from 22% to 0.58%.
Perceptions of the family of the quality of water consumed:
•
•
Before the cistern:
After the Cistern:
Good
Good
22%
96%
Horrible
Horrible
22%
0.69%
Source: Embrapa/MDS, 2006.
Fight Against Poverty
The cash transfer programs have contributed to the
reduction of poverty and inequality in the country
Bolsa Família : Fulfillment of Service goals
2003: 1.2 million families serviced
2006: 11.1 million families serviced
Expansion of services of Continued Cash Benefits
(BPC/LOAS) :
2003: 1.7 million beneficiaries
2006: 2.5 million beneficiaries
Coverage of Bolsa Família (%), Brazil, October-2003
1.2 million beneficiary
families
Source: MDS/SAGI e IPEA, Nota: (1) Coverage = Number of families benefited in Oct/2003,
divided by the estimated number of poor families
Coverage of Bolsa Família (%), Brazil, December -2006
11 million beneficiary
families
Source: MDS/SAGI e IPEA, Nota: (1) Coverage = Number of benefited families in Jul/2006,
divided by the estimated number of poor families
Evolution of applied resources for
PBF e BPC- Brazil, 2003-2006
18,00
Bolsa Família
BPC
16,00
Bilhões de Reais (R$)
14,00
9,72
12,00
7,52
10,00
8,00
5,81
6,00
4,00
2,00
4,53
3,79
5,69
7,52
0,57
0,00
2003
2004
2005
2006
The Fall of Misery in Brazil
37,0
% da população
35,31
34,0
35,16
31,0
28,99
28,0
28,38
28,5
28,79
27,63
28,17
27,18
26,72
25,38
25,0
22,77
2005
2004
2003
2002
2001
2000
1999
1998
1997
1996
1995
1994
1993
1992
22,0
Source: CPS/FGV starting with microdata from PNAD/IBGE.
Defined as the proportion of the population with a per capita income of less than R$121 to today’s prices from São Paulo,
adjusted by regional differences in the cost of living. Obs: 1994 and 2000 are averages of adjacent years. In those years,
PNAD did not conduct surveys.
Evolution of the Gini index
0,610
0,607
0,602
0,600
0,600
0,600
0,599
0,594
0,590
0,580
0,596
0,589
0,583
0,583
0,570
0,572
0,568
0,560
1992
1993
1995
1996
1997
1998
1999
2001
Source: CPS/FGV using micro data from PNAD/IBGE.
2002
2003
2004
2005
Contribution of cash transfer programs in the fall of
income inequality 1995-2004
Cash transfers from social program were
responsible for 28% of the drop in inequality
during the period (as measured by the Gini index)
Bolsa Família – 21%
BPC – 7%
Sources: SOARES,F.V., SOARES,S., MEDEIROS, M. e OSÓRIO, R. 2006 “CASH TRANSFER
PROGRAMMES IN BRAZIL: IMPACTS ON INEQUALITY AND POVERTY” – Working Paper,21
Percentual Médio de Incremento na Renda
Impact of PBF on Beneficiary Performance
August/2006
45,0
40,0
39,8
41,0
36,8
35,0
32,0
30,0
29,6
28,0
25,0
20,0
15,0
10,0
5,0
0,0
BRASIL
Norte
Nordeste
Sudeste
Sul
CentroOeste
Average rise of 36.8% in the income of beneficiary families, resulting in 2.5
million families rising above the line of extreme poverty
Source: Study SAGI/MDS with a base in the data from Unified Registry (SENARC – August, 2006) e Payment
sheets from PBF (CAIXA ECONÔMICA FEDERAL- August, 2006)
Enlargement of the
Provision of Social
Assistance Services
Social Assistanc epasses through profound
changes in Brazil
SUAS organizes, for the first time in the history of the
country, services, programs, and benefits destined for
around 50 million Brazilians, in all age groups.
The new system is the fruit of almost two decades of
debate and places in practice precepts from the 1988
Constitution
The diverse actions and initiatives of service to the needy
population leave the realm of volunteerism and into the
structure of a National public policy.
Number of CRAS
2.500
2.232
2.000
1.500
1.978
1.000
500
0
•
•
•
901
2004
2005
2006
Annual service capacity in these CRAS is of 1.8 million families
R$ 486 were invested in this service
The expansion of one thousand new CRAS for the year 2007 was assigned
Principle advances in the protection of children and
adolescents
• PETI: Integration with Bolsa Família; expansion from 809
thousand, in 2003, to 1,042,064 children in 2006, reaching
3,388 municipalities
• Agente Jovem: Enlargement of service of the program
from 56 thousand, in 2004, to 112 thousand beneficiaries
in 2006
• Confrontation with the Abuse and Sexual Exploitation of
Children and Adolescents: Enlargement of service of the
program from 17.8 thousand, in 2004, to 63.3 thousand
children in 2006
Articulation
and
Partnerships
Donations collected from 2003 to 2007*
Donations to the Fund for the R$ 13,800,000.00
Fight and Eradication of
Poverty
Goods Donated
R$ 30,960,000.00
Infrastructure and Services
of the Head Office of Fome
Zero Relations 0800
Strategic Partnerships
R$ 46,900,000.00
R$ 477,000,000.00
TOTAL
R$ 568,660,000.00
Evaluation
and
Monitoring
Evaluation and Management of Information
2004 to 2006
Investment of R$ 34,538,851.66 in research
(equivalent to 0.14% of evaluated social
program budgets)
35 evaluations of social programs concluded
with the realization of 203 thousand interviews
26 publications with a circulation of 99,580
copies
Evaluation and Management of Information
2004 to 2006
System of Information with a base in varied data
including:
Creation of informational tools (Social Information
Matrix, DICI-Vip. Visualizer of BF and Module of Social
Maps)
Monitoring of 87 indicators of social programs
483 disposable thematic maps
Demands
and
Perspectives
Increase of the values of the benefits
Adjustments and finalization in the Program
design
Amplification of the offer of complimentary
programs
Finalization of the design for integration other
programs
Improvement of shared management of the
program with federal entities, mainly the states
More effective articulation of PBF with policies of youth support
Perfecting of “focalização”, with active searching for the most excluded
Perfecting of methodology for estimating the number of poor families
Enlargement of utilization of the Unique Registry as an instrument for
identification of the beneficiaries for social programs created for poor
families
Ampliação da utilização do Cadastro Único como instrumento para
identificação de beneficiários para programas sociais voltados para
famílias pobres
Qualifaction of municipal and state managers and technicians
Finalization of audit process, of development of systems
Continued improvement in the relation with the Caixa
Implementation of LOSAN and consolidation of
SISAN.
Analysis and evaluation of the impact of SAN
policies, with visits and elaboration of the PPA
2008/2011
Improvement in the mechanisms of inspection
and control of programs under the Secretariat.
Organizational and human resource
improvements for better performance of the
functions of SESAN
Universalization of the CRAS and consolidation of the
articulation of basic protection services with cash
transfer programs; control and accompaniment of
vulnerable families; encourage the offer of projects of
productive inclusion.
Universalization of service to children/adolescents in
labor situations
Reordering and intensification of investments in
services and in the physical restructuring in the
service network
Elaboration, approval, and execution of the Decennial
Plan
Deepen and regulate the aid services
Carry out the management pact with state
governments
Consolidation and build up of the SUAS network
Organization of the special social protection in a
systematic manner
Strengthening of the transfer of the resources “fundto-fund”
Continuity of the process of regulation of services
and benefits
Consolidate the social control of the policy of Social
Assistance
Development of qualification of Social Assistance
actors
Employ a preventative model in the Social
Assistance policy
Other Programs of MDS
•Bolsa Família
•Unique Registry
•Food Acquisition Program – PAA
•Cisterns
•CONSADs (local Development
Concils)
•Popular Restaurants (low-income)
•Food Banks
•Community Kitchens
•Food Basket Distribution
•Urban Agriculture
•Food and Nutrition Education
•Educational Booklets
•Quilombo Community Support
•BPC/LOAS/RMV : Elderly e Disabled
•Integral Family Care Program – PAIF
•Social Assistance Reference Centers
– CRAS
•Social Assistance Specialized
Reference Centers – CREAS
•Continued Services for the service of
children, family, and elderly
• Child Labor Eradication Program PETI
•Youth Agent Program for human
development
Thank you!
Baixar