Gridlet Economics: Modelo e Políticas de Gestão de
Recursos num Sistema para Partilha de Ciclos
Gridlet Economics: Resource Management Models
and Policies for Cycle-Sharing Systems
Pedro Filipe Goldschmidt Oliveira
Dissertação para a obtenção do Grau de Mestre em
Engenharia Informática e de Computadores
Júri
Presidente: Professor Doutor José Carlos Alves Pereira Monteiro
Orientador: Professor Doutor Luís Manuel Antunes Veiga
Co-Orientador: Professor Doutor Paulo Jorge Pires Ferreira
Vogal: Professor Doutor Pedro Miguel Adão
Novembro 2011
Resumo
O cada vez maior poder computacional e preços mais baixos dos computadores domésticos
tornou-os muito populares. Os sistemas P2P de partilha de ciclos de processador permitem aos
utilizadores domésticos combinarem estes computadores numa fonte de recursos que todos podem
utilizar. No entanto, como o acesso aos recursos pode ser feito em simultâneo por múltiplos
utilizadores ao mesmo tempo, é necessário definir quais os recursos que cada um pode utilizar.
Neste trabalho propomos um modelo económico descentralizado para a gestão dos recursos nestes
sistemas. O modelo faz o mapeamento das tarefas para os recursos onde serão executados de
acordo com um conjunto flexível de requisitos, tais como a velocidade de CPU ou memória
disponível, e as preferências ou utilidade do utilizador.
Para utilizar os recursos do sistema, o utilizador faz uma transacção onde troca créditos pelo direito
de utilizar os recursos, créditos esses que só podem ser adquiridos se o utilizador contribuir
previamente para o sistema. Assim o modelo incentiva os utilizadores a contribuir, um aspecto
essencial nos sistemas P2P. Além disso, o preço cobrado varia de acordo com relação entre a oferta
e a procura, valorizando a contribuição em períodos de maior procura.
De modo a reduzir os riscos inerentes a qualquer transacção, o modelo utiliza um sistema de
reputação que identifica e isola os utilizadores incumpridores, impedindo-os assim de prejudicar o
sistema. Utilizando o sistema de reputação o modelo também é capaz de oferecer diferentes
qualidades de serviço dependendo da classe do utilizador.
Palavras-chave: partilha de ciclos de processador, P2P, gestão de recursos, modelo económico.
i
ii
Abstract
The increasingly larger computation power and cheaper prices of the commodity computers made
them very popular. The cycle-sharing peer-to-peer systems allow home users to combine these
computers into a pool of computational resources that they can all use. However, since the access to
the resources can be made simultaneously by many users, there is the need to define which
resources each one will use.
In this work we propose a decentralized economic model for the management of resources in those
systems. The model matches the jobs to the resources where they will be executed according to a
flexible set of requirements, such as CPU speed or memory size, and to the user preferences or utility.
In order to use the resources of the system, the user makes a transaction where he exchanges credits
for the right to use the resources, those credits can only be received by previously contributing to the
system. Thus the model encourages users to contribute, which is essential in a peer-to-peer system.
Also, the price charged changes according to ratio between the demand and supply, making
contribution in times of greater demand more valuable.
To reduce the risks inherent to any transaction, the model uses a reputation system that identifies and
isolates the misbehaving users, hence preventing them from harming the system. Using the reputation
system the model is also able to provide different quality of service depending on the user class.
Keywords: cycle-sharing system, peer-to-peer, resource management, economic model.
iii
iv
Table of contents
1
2
Introduction ....................................................................................................................................... 1
1.1
Motivation ................................................................................................................................ 1
1.2
Objectives ................................................................................................................................ 2
1.3
Organization ............................................................................................................................ 3
Related work .................................................................................................................................... 5
2.1
2.1.1
Currency .............................................................................................................................. 5
2.1.2
Price definition ..................................................................................................................... 7
2.1.3
Price selection ................................................................................................................... 10
2.2
Reputation functions .......................................................................................................... 12
2.2.2
Reputation storage and calculation ................................................................................... 13
Resource discovery ............................................................................................................... 13
2.3.1
Unstructured ...................................................................................................................... 14
2.3.2
Structured .......................................................................................................................... 15
2.3.3
Hybrid ................................................................................................................................ 16
2.3.4
Complex resource discovery ............................................................................................. 16
Economic Model ............................................................................................................................. 19
3.1
Model overview ...................................................................................................................... 19
3.2
Market Square ....................................................................................................................... 21
3.2.1
Specifications and evaluation ............................................................................................ 22
3.2.2
Selection of the executor ................................................................................................... 23
3.2.3
Occupation......................................................................................................................... 25
3.3
Credit system ......................................................................................................................... 25
3.3.1
Payments ........................................................................................................................... 26
3.3.2
Variable price policy .......................................................................................................... 27
3.3.3
Market analysis .................................................................................................................. 29
3.3.4
Shortage of credits ............................................................................................................ 30
3.4
Reputation system ................................................................................................................. 31
3.4.1
Misbehaving nodes ............................................................................................................ 31
3.4.2
Classes of users ................................................................................................................ 33
3.5
Node dynamics ...................................................................................................................... 34
3.5.1
Entering and leaving .......................................................................................................... 34
3.5.2
Fault tolerance ................................................................................................................... 35
3.5.3
Broker selection ................................................................................................................. 36
3.6
4
Reputation ............................................................................................................................. 11
2.2.1
2.3
3
Economic models .................................................................................................................... 5
Summary ............................................................................................................................... 37
Software Architecture and Implementation .................................................................................... 39
4.1
Consumer .............................................................................................................................. 40
v
5
4.2
Producer ................................................................................................................................ 41
4.3
Brokers .................................................................................................................................. 43
4.4
Routing .................................................................................................................................. 46
4.5
Gateway................................................................................................................................. 47
4.6
Specification .......................................................................................................................... 49
Simulation and Evaluation .............................................................................................................. 51
5.1
Simulation details .................................................................................................................. 51
5.2
Resource management ......................................................................................................... 52
5.2.1
Job Distribution .................................................................................................................. 52
5.2.2
Fault tolerance ................................................................................................................... 53
5.2.3
User utility .......................................................................................................................... 54
5.3
5.3.1
Economic viability .............................................................................................................. 55
5.3.2
Variable price policy .......................................................................................................... 56
5.4
Reputation System ................................................................................................................ 58
5.4.1
Misbehaving nodes ............................................................................................................ 58
5.4.2
User classes ...................................................................................................................... 60
5.5
6
Credit system ......................................................................................................................... 55
Model scalability .................................................................................................................... 61
Conclusion ...................................................................................................................................... 65
References ............................................................................................................................................ 67
vi
List of figures
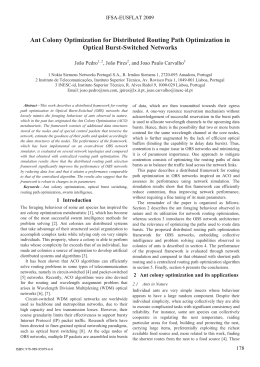
Figure 1 - Steps taken during a transaction .......................................................................................... 20
Figure 2 - Distributed index ................................................................................................................... 21
Figure 3 – Example of the XML representation of the producer characteristics and the consumer utility
using the partial utility algebra ............................................................................................. 23
Figure 4 - Pseudo-code for the search in the index .............................................................................. 24
Figure 5 – Gridlets Economics software architecture ............................................................................ 39
Figure 6 – Diagram of the consumer module implementation .............................................................. 41
Figure 7 - Diagram of the producer module implementation ................................................................. 43
Figure 8 - Diagram of the broker module implementation ..................................................................... 44
Figure 9 - Diagram of the routing module implementation .................................................................... 47
Figure 10 - Diagram of the gateway module implementation................................................................ 48
Figure 11 - Diagram of the specification module implementation ......................................................... 50
Figure 12 – System occupation with different weights for the occupation requirement ....................... 53
Figure 13 – Percentage of successful executions with different levels of churn rate........................... 54
Figure 14 – Average cost and duration of a job (20 Gridlets) execution with different user
requirements ........................................................................................................................ 55
Figure 15 – Average value paid and received for a Gridlet execution for each user type with / without
fee limits............................................................................................................................... 56
Figure 16 – Variation of the fee with the variable price policy depending on the occupation .............. 57
Figure 17 – Number of gridlets executed on average by different types of users................................ 59
Figure 18 – Average duration of a job (20 Gridlets) for each user class .............................................. 60
Figure 19 – System occupation with 1.000.000 nodes ......................................................................... 61
Figure 20 – Percentage of successful executions with 1.000.000 nodes ............................................. 62
Figure 21 – Average cost and duration of a job with 1.000.000 nodes ................................................. 63
vii
viii
List of tables
Table 1 – Example of the credits paid by the consumer for a gridlet execution that cost 500 credits
and which the result was stored in the keeper for 10 hours. ............................................... 27
Table 2 – General characteristics of the simulation environment ......................................................... 51
Table 3 – Characteristics of the unit of cost .......................................................................................... 52
Table 4 – System effectiveness with and without variable price policy ................................................ 58
Table 5 – Number of misbehave cases detected .................................................................................. 59
Table 6 – Average cost and duration of a Job for each user class ...................................................... 60
[1; 2; 3; 4; 5; 6; 7; 8; 9; 10]
[11] [12] [13] [14] [15] [16] [17] [18] [19] [20] [21]
[22] [23] [24] [25] [26] [27] [28] [29] [30] [31] [32]
[33] [34] [35] [36] [37] [38] [39] [40] [41] [42] [43] – não apagar, estão aqui para manter a ordem
ix
x
1 Introduction
The increasingly larger computational power and cheaper prices of commodity computers made them
more and more popular. When connected through a high speed network, these computers have the
potential of providing more computational capability than a supercomputer, and at a lower price. So,
Grids appeared to take advantage of that potential. Institutions with tens or hundreds of computers
brought them together to solve computationally intensive problems. However this type of systems only
uses the computers of institutions, leaving a huge pool of computational resources unused, the home
computers that nowadays are connected to the Internet.
The BOINC system, with projects like SETI@home and Folding@home [3; 33], takes advantage of
those resources by using them to perform the CPU-intensive calculations necessary for scientific
investigation. However, these systems traditionally follow a rigid client-server model, with a centralized
server that is the only one that can create the jobs that are executed. This means that the home users
cannot take advantage of the resources of the system for which they contribute to.
The P2P paradigm is based on the principle that every component of the system has the same
responsibilities, acting simultaneously as a client and as a server. This means that a user that
contributes to the system can also take advantage of it. There has been done considerable research
on peer-to-peer systems and several successful applications were developed. However the main
focus of these systems has been on file-sharing [5] and less attention has been given to the sharing of
other resources, such as idle processor cycles. Some aspects from the peer-to-peer file-sharing
systems, like the resource discovery, are common to the cycle-sharing peer-to-peer system and can
be reused. However, other, such as the resource management, cannot be reused due to the specifics
needs of the cycle-sharing systems. Therefore, in this dissertation we propose a new mechanism for
the management of resources in a peer-to-peer cycle-sharing environment based on an economic
model.
This work is part of a larger project called GINGER [39], an acronym for Grid In a Non-Grid
EnviRonment, a peer-to-peer infrastructure intended to ease the sharing of computer resources
between home users. Also, as part of this work the paper “Gridlet Economics: Resource Management
Models and Policies for Cycle-Sharing Systems" was presented at the International Conference on
Grid and Pervasive Computing (GPC 2011) in Oulu, Finland, and published on the Lecture Notes in
Computer Science (LNCS), Volume 6646/2011, Springer, May 2011.
1.1 Motivation
We felt that there was the need to develop a new resource management mechanism for peer-to-peer
cycle-sharing because the models of resource management used in file-sharing peer-to-peer systems,
Grids or BOINC, the system that are more similar to a P2P cycle-sharing system, cannot be directly
applied to the cycle-sharing scenario.
1
Bit torrent [4], the most popular peer-to-peer content distribution system (represented 35% of
Internet’s traffic in 2005) uses for resource management a tit-for-tat mechanism where a user
exchange uploads for downloads. But this mechanism is based on the fact that a user can contribute
to the system by uploading the chunks that he already possesses while downloading those that he is
missing, thus exploiting the demand to increase the supply. This model is not applicable to cyclesharing, because in this type of systems the moments of contribution and usage are usually far apart
in time. Since during the usage time the users normally are also executing work in their local machine.
Also file-sharing systems only deal with binary requirements, either has the file or not. In cycle-sharing
environments, there is the need to deal with multiple and varied requirements, such as CPU speed,
number of cores or OS installed.
The model of resource management used in BOINC also cannot be employed, because in that type of
systems there is no concurrency in the access to the resources, since the only one that can use them
is the central server. This is a major flaw, since one of the great benefits of the peer-to-peer systems is
that all users can use the resources of the system.
The resource management model that is more similar to resource management in a peer-to-peer
cycle-sharing system, is the one used in the Grids. However, in those systems it is assumed that all
computers are trustworthy, that the components are relatively static and that there is no need to
encourage contributions. Assumptions that cannot be made in a peer-to-peer system and therefore
prevent the usage of the models used in Grids to manage the resources of peer-to-peer system. There
are some systems [37] that use a peer-to-peer approach to the resource discovery in Grids, which is
makes them more suitable for cycle-sharing. However, despite being able to deal with complex
resource discovery, these systems have a very simplified resource management model and that does
not take into consideration the laws of supply and demand.
1.2 Objectives
The objective of this work is to create an economic model capable of dealing with the specifics needs
of the resource management in a peer-to-peer cycle-sharing system. Therefore our work we will focus
on creating a mechanism that is able to automatically map the jobs received to pools of
heterogeneous resources while taking into account multiple requirements (such as CPU speed,
network bandwidth, etc.).
In our model the jobs are received in form of gridlets, small independent work units, and the selection
of where they will be executed takes into consideration the preferences specified by the users that
submitted them. The preferences can specify the priorities given to the characteristics of the resource,
e.g. CPU speed is more important than the memory size, or requirements that must be complied with,
e.g. has to have a Java VM installed. Because this is a cycle-sharing system, the representation of
preferences must be flexible enough to deal with very distinct characteristics.
2
Another objective of the model is to regulate the consumption of the resources of the system and
encourage the contribution with the use of a virtual currency. The currency is exchanged for the
possibility to use the resources of the system, which will belong to another user. This mechanism will
have the ability to differentiate between the different types of contribution, e.g. contributions of more
powerful resources or in times of greater demand are more valuable than contribution of less powerful
resources or in times of lesser demand. Thus, encouraging the contribution of better resources and in
times of greater demand, which is when they are more needed. Consequently, it will also be able to
differentiate different types of consumption.
The last objective of our work is to provide the model with the methods to deal with two types of risks
inherent to economic transactions that can also appear in a peer-to-peer cycle-sharing system. The
first one is overpricing, that happens when someone asks for more money then what he should
receive by claiming that he did more work than what was actually done, this can also appear in cyclesharing systems because it is hard to know exactly how much processing time a task is going to take
to be executed beforehand. The other problem is fraud, which happens when a user instead of
executing a job and returning the result, it does not execute the job and simply sends an answer that
simulates the result in order to get paid. The model should be able to identify the nodes that commit
these actions and isolate them, in order to prevent them from harming the system.
1.3 Organization
The rest of this document is organized in the following chapters:
Chapter 2 (Related Work) - In this chapter we present the three main aspects that influenced our
model: the economic models that exist in the real world and their main characteristics; the reputation
and how it is already used in other systems in the internet; and the peer-to-peer resource discovery
systems presented by other works.
Chapter 3 (Economic Model) – here we present the model proposed in this work. The model
description is divided into 4 parts: the model overview, which describes the main aspects and
functionality of the model; the credit system, which presents the mechanism used to regulate the use
of the resources of the system; the reputation system, where are described the methods used to resist
misbehaving users and provide different types of service; and the node dynamics, which explains the
fault tolerance mechanism and how the nodes can enter and leave the system.
Chapter 4 (Software Architecture and Implementation) – this chapter describes the module
architecture of the Gridlets Economics prototype software implementation. It describes the modules
and sub-modules into which the model is divided and the functionality that each one implements.
Chapter 5 (Simulation and Evaluation) – In this chapter we tested and analyzed the ability of the
proposed model to manage the resources of a peer-to-peer cycle-sharing system. We also evaluate
3
the behaviour of the credit system and how it provides incentives to contribution. The last aspects
presented are the tests made to the effectiveness of the reputation system and the model scalability.
4
2 Related work
2.1 Economic models
When there is demand and supply of resources there has to be some management of who uses what
and when. Economic models are a good way of doing that since in its basis they are supposed to do
that in real life scenarios. Also, they have already been used for many centuries and proved to be a
successful and sustainable way of regulating the exchange of resources, goods and services.
The use of an economic model provides a scalable option for the management of resources,
especially when they are not all in the possession of the same entity, because each user regulates the
use of its own resources. This means that there is no need for a central coordination, which would
create a bottleneck, and speeds up the decision process, because the problem is distributed across all
resource owners. Also, it offers incentives for resource owners to contribute their resources for others
to use, since they profit from it, contributing to the growth of the system. Moreover, it provides a simple
method for defining the priority order of the jobs, by establishing that the ones for which the users are
willing to pay more have the highest priority. Likewise, it encourages the users that have jobs with a
lower priority to back off and let the more time critical ones be executed first, since that means they
will pay less.
Other advantage of the use of an economic model is flexibility since it allows a uniform treatment of all
kinds of resources, from CPU time to application version. Also, both resource owners and consumers
want to maximize their profit, i.e. the owners wish to earn more money and the users wish to solve
their problems with the minimum cost possible. Economic models have the flexibility to allow the users
to express their own requirements and objectives, enabling the development of scheduling policies
that are focuses on the users instead of the system, placing the power on the user’s hands.
Therefore it is considered that an economic model is suitable for the management of resources in a
decentralized environment where resources can vary and are owned by different entities. There
already exist some systems that implement economic models for resource management [8; 9; 18].
However, none addresses the particular aspects of resource management in a peer-to-peer cyclesharing system. Next, we will present three fundamental aspects of economic models: currency, price
definition and price selection.
2.1.1
Currency
When using an economic model there has to be of some type of currency which is exchanged in the
transactions. In a peer-to-peer system there are many options that can be used as currency. The
types of currencies can be divided into two categories: non-monetary and monetary. The nonmonetary systems are simpler and easier to build but, have some limitations. Next, are presented
some non-monetary currencies.
5
Resources: the use of the resources that we have in exchange for what we need in a direct
exchange, as used in [2; 10]. For example, exchange disk space for processor time. The direct
exchange of resources is also called bartering. It is used mainly to start economies because of the
simplicity associated with the fact that it is a non-monetary system. Monetary systems need to give
value to something that by itself does not have any value, the money, independently of what is used
as money, and that fact makes it much more complex. Also, bartering is safer, because it is harder to
deceive someone if the good has to be delivered on the moment of the trade. But it has some
disadvantages: one can only trade if one has possession of the resource at the time of the trade. This
means that if it is a resource that is consumed but never leaves the possession of the owner, it is
impossible to purchase it for later use. It is also difficult to make the conversion of value between
different types of resources. Besides, some resources cannot be traded only half, so the thing that it is
traded for it as to have the same value.
Although traditionally bartering is an operation solely between two actors, there is the possibility of
making a barter transaction with more than two actors [2]. In that type of transactions a ring of direct
exchanges is formed where someone sends a resource to someone that passes a resource of the
same value to other; the other sends to someone else that eventually gives some resource to the
original sender.
Multiple virtual currencies: multiple virtual currencies is an approach where any user can issue a
currency that can be traded, is used in [13; 14]. This type of economy is the next step after bartering.
Instead of trading goods directly there are traded tickets that have the value of the good. This type of
economy solves some of the bartering problems since there is no longer the need to have possession
of the resource at the time of the trade; it allows the possibility of buying a resource to use later. Also,
it is more flexible, because if one has a ticket or coupon that gives him the right to use the resource x,
he can trade it instead of using it. Still, this type of currency has some disadvantages, the ticket it is
only valid for a specific type of resource, so the problem of conversion between different types of
goods remains. Also, the value of the ticket is based on the trust that one have that the entity that
issued the ticket is going to fulfil the right that it grants. So one can only trade the ticket with users that
also have trust in the person that issue the ticket. Besides, this makes it easier to deceive someone,
since it is simpler to trade tickets that do not correspond to real resources, then it is to fake resources.
Monetary systems solve most of the problems that exist in non-monetary systems. The conversion
between different goods is now simple because they are priced based on the value of the money.
Also, they have the advantage of being more practical. But there is still the need to decide what is
going to be used as money:
Real Money: the use of real money has many advantages. The problem of giving value to this type of
currency does not exist, since it is already valuable outside of the system. Another advantage is that
there exist already many payment systems [12] that store the money of the user and make the
transactions. But there are some legal issues [25] and implications that raise many problems. The
security issues are much more important because if someone is able to subvert the system the
6
repercussions are much greater. Moreover, in a peer-to-peer system the paradigm is that there is no
overseeing entity, so it raises the problem of who is responsible for preventing frauds from happening.
Also, the use of real money makes the system vulnerable to users that have a huge wealth, because
puts them in position in which they can monopolize the system.
Virtual money (micro-payments systems): virtual money is a simplification of the use of real money.
This type of money has no value outside of the system, so if someone subverts the system there are
not very big repercussions. That also implies that the security issues of how to store the virtual money
are less important. Moreover, with virtual money users are more likely to allow the usage of that
money to be automated. But it has some problems, since initially this type of currency has no value;
there is the need to make it have value. People only value money because they believe that, later on,
they will be able to trade it for something that they want. So, in order to make the virtual money
valuable, one has to make its users trust that the system will have things that they want in the future
and that they will be able to trade the virtual money for them. Another problem is that all the virtual
money that a user manages to save in that system can only be used in that system. If it was real
money that was being used, it could be cashed-out and inserted into another system. In [23; 40] is
presented some work that has already been done in peer-to-peer systems using this type of currency.
Renewable money: renewable money is a special type of virtual money that self re-charges over
time, depending on the system policy. The type of mechanism is mostly used when a single entity has
control of all of the resources and the users have no way of contributing to the system [14; 20]. It can
also be used as a simplification of the virtual money, because it has fewer problems. In a system that
uses virtual money if there is more offer than demand, the new users will have difficulty in selling their
resources to win credits to use the system; in a self charging system that problem does not exist. To
have flexibility, the users can be divided into classes, based on the resources they have, and use that
to condition the rate at which their money re-charges.
The choice of the currency should be a careful one, because the type of currency used, due to the
implication that it has on the economy, can determine the success or failure of the economic system.
2.1.2
Price definition
The price definition is an important factor of economic models, as it happens with the currency the set
of rules used to define prices has a great influence on the success or the failure of the system. The
alternative selected defines how the resource owners can make their choices and maximize their
objectives. There are many different mechanisms for defining the price in a normal economy. Next we
will present the models for price definition presented in the GRACE framework [8] along with some
critics:
Commodity Market: commodity market is the traditional type of market. In this type of market the
resource owners specify the price and the consumers only have the choice of buying or not. That
happens because, unlike other mechanism such as auction or bargaining, the consumers have no
direct influence on the price definition. The price definition policy can be flat, where the price does not
7
change for a certain amount of time, or variable, where price changes very often based on the amount
of supply and demand. The flat policy is often used in markets where the supply and demand have
very small variation over time. Whereas the variable policy is used when there are large discrepancies
between the low and high peak of demand or the supply varies widely with some regularity. For
example in a cycle-sharing environment probably the supply will increase highly during the night in a
given set of time zones.
This type of market is relatively simple to implement, the most complex part is to define how the prices
are calculated, and it is mostly used when the market is at equilibrium, because it is very stable. But it
has the disadvantage of not achieving an optimal solution, since it does not take into consideration the
value that the consumers give to the resource (i.e. their utility). The systems in [9; 18] consider this
type of market.
Posted Price: posted price is not exactly a type market, but more of a mechanism that is used by the
resource owners to advertise special offers. This mechanism can be used to attract new customers,
which normally would not buy or use that service, in order to establish or increase the market share.
Also, it can be used to encourage users to use the service in a time of less demand, because the
posted prices are cheaper but can have usage conditions associated to them. Although the tactic of
reducing the prices can seem to go against the objective of maximizing the supplier profit, because it
reduces the profit margin, in some cases it might be better to have a smaller profit than having no
profit because nobody is buying or using the service.
Bargaining: bargaining is a mechanism used to set prices that works in the following way: the
resource owner establishes a price and consumer makes a bid with a value that is lower than the price
asked. If the resource owner does not accept the bid, adjust the price in order to make it closer to the
value of the bid. If the consumer does not accept the new price, raises slightly the value offered. They
both continue negotiation until they reach a mutually agreeable price or one of them is not willing to
negotiate any further. Like the posted price this mechanism can be used to increase the market share
or encourage the use of the service in times of less demand. The bargaining method is better for
selling objects or services whose value is difficult to define beforehand. Also, it is better in maximizing
the profit margin of the resource owner, but the negotiation makes it more expensive (particularly in
terms of communication) than the posted price method, so if the value sold is very low it might not
justify the use of bargaining [41].
Tender/Contract-Net: tender/contract-net is one of the most widely used models for price negotiation
of contracts of great value in the real economy. Most of Portuguese government contracts have to be
done by this model in order to ensure transparency. In this model the first step is not done by the
resource owner, but instead is the consumer that publishes the requirements and sends a request for
proposals. Then the interested resource owners answer by stating what they have to offer and how
much it would cost. When all proposals are gathered or the established deadline for receiving
proposals is reached, the consumer evaluates the proposals and awards the contract to the most
appropriate resource owner.
8
This model is the one that best maximizes the consumer utility, i.e. solving the problem with the
minimum cost possible. However, due to the high cost and time consumption required for the
negotiation, its usage is only justified if the value of the contract that is being negotiated is very large.
The system proposed in [9] also considers this type of market.
Auctions: as the tender/contract-net model, auctions support many-to-one negotiations. The
difference is that, instead of being many sellers and one buyer, in auctions there is only one seller and
many buyers.
The three key players involved in an auction are: resource owners, auctioneers (mediators) and
buyers. Many e-commerce portals such as Amazon and eBay serve as mediators and act as a trusted
third party that regulates the auction process. But in a peer-to-peer environment it is considered that
trusted third party does not exist and if the auctioneer is malicious it can subvert the result of the
auction. In [30] is presented a protocol for decentralized ascending auctions where the auctioneers are
groups of peers. This protocol is able to ensure that the auctioneer is not capable subverting the result
of the auction as long as one of the peers in each group is not malicious.
The auction process can have different rules, depending on this rules the auction can be classified into
four types: English auction (first-price open cry), First-price sealed-bid auction, Vickrey auction
(second-price sealed bid) and Dutch auction.
The English auction is the traditional type of auction. It opens with a minimum bid and after, each
buyer successively increases their offer in order to exceed the other bids. When none of the other
bidders is willing to raise the price anymore, the auction ends and the highest offer wins the item at the
price of its last bid. In principle this type of model is the one that optimizes the resource owner
objective, since the iterative raise of the bids forces the buyers to give the real value to the resource.
But in [28] they noticed that the users followed the following strategy: when there was little demand the
buyers instead of bidding the real value of the resource offered a much smaller value, reducing the
seller profit. Other strategy was to bid just before the deadline of the auction, not giving the other
buyers the possibility to make a counter-bid.
In the First-price sealed-bid auction the buyers submit their bids without knowing the other’s bid. That
means that each user only submits one bid, since there is no way of knowing if there is the need to
make counter-bid. The highest bidder wins the item at the price of its bid. In [28] is said that in this
type of auction the strategies used in the English auction cannot be used since the buyers do not
know if the demand is low and there are not counter-bids.
The Vickrey auction is very similar to the First-price sealed bid auction. The only difference is that the
highest bidder wins the item at the price of the second highest bidder. This type of auction is used to
encourage the buyers to offer a value slightly larger than the real value since they will not have to pay
that price but always a smaller amount.
In the Dutch auction the auctioneer starts with a high bid and continuously lowers the price until one of
the bidders takes the item at the current price. It is similar to the First-price sealed bid because in both
the buyers have no relevant information about each other. This type of auction has the advantage that
9
it allows the auctioneer to control the speed of the reduction and therefore the time that the auction
takes.
Auctions are very popular because they require little information about the item real value or demand.
Also, it optimizes the resource owner objective of making the most profit possible. However, this type
of model has the costs associated with the auctioneer and it is time consuming.
Bid-based Proportional Resource Sharing/Share Holders: the bid-based proportional resource
sharing/share holders’ model is mostly used in cooperative concurrency to resources. In this model
the resources allocated to each user can either be a percentage of the total resources proportional to
the bid made in comparisons to the other bids. Or each user can get a share of the system and then
the time that he can use the resources is proportional to his share. One advantage of this type of
model is that ensures that there is not starvation of any user and that all users, independently of their
importance, are given is fair share of access to the resources. However, this model is made to work in
a cooperative environment and in a peer-to-peer system is considered that the users are rational and
work in a competitive way [7].
Collective/Cooperative: a collective/cooperative is a business which is run, and often owned, by a
group of people who take an equal share of any profits. This model is used by smaller business to
meet their economic objectives and be able to compete in an environment where there competitors
are very large, for example the competition in a tender/contract-net. An example of this model is the
small vine farmers which form a cooperative and sell the wine under the same brand to compete with
the big companies.
Monopoly: a monopoly is the case where a single entity is in possession of all of the resources or is
the single provider of a determine type of service and dominates the market. In this model the
resource owner determines the terms on which the consumers shall have access to the resources.
The BOINC system [3; 33] is an example of this type of model.
The model chosen to define the prices influences the ability of the resource owners and consumers to
maximize their objectives. Also it can be a factor to attract new consumers or cause them to leave.
2.1.3
Price selection
In an economic model normally the resource consumer has many options of services from which he
can choose. The alternatives can offer exactly the same service for the same cost, in that case the
selection of the resource owner that is going to provide the service is pretty straightforward. But
usually that is not the case; normally each alternative offers a different type of quality of service, which
can fully or partially satisfy the requirements of the resource consumer, and a different price. In this
case the selection of the right service provider is crucial to achieve the user objective.
In economics, utility is a measure of the relative satisfaction of the consumer with the consumption or
purchase of a determined good. Usually the utility is represented through a function, called the utility
function. That function can take into consideration many different parameters and it is very important
10
to the price selection, because the right selection can be made by choosing the option that maximizes
the value of the function that corresponds to the consumer perceived utility.
However the work that a user submits is normally not executed as single job, but as set of smaller
units. So, the selection of where each job is going to be executed must not only take into consideration
the factors or utility that makes that single choice the best. But also the factor that globally reach the
objectives of the user for that work, as for example the ability to meet a deadline. In [1] it is presented
a broker that selects the service provider based on one of two user policies: budget or time. With the
budget restriction the broker tries to spend as little money as possible. The time restriction has two
modes of functioning: either the user sets a deadline and the broker tries to meet that deadline
spending as little as possible or the broker tries to execute the job as fast as possible without taking
into consideration the costs.
In an economic environment the risk is another important aspect to take into consideration in the price
selection. More important in a peer-to-peer system where there is no regulating authority, which
means that both the resource owners and consumer can try to take advantage of one other without
punishment [21]. So, the reputation (section 2.2) can be used as factor for price selection, since it is a
measure of the risk of the transaction. In economics the riskier an investment is, the bigger the pay-off
as to be in order to justify the possibility of losing money. That means that if the reputation of a peer is
low it cannot ask for a high price, because it will not make up for the risk.
While the price definition is the most important factor to achieve the objective of the resource owner,
since it defines the price and the buyers have little control over it. The price selection is the most
important factor to achieve the objectives of the resource consumer.
2.2 Reputation
Trading in an economic model always involves a certain amount of asymmetric risk (that one of the
parts will not fulfil its obligations once the other has committed the resources or currencies) and the
reputation is important because it is used to reduce that risk. There is the assumption that the
behaviour of someone in the past is a relatively good predictor of their future behaviour. However, in
order to use that assumption it is necessary to have some knowledge of the past behaviour of that
person, which one might not have. The reputation is considered to be the overall opinion of the system
about someone or something and can used as an indicator of the past behaviour.
One way of using the reputation that is used in the real world are the references, which means that
someone already has some knowledge about the past behaviour of a certain person and passes that
information along in the form of a reference. In [43] it is proposed a system that uses this mechanism.
Besides reducing the risk, reputation can also be used as a mechanism to induce good behaviour in
markets with asymmetric information. That concept is not new, in fact several economist have already
published work analyzing its proprieties. One of the major auction sites in the world, eBay [15], relies
almost exclusive on a system like this to reduce the risk and induce good behaviour on the part of its
members.
11
The system works by encouraging the buyers and sellers to rate each other after each transaction. It
is a binary reputation mechanism which means that the rating can be one of two values, “praise” (i.e.
positive) or “complaint” (i.e. negative, problematic), together with a short text. These classifications are
then made publicly available to all users. For a system like this to work it is important that two
properties hold:
1. It is optimal to sellers to settle down to a steady-state pair of real and advertised qualities,
rather than oscillate, successively building up and milking their reputation.
2. The quality of sellers as estimated by buyers before the transaction is equal to their true
quality.
The first property is important because if the seller is allowed and chooses to oscillate, because that
would result in additional profits, that profit would be made at the expenses of the buyers, which in the
presence of competitive markets, would eventually leave. That would lead to the collapse of the
system.
The second property is needed to do expectation management, because the classification given by a
peer to a transaction is not based on the real quality of the item. Instead, it is given based on the
relation between the quality expected and the real quality item. This means that if a buyer receives an
item that is in good condition, but for some reason is expecting it to be even better; he would rate the
transaction as a complaint, regardless of the fact that he/she received an item in good condition.
Over the years the reputation system of eBay has proven itself capable of providing a remarkable
stability. Still it is requires human interaction to give and evaluate the classifications.
2.2.1
Reputation functions
The reputation system collects the classification that the users gave to the transaction. But that
information is only useful if it can be used to compare the reputation of one peer with another. So,
there is the need to convert it into a value that can be quantified and compared. In the next paragraph
there will be a description of the function used to convert the classifications given into a comparable
value.
First we have to choose which factors we are going to consider in the function. In [42] the authors
identify three major factors to consider when evaluating the reputation:
1. The classification that a peer obtains through transactions.
2. The number of interactions the peer had with other peers.
3. A balance factor of trust, which reflects the trust that there is in the classification given by
that peer.
Then the reputation value of a peer u can be calculated by the sum of all the classification given by
other peers to u multiplied by the balance factor of the peer that gives the classification, divided by the
total number of interactions of u.
12
The balance factor makes the given function asymmetric. Asymmetric functions consider that some
peers are not trusted and that trust is transient. That is important because in [11], it is said that
symmetric function are vulnerable to Sybil attacks and badmouthing since they treat every
classification as the same. Also the fact that trust is considered transient makes it easier to develop
trust in peers to which there has been no prior interaction.
2.2.2
Reputation storage and calculation
The calculation of the reputation value of one peer depends on where that information is stored. In
centralized systems, like eBay, the reputation is stored in the server, so it is only logical that it is the
server that calculates the reputation value of each peer. This is a simple and effective solution, also
since the server is a trusted third party there is no risk of adulteration of the value stored.
However in a decentralized peer-to-peer systems there is no central server or any other trusted third
party that can store and calculate the reputation. One option is to store in the neighbours, like in
KARMA [40]. The feedback is stored by the adjacent nodes in the DHT1, this solution is considered
relatively safe because the distribution of nodes over the DHT is random, and so it is very difficult to
know who is going to be one peer’s neighbour in order to have it change the peer’s reputation.
Nevertheless, the nodes storing the reputation are not trustworthy so the values are replicated into the
more than one neighbour, when a peer wants to know someone’s reputation it asks all of the
neighbours, and in case of receiving different values, uses the majority to reach a decision.
In the EigenTrust Algorithm [22] the reputation is stored locally. Then the algorithm computes a global
reputation value for every peer based on the local reputation values assigned to each peer by other
peers. This method of calculating the reputation takes into consideration the entire system’s history of
a peer.
Calculating the global reputation value makes the algorithm more accurate, yet it also makes it more
complicated, requiring long periods of time to compute that value. In [26] the authors propose a
system that instead of considering the entire history uses only limited information about the peer. The
authors show that it is possible still to achieve good results, while reducing the overhead of calculating
the reputation.
2.3 Resource discovery
The basis of an economic model is the possibility of selecting the option that maximizes the utility
of the resource consumer. In order to make the selection there is the need to know what options are
available, for that there is the need to discover the resources available at a certain time. The resource
discovery in peer-to-peer systems is divided into three main categories, depending on how the nodes
are organized: unstructured, structured and hybrid.
1
DHT (Distributed Hash Table) is an infrastructure used in structured peer-to-peer systems to organize the peers.
A more detailed description is made in section 2.3.2.
13
2.3.1
Unstructured
In an unstructured peer-to-peer system the nodes are randomly distributed, these types of systems
are generally more appropriate for accommodating a highly-transient population due to the low cost of
entering and leaving the system. But because there is no information about the organization of the
peers, these systems need to use uninformed search techniques that are very inefficient.
Gnutella [5] was one of the biggest file-sharing peer-to-peer systems, it was decentralized and
unstructured. In this system each peer was connected to a small number of other peers, the
neighbours. The search method was basic flooding, which works by sending the query to all the
neighbours and when the neighbours receive it, they forward the same query to all of their neighbours.
This search mechanism is not scalable because each query generates a huge amount of traffic that
increases exponentially with the number of nodes, so as the number of peer increases the amount of
traffic generated by the queries saturates the system. In result, many queries are dropped making the
search unreliable. Additionally, due to the high disconnection rate of the peers the network never
stabilizes.
In order to prevent the search mechanism blocking the system there are several techniques, such as
the use of a Time-To-Live (TTL). The TTL indicates the number of hops away from its source that a
query should be propagated to. This limits the amount of traffic generated by each query. However it
has some drawbacks, it limits the search to only a part of the system, so the item searched may not be
found although it exists in the system. Also, the value of the TTL must be carefully chosen, if too small
most queries will return incorrect or not optimal results, if too large the amount of traffic generated by
each query continues to be too much. Iterative deepening [24] solves this problem by starting with a
small TTL and increasing it in each attempt.
Another technique is performing random walks [19; 24]. In this technique instead of sending the query
to all of the neighbours, the peer sends the query only to some randomly chosen neighbours. If the
query does not return successfully is then sent to some of the other neighbours; this continues until
the query was sent to all neighbours or returns a positive result. The method reduces in many cases
the traffic overhead imposed on the network with the trade-off of a highly variable performance and, in
contrary to flooding, the number of query replicas does not increase with the hop distance.
Kazaa [5] uses a hierarchic approach with two classes of nodes, super peers and ordinary nodes. The
super peers connect between themselves and form an unstructured overlay network while the ordinary
nodes are each on connected to one of the super peers. Each super peer maintains an index of the
files present in the ordinary node that are connected to it and the searched is made only among the
super peers. This technique allows the use of flooding while maintaining scalability, since the number
of nodes search is much smaller. Also, it has been demonstrated that nodes with low bandwidth and
less computational power were the ones being saturated and slowing down the search process; this
approach take that fact into consideration and therefore it isolates the slower nodes from the search
process.
14
2.3.2
Structured
In a structured peer-to-peer system the peers’ distribution follows a rigid organization over an indexing
service based on hashing, known as Distributed Hash Table (DHT). Peers and keys are mapped
through a hash function which allows the finding of the peer corresponding to a key in a very efficient
manner. The number of messages grows smoothly with the number of peers. In this way they solve
the scalability problem of unstructured systems, but have the disadvantage of being less suitable for
highly transient populations due to their strict organization of the nodes which implies high costs for
entering and leaving the system.
In Chord [36] the keys and nodes are mapped over m-bit key space and the key is assigned to the first
node whose ID is equal or greater than the value of the key. Chord distributes its nodes over a onedimensional ring according to their ID, so in order for it to work a node needs to know his successor.
To locate the node corresponding to a certain key the queries travel through the ring always in the
same direction (clockwise or counter-clockwise) until it reaches the desired node. However this
mechanism requires O (N) messages to locate the node, which is highly inefficient. To speed up the
lookup process, each node maintains a table with m entries. In the first entry of the table the node
stores a pointer to the node that is responsible for the key half-ring away from it, in the second entry to
the node responsible for the key one-quarter away and on the third entry the one one-eighth away and
so on. So before sending the query to its successor, a node checks its finger table and if one of the
entries points to a key that is lower than the one it is searching, it sends the query directly to that node
further away as possible, skipping the nodes between. This emulates a binary search, thus requiring O
(log N) messages to locate a node corresponding to a certain key. In order to maintain its rigid
structure, Chord periodically runs a stabilization protocol, where if one node fail its successor becomes
responsible for its keys. In order for it to work each node needs to maintain a pointer to its
2
predecessor. The update of the systems in case of a node join, leave or fail requires O (log N)
messages.
The CAN (Content Addressable Network) [29] uses a virtual d-dimensional Cartesian coordinate
space to map the keys onto to nodes. The coordinate space is divided into zones, which are segments
of the space, and each node is responsible for a certain zone. The keys consist of d numbers and
correspond to a point in the coordinate space and the node responsible for that zone is the one
responsible for that key. Each peer is connected to its next and previous peer in each dimension. In
order to do the lookup for a certain key the CAN uses a greedy strategy where it sends the message
to the neighbour that is closer to the key until it reaches the desired location. This way, the lookup will
follow a straight line through the Cartesian space from source to destination. The lookup requires
1/d
O (d - N ) messages and a routing table with 2d entries. However, in order for the lookup mechanism
to function it requires a continuous coordinate space without any unassigned zones. So when a node
leaves the system, the zone of one or more neighbours is enlarged in order to contain the zone that
was left unassigned. The creation of a new zone to allow the join of a new node is made by splitting
one the existing ones. Nodes joining or leaving have a localized effect and require only O (d)
messages to update the system.
15
2.3.3
Hybrid
Unstructured systems allow a random distribution of nodes, which have the advantage of being
suitable to highly transient populations, but make the search very inefficient. Structured systems
organize the distribution of the peers in a strict way, which enables a very efficient search, but does
makes joining and leaving of peers very costly. Hybrid systems try to maintain the efficiency of the
search of the structured systems, while employing a less strict organization, thus making them more
suitable for transient populations.
In Pastry [31] each peer has a unique 128-bit node identifier (nodeId) that is used to indicate the node
position in circular space. The nodeId is assigned randomly when a node joins the system, so with
high probability the nodes with adjacent nodeIds are diverse in geography or jurisdiction. However
Pastry takes into account network locality and seeks to minimize the distance messages travel,
according to a scalar proximity metric like the number of IP routing hops. Each node in Pastry
maintains the following state: a routing table, a neighbour set and a leaf set. The routing table has
rows with 2b −1 entries each. The entries at row n of the routing table refer to nodes whose
nodeId shares the present node’s nodeId in the first n digits. This means that each entry has many
possible nodes, the choice of the node is made based on the proximity metric. The neighbour set
contains the M nodes which are closest to the node according to the proximity metric. The leaf set is
the set of nodes with the |L|/2 numerically closest larger nodeIds, and the |L|/2 nodes with numerically
closest smaller nodeIds, relative to the present node’s nodeId. The routing in Pastry is made by first
checking if the key falls into the range of the nodes in the leaf set. If so, the message is sent directly. If
not, then the routing table is used to do the routing in a tree-like manner. The routing process is done
in less than steps and will succeed unless either half of the leaf set nodes fail simultaneously.
The neighbour set is used to aid new nodes join the system. The nodes that are closest to the new
node are likelier to have a similar state, thus providing a good starting to point for the initialization of
the entering peer.
2.3.4
Complex resource discovery
So far the resource discovery described only considered exact match queries of a single value, the
key, that are mostly used in file-sharing systems. But in a cycle-sharing environment the search has to
take into consideration multiple parameters that might have a range of values which are acceptable,
more like in Grid environment. For example, one peer may want to discover the nodes with a
processor speed between 2 and 3GHz and from 1 up to 2 GB of RAM memory.
In [19] Iamnitchi et al. propose a fully decentralized architecture for resource discovery that deals with
requests for a set of desirable attributes rather than a global unique identifier. In this architecture,
participants are called Virtual Organizations (VO) and can be home users or institutions. Each VO
publishes information about one or multiple of its resources on one or more local servers, called nodes
or peers. To discover a resource the user sends a query to a known node. If the query request
matches locally, the node responds with a matching description. Otherwise it forwards the request to
16
another node, the other node does the same until the query matches or the TTL expire. The
forwarding of requests is made based on one of the following strategies: random walk, learning-based,
best-neighbour, learning-based + best-neighbour. In the random walk the request is sent to a
randomly chosen node. In the learning-based the node remembers the past answers and sends the
request to a node that had already answered to similar query, if there is no relevant experience a node
is chosen randomly. In the best-neighbour strategy the node registers how many answers each
neighbour has provided and sends the request to the neighbour with the highest number. The
learning-based + best-neighbour is identical to the learning based, but when no relevant experience
exists the query is forwarded to the best neighbour. Nevertheless, this architecture is based on
unstructured peer-to-peer systems, so it has the same disadvantages.
In [6] Andrzejak et al. propose an extension to CAN that allows ranged queries. In the extended CAN
the “objects” are pairs (attribute values, resource id), where the attribute value is a real number. Only a
subset of nodes participates, called the interval keeper (IK), and is responsible for storing the pairs of
a certain interval. Each server in the Grid reports its current attribute value to an IK with the
appropriate interval. To support multiple attribute queries the system must have one DHT for each
attribute, depending on the characteristics of the attribute it will be used the standard or extended
version of CAN. The query is split into multiple smaller queries, one for each attribute, that are solved
separately and in the end the results are concatenated in a join-like operation.
In XenoSearch [35] it is proposed an extension to the Pastry system. As in the extended CAN, each
attribute is mapped into a different DHT and the query for each attribute is resolved separately.
Ranged queries are possible due to the fact that the information is conceptually stored in a tree, where
the leaves are the XenoServers and the intermediate nodes are aggregation points (AP). Each AP
summarizes the values of the nodes below it in the tree, the key of the AP is a prefix of the child nodes
IDs, so it possible to determine the range of values of the child nodes.
The system presented above needs multiple DHT to support multiple attribute queries and has the
associated overhead that maintaining all of them requires. In [32] Schmidt et al. propose a system that
supports multiple attribute queries using a single one-dimensional DHT. The system uses a space
filing curve which maps all possible d-dimensional attribute values to a single dimension. Attributes are
mapped onto nodes by interleaving their binary representation. For example, a resource containing
three attributes with values (3, 2, 1) is represented in binary as (11, 10, 01), so it will store in the node
with the ID 110101. Notice that as the number of attribute increases so does the size of the ID.
Ranged queries are possible by leaving some undefined bits that can have any value. For example
the query of resources with attribute values (1, 2, 0–3) is represented as 01*00*. However the range
query sizes can only be powers of two and can only start from values that are also powers of two.
17
3 Economic Model
The economic model proposed, called Gridlet Economics, is designed to be applied on top of a peerto-peer cycle-sharing system. In this type of systems the users make their computers, and respective
computational resources, available to be used by the other participants. Then, when a user wants, he
can submit jobs that are executed on the resources of the other users of the system, making its
execution much faster. In order to make it possible for the job to be distributed over the resources
available in the system, it is split into smaller work units. These units, called gridlets, are the main
input of the model and it is assumed that an existing layer is responsible for their creation and the
aggregation of the result of their execution, such as that described in GINGER [27; 39].
In practice, the objective of the model is to offer a decentralized mechanism that maps the gridlets
submitted to the computers where they will be executed. The selection is done according to a set of
requirements that correspond to the user utility. Since this is an economic model the users will buy the
right to use the resources of the system. For that, a system of credits is used, which also serves as a
control mechanism of the relation between how much a user contributes and consumes system
resources. A reputation system is used as well to ensure that malicious nodes are not able to take
advantage of the system.
This chapter is organized in the following sections: Model overview, in this section we present the
basic characteristics of the model operation, how the information about the available resources is
structured and stored, the algorithm that determines which node will execute a given gridlet and the
mechanism used to represent the user utility; Credit System, this section describes the economic
aspects of model, such as the currency used, how the payments are made or the price charged is
defined; Reputation system, in this section we present the mechanisms that allow the system to
operate in the presence of misbehaving nodes and give it the ability to offer different quality of service
depending on the user class; and Node Dynamics, this section describes the steps required for a
node to enter or leave the system and the procedures that make the model tolerant to faults.
3.1 Model overview
In this model the computers present in the system, called the nodes, can be classified as producers, if
they are contributing with resources to the system where gridlets can be executed, or consumers, if
they have gridlets being executed in the system and therefore are consuming the resources of the
system. Although a node can have both classifications at the same time, normally it will alternate
between them, since when it is a consumer it will most probably not contribute with its resources to the
system, but instead use them to also execute some of its gridlets.
The model also uses a hierarchical approach with two classes of nodes, brokers (similar to super
peers) and ordinary nodes. The brokers maintain a global distributed index where all the nodes that
are contributing to the system are registered, and use it to select the executor of a gridlet, i.e. the
19
producer that will execute it. Although the classification of the nodes is independent of the division in
classes, it is considered that the brokers will not be producers and therefore will not execute gridlets. It
is done in this way because if a broker had to simultaneously execute a gridlet and make the selection
of an executor, both activities would be slower, therefore, since the selection of executor is a crucial
element of the model precedence is given to that task. Besides, when the brokers are selecting a
producer to execute a gridlet, they are already contributing with resources to the system. So, a
possible conflict of interest could arise, similar to inside trading, because that node would be at the
same time, the selector and the selected for the gridlet execution. Nevertheless, in a smaller system
brokers may also act as producers, but the two roles should be implemented in separate processes.
All the nodes in the system will be distributed over a Chord [36] ring. The use of this look up service
provides an efficient mechanism for basic communication and a unique ID to address univocally each
node that can be maintained between sessions. Also, the brokers are defined as the nodes that are
responsible for a predefined set of keys (e.g. 1000, 2000, etc.) in the ring. This way when a node
wants to communicate with a broker, only has to calculate the closest predefined key and send the
message to it. This allows a transparent change of the node that is acting as the broker and an even
distribution of the load across all them. Nevertheless, all brokers can be easily found, which means
that if the user wants, he can choose to use another one. In addition, with this mechanism the number
of the brokers in the system can be controlled by changing the set of keys and the bits in the chord ID.
The basis of this economic model is the transaction, where the consumer pays to have its gridlets
executed on the resources available in the system. The payments are made using credits, a currency
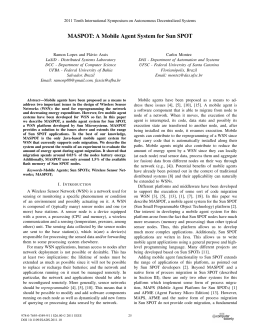
of a virtual money system. The execution of each gridlet is considered a different transaction and it
starts when the gridlet is generated by the consumer. First, it attaches to the gridlet the requirements
specified by the user, and that represent the user utility, and then sends it to a broker (Fig 1 - step 1).
Next, the broker that receives the gridlet, cooperating with other brokers, uses the distributed index to
select the node that, according to the requirements of the gridlet, is better suited to execute it (Fig 1 step 2) and passes the gridlet to that node (Fig 1 - step 3). If the node selected is idle it will
Figure 1 - Steps taken during a transaction
20
immediately execute the gridlet, otherwise it will put it in a local queue to be executed later. During the
execution, the producer monitors the resource consumption and, after the execution terminates, sends
the result to the consumer along with an invoice (Fig 1 - step 4). However, if the consumer is not
online to receive the result, it is stored in another node of the system, the keeper, and the consumer
can retrieve it when it re-enters the system. After receiving the result, the consumer pays the invoice,
which might include the nodes that stored the result, and classifies the producer. Subsequently to
collecting the payment the producer classifies the consumer, thus ending the transaction (Fig 1 - step
5).
3.2 Market Square
The market square is the distributed index maintained by the brokers where the producers advertise
their resources, so that they can be selected to execute the gridlets of the consumers. In essence, it is
a distributed table that contains an entry for each of the nodes that are contributing with their
resources to the system. Each entry has the Chord ID of the node and its characteristics (price, CPU
speed, memory size, OS installed, etc.).
Though, if the market square was a simple table, as the number of entries grows it would become
impossible to search through it. So, the table is indexed by a set of predefined characteristics, called
the unit of cost. These characteristics will be arranged in a way that makes it possible to travel
through the index in ascending / descending order or go directly to a given point. This implies that the
values of the unit of cost will be compared, so they have to be scalars with an ordering relation among
them. The characteristics selected to belong to the unit of cost should be characteristics in which most
of the users have an interest in, since the search is primarily done on them. This decision is very
important and should be done carefully, because it will affect the result of the selection of the executor.
An example of a unit of cost might be CPU speed or number of cores, memory size and network
bandwidth, as they are characteristics that will probably affect the execution of mostly every gridlet.
Figure 2 - Distributed index
21
However, in a peer-to-peer system it is not possible for one node to store information about all the
other nodes in the network, so that is why the index is distributed among all the brokers. In order to
distribute the index among them without losing the ability to efficiently search through it, the brokers
will organize themselves in a d-dimensional CAN [29], where each dimension corresponds to a
characteristic of the unit of cost. Then, each broker has the part of the index which corresponds to the
characteristics that match the zone for which it is responsible. This means that the node responsible
for the zone between 1950 and 2050 in the dimension of the CPU speed will have the index of the
ordinary nodes that have the CPU speed in that range (Fig. 2). In this way, it is still possible to travel
efficiently through the index using the CAN routing mechanism. Though, normally the range of values
and scale will differ from characteristic to characteristic and, if those exact values are used to define
the CAN dimensions, this would hinder its routing system. So, instead of using the actual values of the
dimensions, a canonical representation is used. For example, from 0 to 100 and the conversion is
made by calculating a percentage against the difference between the bottom and top value.
3.2.1
Specifications and evaluation
Specifications are the representation that is used to express the characteristics of the resources
made available by the producers and the utility function of the consumers for the gridlet execution. In
order to be able to fulfil the requirements of a cycle-sharing environment, that representation has to be
expressive and flexible. In this model it is used an adaptation of the Utility Algebra describe in [34].
Next we describe how it can be used to represent the producer characteristics or the consumer utility,
though we refer to the article for a more detailed description.
The Utility Algebra uses XML to represent the information, so it is simple to use to represent the
characteristics of the producer. Each characteristic is translated into a “resource” tag with a particular
name. Inside the “resource” tag, more tags are inserted to represent the specific characteristics of that
attribute and its values. In Figure 3 we give an example of the XML file that represents a producer with
a CPU with four cores, each with 2.2 GHz, and 4 GB of memory.
The representation of the consumer utility follows the same concept used to represent the
characteristics of the producer. However, since the utility function is more complex, it has to be more
expressive. Specifying only a single value for a requirement limits the consumer to specifying the
maximum or minimum value that it will accept, which implicates a binary satisfaction classification
where the node is either accepted or rejected. This is rather inflexible and the fact that a node does
not meet that value does not necessarily means that his utility is 0.0. So, in the utility specification the
requirement can also be specified by a range of values and an indication of how well they satisfy the
requirement. Additionally, the user might also specify the priority of requirement, i.e. if a choice has to
be made between trying to maximize two different resources that are exclusive, which one would he
preferred to be maximize first. This can be done by giving a weight to each requirement and
multiplying it by the value of utility. This aspect is necessary mostly for the characteristics of the unit of
cost, mainly because the search is done across different zones of the index, according to its values
and there is the need to direct it (more details in section 3.2.2).
22
However, the utility of each characteristic of the producer by itself is not enough to select the node that
will execute the gridlet. It is necessary to evaluate them as a whole in order to reach an aggregated
utility value for that producer. That value is then used to compare that node with the other possible
alternatives and select the more suitable node to execute the gridlet. So, the evaluation of the actual
utility value of the producer is done calculating the value of each requirement separately and then
combining them by using the following logical operators: and, or. The logical operator and returns the
sum of all the requirements inside it and the logical operator or returns the maximum value of the
requirements in it. The value returned by the root operator is considered to be the value of the
evaluation and the actual utility value of that producer.
-------------------------------------Producer characteristics
-------------------------------------1 <resource name=”CPU”>
2
<config>
3
<processorCores>
4
<value>4</value>
5
</processorCores>
6
<processorSpeed>
7
<value>2.2</value>
8
</processorSpeed>
9
</config>
10 </resource>
11 <resource name=”memory”>
12
<config>
13
<size>
14
<value>4000</value>
15
</size>
16
</config>
17 </resource>
-------------------------------------Consumer Utility
-------------------------------------1 <requirement>
2
<requirement>
3
<or>
4
<requirement>
5
<resource name="CPU" >
6
<weigth>2</weigth>
7
<config> <processorCores>
8
9
10
11
12
13
14
15
16
17
18
19
20
21
22
23
24
25
26
27
28
29
30
31
32
33
34
35
36
37
<minnumber>4</minnumber>
<util>1.0</util>
</range>
<range>
<minnumber>2</minnumber>
<util>0.5</util>
</range>
<range>
<minnumber>1</minnumber>
<util>0</util>
</range>
</processorCores> </config>
</resource> </requirement>
<requirement>
<resource name="Memory" >
<weigth>1</weigth>
<config> <memorySize>
<range>
<minnumber>3.0</minnumber>
<util>1.0</util>
</range>
<range>
<minnumber>2.0</minnumber>
<util>0</util>
</range>
</memorySize> </config>
</resource> </requirement>
</or>
</requirement>
</requirement>
Figure 3 – Example of the XML representation of the producer characteristics
and the consumer utility using the partial utility algebra
3.2.2
Selection of the executor
The selection of the node that will execute the gridlet is done by evaluating the entries of the market
square according to the requirements specified in the gridlet, which represent the user utility, and then
choosing the node that is better suited to execute it. This means that all the nodes contributing to the
system have to be published in the index of the market square, otherwise they will never be selected
to execute a gridlet and, therefore, it is as if they were not contributing. However, as the number of
entries of the index increases, it would become unfeasible to evaluate them all. Furthermore, the index
is split into zones that are stored in different nodes. So, instead of doing a full index search, the search
23
starts at the point that is more likely to maximize the user utility and stops when it estimates it that has
reached the best alternative. This sometimes also happens in real economy, where consumers are
unable to check the individual price of a multitude producers or sellers.
To find the point that is more likely to maximize the user utility, the unit of cost is used. For that, it is
assumed that those characteristics have a great interest to all of the users and also that they all agree
in whether they should be maximized or minimized. In an economic cycle-sharing environment this
can be easily achieved, if the characteristics considered are features such as price, processor speed
or network bandwidth. So, in order for the search to start in the point most likely to maximize the user
utility, the first broker, which is the one that receives the gridlet from the consumer, uses the routing of
CAN to send it to the point which corresponds to the maximum / minimum limit of the dimensions of
the characteristics of the unit of cost that should be maximized or minimized, respectively. When the
gridlet reaches the best suitable point, a local search is performed, which is made by evaluating the
nodes in that part of the index and determining the utility of the best one. Then, an estimation of the
values present in the adjacent zones is evaluated. The adjacent zones correspond to the neighbours
in CAN, so this is called the neighbour search. This is done to estimate the utility that could be
achieved if a local search was done in one of those brokers. If the utility of the node selected locally is
higher than the one of the best neighbour, the gridlet is sent to that node to be executed. Otherwise,
the gridlet is sent to the broker responsible for best adjacent zone, which repeats the same local
search steps. The search stops when a node is selected, or neither the node selection nor the
neighbour selection returns a satisfactory result. In that case, the search fails and a notification is
returned to the node that submitted it to the system. Figure 4 presents the pseudo-code for search in
the index.
search_in_index (gridlet) {
best_node = local_search (gridlet.specifications);
node_utility = best_node.utility;
best_neighbour = neighbour_search (gridlet.specifications);
neighbor_ utility = best_neighbor. utility;
if(node_ utility < 0 && neighbor_ utility < 0)
return fail;
if(node_ utility >= neighbor_ utility)
best_node.execute (gridlet);
else
best_neighbor.search_in_index (gridlet);
}
Figure 4 - Pseudo-code for the search in the index
The search is directed in a contrary direction to the one indicated in the unit of cost, i.e. the search can
only travel down in the characteristics that are supposed to be maximized and up in the ones that
24
should be minimized. This means that only the neighbours that respect this rule are considered in the
neighbour search. That restriction is applied to avoid loops without requiring the brokers to maintain
state regarding ongoing searches, which is a great advantage when considering a great number of
simultaneous searches, because it significantly improves scalability and reliability.
3.2.3
Occupation
In a scheduling mechanism it is very important the ability to distribute the jobs efficiently across all the
available resources regarding load balancing and system utilization. This is important, not only when
the nodes in the system are idle and available to execute the gridlets, but mainly when they are
occupied, and have a queue of jobs waiting to be executed. Therefore it is essential that the selection
of the executor takes the producers occupation into consideration.
Since the occupation can be measured by counting the number of gridlets that are waiting to be
executed in a given node, plus one if it is occupied executing a gridlet, it can be represented as a
scalar and treated as any other characteristic. Nevertheless, unlike the other nodes characteristics,
such as memory size or CPU speed, that do not change over time, the occupation is constantly
changing, and therefore it cannot be treated exactly in the same way. The initial occupation of a node
is specified by the node as the other characteristics, but it is automatically incremented by the broker
when it sends a gridlet to be executed in that node. However, there is also the need to decrement that
value when the node finishes the execution of a gridlet, so when the execution finishes the node
sends an update message to the broker that contains its entry informing that the execution has ended.
Additionally, the occupation can also be decremented by the fault tolerance mechanism described in
section 3.4.2.
With this information, a requirement can be created that reduces the classification of a node according
to its occupation, this way, depending on the consumer utility the selection of the executor can give
precedence to nodes that have a lower execution queue. Moreover, if that requirement has enough
weight it is able to normalize the execution queues of all nodes, thus achieve a good system load
balancing.
3.3 Credit system
In the model proposed, the nodes that use the resources system, the consumers, pay the nodes that
contribute, the producers and the brokers, for their services. The payments are done using credits, a
currency of a virtual money system. We use virtual money because it has fewer security concerns and
also because the operations are done automatically, which would be a problem if real money was
used. This means that in order for the model to operate it is necessary to have a virtual money
system, however since there was already done extensive work in that area, which produced several
different alternative systems [23; 40], it is considered to be outside of the scope of this work.
Moreover, the functioning of the model is independent of the type of virtual money system used, as
25
long as it supports the functionality described in this section, so in this model it is assumed that
another layer provides that functionality.
In this section we describe the rules used to define who gets paid in each transaction and how much.
Also, we present how the prices are automatically defined by the producers and the how an analysis
of the market state (resources offered, prices asked, etc.) can be made. In the last sub-section is
explained the procedures required to maintain the model operating over a long period of time without
running out of credits.
3.3.1
Payments
As it has been said before, the consumers pay for the execution of their gridlets, which creates the
need to pricing, which defines how much they will pay. However, the consumption of resources that
occurs during an execution can vary much from gridlet to gridlet and it is difficult to estimate
beforehand how much resource consumption there will be. This means that if the total price charged
for the execution was determined beforehand, one of the parties would most likely lose with that
transaction. So, instead of determining the price for the entire execution the producer defines a fee,
which is the value that will be multiplied by the resources used (in essence, the unitary price charged).
This fee can be the same for all the resources or be specific to each resource in particular. The
definition of the value of the fee is determined as it is done in the Commodity market, which means
that the producer is the only responsible for its definition. It is then published it in the index and this
way, the fee is incorporated in the selection of the executor and selected according to the consumer
utility.
The brokers are also contributing to the system, in fact they ensure that resources are discovered for
gridlet execution, however if only the execution of gridlets is paid, that means that they are not
rewarded for their contribution. So, in order to compensate them, they charge a tax for each
transaction in which they participate. However, due to the high number of brokers that participate in a
search, it is not feasible to pay a percentage to all them. Because for that to be done the taxes would
have to be very high or the value paid to each one would not be relevant.
The brokers that participate in the selection of the execution can be divided into two categories
according to the task that they perform: the ones that simply route the gridlet to the point where the
search in the index starts, which is a task that requires very little work, and the brokers that do a local
and neighbour search, which are tasks that consume more resources. Due to the amount of resources
that each broker uses, it is only fair that the ones that do the local and neighbour search be the ones
being paid. However, depending on the requirements and the state of the system this can still mean a
large number of brokers. Nevertheless, since the search starts at the point that is most likely to
maximize the user utility, it can be assumed that most of the searches will stop in the first broker that
does a local search, unless that broker is full. This means that if a node did a local search and it failed,
most likely it has already done many successful searches. So, it is defined that only the broker that
does a successful local search is paid, which is the last broker to participate in the search and
26
therefore also the one responsible for the mechanism of fault tolerance of the gridlets execution
(described in section 3.5.2).
However, there is one problem, a broker that stays with a part of the index less wanted or populated
will do fewer local searches and therefore will receive fewer taxes. This means that node, despite the
fact that it is contributing to the system, would not receive any credits and therefore would be harmed
for being a broker. In order to prevent this problem, the broker that first receives the gridlet from the
consumer will also get paid a fee. This way, one of the taxes will be distributed uniformly among all the
brokers, since the selection of the broker by the consumer is random, and another is paid only to the
ones that do most of the work.
A special case is when the consumer is not present in the system and therefore cannot receive the
execution result. When this happens, another node of the system stores the result for him, since that
node also uses its resources to the benefit of the consumer, it should also be compensated. So, there
will be a fee which will be charged for storing the result. However, since the consumer cannot select
the node in which the result will be stored, the fee that will be charged by the node that stored the
result will be fixed for the entire system.
Node
Multiplier
Partial value
Total value
Consumer
- 100 %
- 500 - 50
- 550
Producer
90 %
500
450
Broker 1
4,5 %
-
22,5
Broker 2
4,5 %
-
22,5
Redirector
1%
-
5
Keeper
10 hours
5
50
Table 1 – Example of the credits paid by the consumer for a gridlet execution that
cost 500 credits and which the result was stored in the keeper for 10 hours.
If the mechanism of selection of the brokers (section 3.5.3) is used, the node that redirects the
messages to the real broker should get an incentive to do its task. However, since this is not a task
that consumes many resources and does not prevent the node from executing gridlets, the value
charged should be rather small. Therefore, it will not have a great impact on the final price of the
transaction. Table 1 shows an example of the values charged in a transaction.
3.3.2
Variable price policy
To encourage the contribution in times of greater demand, and also to encourage the use of the
system in times of lesser demand, is used a dynamic price definition referred to as the variable price
policy. This means that the fee asked by the producers will vary according to the relation between the
supply and the demand; when the demand is greater than the supply the fee will be higher and when
the demand is lower than the offer the fee will be lower. However, in order to change the value of the
27
fee accordingly, the user must be always monitoring the relation between the demand and supply,
which would force him to be constantly checking the state of the system. This is not feasible, so the
definition of the different fees changes according to the perceived variation in the demand and the
supply is done automatically and mostly locally.
The simplest way that a node has of evaluating the relation between the demand and the supply is
looking at his own occupation. As it was said before, the occupation is the number of gridlets that were
assigned to a producer to be executed and either being executed or waiting to be executed. Then,
according to that value the demand and supply can be roughly classified using the following estimation
rules:
•
If the occupation is higher than 2, the demand is estimated as higher than the supply.
•
If the occupation is 1 or 2 the demand is similar to the supply.
•
If the occupation is 0 the demand is lower than the supply.
With this information the node can automatically raise or lower the fee asked, the user only needs to
define the value that is incremented or decremented in each price update and the time interval
between them.
However, this is a competitive market place, where each node wants to be selected to execute the
largest number of gridlets possible for the highest price possible. Therefore, in practice the nodes
compete for the gridlets, because if one is selected it means that the others are not. So, each
producer must not only look at its fee and occupation, but should also take into consideration the fee
and occupation of the competitors. But, as it happens in the real world, due to the large number of
competitors it is not viable to analyze them all. So, only the closest competition, the nodes with similar
characteristics are considered, since those are the ones more likely to receive the gridlets that could
be his. The best way of getting that information is through the broker that has its entry of the index,
seeing as nodes with similar characteristics will have their entries stored either in that broker or in its
neighbours. Therefore, instead of only looking at its occupation, the producer asks the broker where it
is registered for the average of the occupation and fee of its closest competition and applies the rules
to determine the relation between the demand and supply. The closest competition may only include
the nodes registered in that part of the index or also consider the entries of the neighbours in the price
dimension. Since this values are no longer integers the estimation rules are adjusted:
•
If the occupation is higher than 1.5 the demand is higher than the supply.
•
If the occupation is between 0.5 and 1.5 the demand is similar to the supply.
•
If the occupation is lower than 0.5 the demand is lower than the supply.
Since this information is based on the occupation of many nodes, it is more stable, and therefore also
makes the decision of changing the fee more stable and less susceptible to wide and frequent
fluctuation.
28
Nevertheless, there is a special case, when the occupation of the node is constantly very different
from its competitors that information should not be used. That is because most likely the node has, or
has lacks of, one characteristic, like a rare application or codec installed, that distinguishes it from the
other nodes and therefore they are not really competitors. In this case the producer should only look at
its own occupation in order to avoid being influence by information that does not apply to its case.
To further refine the automatic definition of prices, there is another aspect that can also be taking into
consideration, the tendency of the market. The tendency of the market is calculated by comparing the
current occupation with the values previously measured in order to determine if the demand is raising
or declining. The value is then used to limit the changes in the fee that are likely to be contradicted in
the near future. This means that if the tendency is declining, the fee is not raised and if it is raising the
fee is not lowered. This way, the node can anticipate a shortage of gridlets and increase beforehand
its execution queue or profit more from great demand by charging higher prices from the beginning.
3.3.3
Market analysis
When a producer starts contributing to the system, it requires information about the state of the
system at that time, in order to define the initial fee asked. This information is also needed when the
user wants to submit gridlets into the system, otherwise he cannot make an informed decision about
the requirements defined or even decide when it is the best time to submit the gridlets. For this
purpose, the brokers provide a service called market analysis that allows the users to have a partial
view of the state of the system.
Similar to what happens in the automatic price definition, in order to determine the initial fee the
producer will want to have an overview of the occupation and fee asked by the nodes that have similar
characteristics to its own that are already in the system. However that node is neither yet registered in
any broker or nor is it possible to determine the point where its entry will be stored, since it still does
not have its fee defined. So, instead of querying the brokers for the occupation of the entries near a
random point, the producer asks for the occupation of the nodes across the line that is achieved by
varying the fee between the minimum and maximum values allowed and fixing the remaining
characteristics to the value of the unit of cost of the producer. This way the market analysis returns an
overview of the closest competition of the node independently of the initial fee defined.
In order to get an analysis of the market, the entering producer sends a message to the broker that
corresponds to its characteristics and to the lowest fee possible, the dimension lower bound. The
broker then redirects the message to the upper neighbour of the fee dimension whose zone also
matches the others characteristics. This way, the message travels along the desired line and retrieves
the prices and occupation of the zones from where it passes. That information is separated into
ranges which correspond to the index zones through which messages passes and, in the end, is
returned to the producer that submitted it. The producer analyzes the result of the query and based on
that information decides the fee that it will ask.
29
The market analysis done by the consumer is made also using the same mechanism. However, the
consumer is not interested in a single set of characteristics. So, in order to get a broader overview of
the state of the system, instead of doing a single market analysis, the consumer samples multiple
characteristics. Since this is not an automatic process, the user can decided how many samples are
done until he is satisfied with the overview of the system achieved, or until the variance falls into a
certain threshold.
To reduce the number of market analysis messages that travel between the brokers, the values
returned can be cached. Since the first broker contacted to do a market analysis is always the one that
corresponds to the lower limit of the fee dimension, the cache value is stored there. The cache system
can be used because the market analysis does not need to be completely up-to-date, since it is only
used to give an estimate and not an accurate description of the state of the system. Moreover, seeing
as the values returned are divided into ranges the chances that a cache hit happens are very high.
3.3.4
Shortage of credits
In order to achieve long term sustainability in an economic model it is necessary that there are
constantly credits being exchanged in transactions, because otherwise the systems stalls and might
collapse. However, there are two situations that can prevent this by creating a shortage of the credits
being exchanged: the deflation and the monopoly. This also happens in real economy where decrease
in currency produces a recession.
The deflation is a situation where the credits are taken out of the system. This happens because the
credits which belong to the nodes that leave the system permanently become unreachable and
therefore the number of credits being used in the system decreases. Even though this can be
contradicted by having new nodes entering the system with new credits, it is not possible to guarantee
that the amount of credits coming in is enough to compensate the amount moving out. So, the solution
is to determine which credits are unreachable and reinsert them into the system. In order to detect
these situations it is defined an expiration time for the accounts. This value is extended when the user
enters the system, which means that if a user is too long without logging into system, his account is
closed and his credit removed from the system. Then, in order to reinsert those credits into the
system, a periodical verification is done to calculate of how much money is still present in the system.
If the amount of money passes below a determined limit, it is calculated how many credits are
necessary to raise the total back to normal levels. That value is divided by the number of active
accounts and the result added to all of them. This way, it is sought that there are always credits
available to make the transactions, independently of the number of nodes and the amount of credit
that leaves the system.
The monopoly is a situation where a single node or small group of nodes (oligopoly) controls all or
most of a specific type of resources, which in this case are the credits. This situation is also a threat to
the long run of the system for two reasons. The first reason is because if a node occupies with his
gridlets all the producers of the system at the same time, it prevents the other nodes from also using
30
them, therefore rendering the system useless for most users. If this is done for long enough it can lead
to their abandonment of the system. The other reason is because if one node keeps all the credits to
himself and do not use them (credit hoarding), the remaining nodes will run out of credits to use,
similar to what happens in the deflation. So, in order to prevent this from happening a time stamp is
placed to force the node to use his credits, after this time has passed the credits are considered lost
and removed from the system. The credits removed are included in the next deflation verification and
also redistributed. This way, the users are encouraged not to hoard credits, which help keeping the
economy alive and emulate the natural inflation of the currency.
3.4 Reputation system
In every transaction there is the risk that one of the parts might not behave properly and try to take
advantage of the other. In peer-to-peer systems this is an even greater problem because the
anonymity of the Internet gives the users a sense of impunity, which combined with the absence of a
controlling third party, makes users feel that they do not have to behave properly. If not controlled, the
problem of the malicious nodes can make most users leave the system and lead to its collapse. So, in
order to prevent that type of nodes from being able to take advantage of the system, or each other, a
reputation system is used which helps to identify them and isolate them. However, since the model is
independent of it, the details of storage and calculating formulas of the reputation are considered to be
outside of the scope of this work.
Nevertheless, the types of users are not limited to bad or good according to their behaviour. In a peerto-peer cycle-sharing system there can be many different types of users depending on how much they
contributed, how much time they spent in the system, if they are registered, etc. Therefore it is
important that the model is flexible enough to treat them differently, depending on the type of user that
they are. To do so, the nodes are divided into classes and in this section we describe the aspects that
can be changed in the way the requests are treated, in order to offer different quality-of-service for the
different classes.
3.4.1
Misbehaving nodes
The nodes are considered to be misbehaving if they do not follow the rules of the model. But it is
assumed that they do that not because they want to destroy the system but because they want to gain
more from it than what they deserved. Since the main interactions in the system are the transactions,
it is also when the misbehaving nodes are mostly likely to act. As such, seeing as they are done
between a consumer and a producer, it was analyzed how they could take advantage of each other.
As a producer participating in a transaction, the user can take advantage of the consumer in two ways:
fraud and overpricing. It is considered fraud when the producer instead of executing the gridlet returns
a fake result and asks to be paid. When this happens, and it is detected, the consumer gives a bad
classification to the transaction and refuses to pay.
31
Overpricing is when a producer claims that the execution used more resources than it actually did and
this way tries to charge a price higher than it should. Since it is difficult to know how many resources
an execution will consume without executing it, this situation is hard to detect. In order to detect it, is
assumed that the gridlets are passed by the consumer in groups with a relation among them, which is
normal considering that a job will generate a set of similar gridlets. Then, the price charged for the
gridlets of the same job is compared in order to define an acceptance threshold and if one of the
prices charged is higher than that threshold, it is considered overpriced. In this case the consumer
also gives a bad classification and pays only the amount he considers fair. The bad classification is
important because the reputation is inserted in the search. A producer with a lower reputation will have
to lower the fee asked to compensate, and eventually will stop being selected to execute the gridlets,
which means that will not be able to gain credits to use the system.
On the other hand, the option of not paying gives the consumer the possibility of having some gridlets
executed for free by falsely claiming that it was the victim of fraud. In extreme cases this would lead to
the appearance of free-riders, nodes that never paid to use the system. In order to prevent this from
happening, when the consumer submits a gridlet he has to pay a deposit, a value which is always paid
to the producer that executed the gridlet. Moreover, after receiving the payment the producer also
classifies the consumer. This is important because a consumer with a low reputation has to pay higher
deposits. Also, a node is a consumer and producer, so a low reputation as a consumer will make him
have a low reputation as a producer and vice versa.
One other issue regarding the consumer is when they submit gridlets and abandon the system or only
return after an extremely long period of time. In this case they are not taking advantage of the
producer for their benefit, since they do not gain anything; however they are harming the producer
seeing as it executed the gridlet but will never get paid or at least not in useful time. Therefore, in
order to prevent this from happening, the transactions have a time limit. This means that after the
execution has ended the consumer has a limited amount of time to retrieve the result and pay the
producer. If that limit is not respected, the result is discarded and the producer paid full price, even if
that means the consumer will stay with a negative balance. This mechanism also has the advantage
of preventing the results from being stored indefinitely, performing as the garbage collecting of the
system.
The last aspect considered was the possibility of a node performing a sibling attack. A sibling attack is
when the same user creates several different identities and tries to use them to benefit the main
identity. There has already been done much research in how to prevent this type of attacks, namely in
reputation system [11], so it this work it is only addressed how to prevent this type of nodes from using
the transactions in their benefit. In order for the attacker to use the transaction to make one identity
benefit other of his identities, he must be able to choose which nodes participate in the transactions,
so that he can pair them. This is only possible if the user manufactures a dummy characteristic that no
other node has, ensuring this way that only the desired node is selected. Therefore, in order to prevent
this, the brokers have to regulate which characteristics are allowed to be published in the index.
32
3.4.2
Classes of users
The flexibility to offer different quality-of-service depending on the type of user is an interesting
characteristic on a system that is open to the public [16]. In this model, the number of classes, and the
different treatment received according to it, is not limited to a predefined number. There is a set of
conditions that can be applied and depending on how and which are applied, the number of classes of
users may vary. Next we will describe those restrictions.
One of the restrictions is to limit, during the selection of the executor, the access to some parts of the
index. In practice this can be done in two ways: by changing the point where the search starts or by
limiting when the local search is done. Normally the search starts at the point that is most likely to
maximize the user utility, which corresponds to the upper / lower limit of the characteristics of the unit
of cost which the user wants to maximize / minimize. But, if instead of starting in that point the search
starts in another point distant from the limits, which will correspond to less powerful resources, that
class of user is prevented from using the most powerful resources, leaving them free for the users of a
better class. This happens because the search is directed and therefore cannot search backwards
from the point where it started.
However, this mechanism is very rigid and blocks completely the access to those resources in any
situation, even when the system is idle. In order to avoid this, there is another mechanism in which the
search in the index starts in the point that is most likely to maximize the consumer utility, but if the user
is from a lower class and the occupation of that part of the index is above a determined value, a local
search is not performed. This means that if the system is idle, the nodes from every class can access
the full resources of the index, but when it starts to be occupied, some parts are blocked from the
lower classes, reserving them for the users of the upper classes. Both mechanisms can be
implemented with very little changes to the way how the selection of the executor is done and,
depending on the limits chosen, define several different classes can be created.
One other aspect that can be changed in the selection of the executor is how the characteristics of the
producers are evaluated according to the consumer requirements. The way the evaluation is done is
described in section 3.2.1 and the method described is similar to the priority policy of the Partial Utility
Algebra [34]. In the article it is describe how using a different policy, which modifies the way that the
evaluation is done, can produce different qualities of service in the search. The same can be applied
to this model, if the brokers use a different policy to evaluate the entries according to the consumer
class, the search will select the executor with a different accuracy and distinct tolerance to failures in
meeting the requirements.
Regarding misbehaving nodes, we said that the value paid as a deposit varies depending on the user
reputation. This concept can be extended to the classes of users, where the value of the deposit is
split into levels and depending on the user class they pay a different amount. For example, the nodes
from the class B have to pay a signal between 50 and 100 credits and the users from C pay from 100
33
to 150 credits. The actual value can then be calculated according to user reputation, time in the
system, number of transactions, etc.
3.5 Node dynamics
The population of peer-to-peer systems is normally transient, which means that the nodes are
constantly entering and leaving the system. Moreover, in this type of population, unannounced or
unexpected departures are very frequent, not only due to the crashes that affect every electronic
system, but also because the user may decide to close the application at any time, because he needs
the computer to do other activities. Therefore, it is essential that a model intended to be applied on top
of a system of that type considers those situations. So, in this section we describe the steps that a
node has to perform in order to enter and leave the system, as well as the mechanism that make the
model resilient to nodes failures.
3.5.1
Entering and leaving
To enter the system, an ordinary node needs to enter the Chord ring and get the knowledge of how to
calculate the predefined keys, so that it is able to contact the brokers, which is essential in this model.
It must also login or register in the reputation and credit systems. If the node is only going to use the
resources of the system, this is enough. However, if it is going to contribute, it also has to publish its
availability in the index. This is a very important aspect, because since the selection of the executor is
done based only on the index, if a contributing node is not inserted in the index, it will never be
selected to execute a gridlet.
To leave the system, a node needs basically to do the opposite of what is done to enter. It simply has
to leave the Chord ring, logoff from the reputation and credit system, and if it is registered in the index,
delete the entry. However, in the case when the producer is executing a gridlet, in order to avoid the
penalties for abandoning the execution, the node should wait until the end of that execution, as well as
the execution of the gridlets waiting in the execution queue, and only then leave the system.
Normally the brokers do not enter or leave the system, what happens is that when the node
responsible for the predefined key changes, the execution of the broker is transferred to the node
which became the new broker. In a transfer most of the information required to be a broker is simply
copied from the old node to the new one. The only change that has to be made is in the neighbours,
which have to update their pointers to the broker that was transferred. However, despite the simplicity
of the operation, it can be a very heavy task, depending on the size of the index and the number of
entries.
The entering and leaving of brokers occurs when a node becomes responsible for two or more
predefine keys. So, assuming that there is a good dispersion of nodes across the Chord ring, this will
only happen when the number of nodes is close to the number of predefined keys, which is a situation
that it is not expected to take place often, since it would be an indicator that the system has very few
nodes or too large number of predefined keys. For a broker to enter, two steps are required: the
34
entering node must enter the CAN coordinate space and the broker that gave half of its zone passes
the corresponding half of the index. To leave it is the inverse process, in which the leaving node
leaves the CAN and copies its part of the index to the broker that became responsible for its zone. In
order to maintain the consistency, during this processes the intervening brokers do not realize any
other operation.
One particular aspect that also is related to the nodes dynamics is when the execution result is
returned while the node is offline. In this case the result is stored in the node that is responsible for the
key that corresponds to the ID of the consumer, which becomes the keeper of the result. The reason
to select that node to store the result is because this is the node that actually receives the result. Also,
when the consumer re-enters the system it will become the responsible for that result, which means
that it is automatically retrieved. Nevertheless, this mechanism implicates that when a node enters the
system it must retrieve the stored results for which it became responsible. And before leaving the
system it must pass the results to its successor.
3.5.2
Fault tolerance
In this model, the fault tolerance has to consider two aspects: when a gridlet is in the system and the
crashes of the producers or the brokers. In other situation, such as the crash of a consumer, the
functioning of the system will not be affected as long as they are properly dealt by the Chord fault
tolerance mechanism.
In order to prevent the loss of gridlets when they are in the system there has to be a fault tolerance
mechanism. This mechanism works in two steps. The first step is from the moment the gridlet leaves
the consumer until it reaches the node that will execute it, and the second works while the gridlet is
being executed. Due to the possibly high number of nodes by which the gridlet passes during the first
step it is hard to implement a fault tolerance mechanism, so instead a timeout is used. The gridlet has
a time limit since the time it is submitted to the system until the selection of the executor occurs, if the
time is not respected the gridlet is resubmitted. To stop the resubmission of the gridlet the executor
must send a receipt saying it received the gridlet.
While the gridlet is being executed, in order to achieve replication, when the broker sends the gridlet to
be executed, it also sends it to another node to be stored has a backup. The broker will monitor to
check if the executor crashes, if it detects that the executor node failed it signals the backup node to
start the execution. To stop the monitoring, the node signals the broker that it has finished the
execution of the gridlet.
Since the execution of the gridlets is already treated, the crash of a producer leaves only two
problems: the entry of the index, which takes up space, and the loss of the results being stored. The
detection of an entry that corresponds to a producer that crashed is done in two ways: when the
broker tries to send it a gridlet to be executed and the node does not answer; and when the lease
associated to the entry expires and it is not renewed. In either case the entry is removed from the
index, which will prevent dummies entries from occupying space in the index. The second mechanism
35
forces the producers to be continuously renewing is entry, but will prevent a node from being excluded
during a long period in the case of being wrongly removed, which can happen due to network failures
(and as it was already said a producer not registered cannot contribute). On the other hand, the fault
tolerance of results being stored can be achieved by keeping one or more replicas on the Chord
predecessors.
The fault tolerance of the brokers is necessary to ensure that the index information and the fault
tolerance mechanism of the gridlets are never lost. To guarantee that, we use a passive replication
system in which the predecessors of the acting broker store a replica of the index and the information
about the backups of the executions.
3.5.3
Broker selection
The brokers are a key player of the model and can be a bottleneck that could cause the collapse of
the system if they do not have the resources necessary to perform their tasks efficiently. Besides, one
of the advantages of a hierarchical approach is to put the more powerful nodes doing most of the
work. So, instead of the selection of the brokers being random, as it happens when the decision of
being broker or not is determined by the position in the Chord ring, they are selected by a broker
already in function.
Since all the producers and their characteristics are registered in the index, it is only natural that the
selection of the next broker is done using that information. Besides, since the brokers themselves are
not registered in the index, there is no risk of choosing the same node twice. So, in order to select the
node that will be promoted to broker, the node that is already a broker sends a special search
message that returns the entry that it is best suitable for the role. The search can be done by simply
selecting the most powerful node or it can also take into consideration other aspects, such as the
reputation or the time connected. The selected node is then notified and does the process described
in section 3.5.1 required to become a broker.
In order to use this mechanism without losing the advantages of having the brokers in pre-defined
keys, it is necessary to create a level of redirection. Instead of the broker being in the predefined key,
there is an ordinary node, called the redirector, which knows the location of the broker that was
supposed to be in that position. Then, when that node receives a message sent to the predefined key,
which means that was intended to the broker, it forwards to the actual broker. However, for this
mechanism to work no node can have ID one of the predefined keys. Subverting this redirection
mechanism is hard, since the selection of the redirector is made randomly and because the consumer
can choose to use another redirector. Moreover, if the selection of the brokers takes into consideration
the time connected, it will reduce considerably the frequency of the switches of brokers, which implies
that there will be less transfers of the index information, a very resource consuming activity.
To achieve fault tolerance with this mechanism it is necessary to guarantee that the location of the
broker is replicated. That backup can be done in one or more successors of the Chord, since those
are the nodes most likely to become the next redirector. The fault tolerance of the broker is done as
36
described in section 3.5.2, the only difference is that the passive replication is done on the node that
would eventually replace it.
3.6 Summary
In this chapter we presented an economic model designed to manage the resources of a peer-to-peer
cycle-sharing system. In our system the users make their computational resources available to
execute gridlets, small and independent work units, from other users. It is the responsibility of the
model that we propose to, in a decentralized manner, map each gridlet to the resource where it will be
executed.
In the model the nodes can be classified as producer, if they are contributing with resources, or as
consumer, if they are consuming the resources of the system. It is also used a hierarchical approach
with two classes of nodes, brokers (similar to super peers) and ordinary nodes. The brokers maintain
a distributed index, called the market square, where the producers advertise the resources that they
have available. Then, the brokers use the market square to select the executor of a gridlet, i.e. the
node that will execute the gridlet. In order to distribute the market square across all the brokers, while
still maintaining the ability to search through it efficiently, the index is created over a CAN coordinate
space.
The basis of our model is the transaction, where the consumer pays the producer to have its gridlets
executed on the resources that the producer made available. The payments are made using credits, a
currency of a virtual money system, and the execution of each gridlet is considered a different
transaction. A transaction consists in 5 steps: the consumer sends a gridlet to a broker (1), together
the brokers decided which producer will execute the gridlet (2), the gridlet is sent to the producer
which executes it (3), the result of the execution is returned to the consumer (4) and finally the
consumer pays the producer for the execution and both classify the transaction (5).
The selection of the producer that executes the gridlet takes into consideration a set of requirements
and preferences that are specified by the consumer. This specification also includes the price that he
will have to pay. However, since it is difficult to determine beforehand how many resources an
execution will consume, the producer does not define how much an execution will cost, instead it
defines a fee which is multiplied by the resources consumed to determine the total cost of the
execution. In order to encourage the contribution in times of more demand and the consumption in
times of greater supply, a variable price policy is proposed that lowers or raises the fee, according to
the variations in the demand and supply.
In economic transactions, there is always the risk that one of the parts might not behave properly and
try to take advantage of the other. To mitigate that risk a reputation system is used and in the end of a
transaction, the consumer and producer classify each other. This way, the nodes that misbehave can
be identified and isolated from the system. Also, due to the heterogeneous nature of the population of
37
a peer-to-peer system, in our model we presented mechanisms that provide different quality of service
based on the user class.
38
4 Software Architecture and
Implementation
The Gridlet Economics model consists in three main roles (consumer, producer and broker) that
interact with each other but are fairly independent. Therefore, its architecture and implementation is
decomposed in modules that follow the same separation: the consumer module, the producer module
and the broker module. The consumer module is responsible for inserting the gridlets into the system,
receiving the results of its execution, paying and classifying the transaction. The producer module
tasks are to publish its resources in the index, execute the gridlets and also classify the transaction.
The classification of the transaction is implemented in both the consumer and the producer modules
because depending on the role that is classifying the transaction, the criteria and rules used are
different. The broker module creates, maintains and performs searches over the market square and
provides the market analysis service.
Gridlet Economics
Consumer
Controller
Producer
Broker
Advertiser
Indexer
Executor
Monitor
Chord
Routing
CAN
Credits
Gateway
Reputation
Specification
Figure 5 – Gridlets Economics software architecture
In addition to the three main modules, there are also three more modules that implement the logic that
is horizontal to the model: the routing module, the gateway module and the specification module. The
routing module implements the Chord and CAN routing mechanisms that are used to organize the
nodes and allow them to communicate efficiently. The gateway module provides the mechanisms for
the main modules to use the credit and reputation systems, those systems implementation is
considered to be outside of the scope of the Gridlet Economics, and these modules are intended to
simply provide an interface to those systems. Nevertheless, for simulation proposes we implemented
a simplified version of those systems. The specification module provides the stubs used to create,
39
read and evaluate the specifications that represent the consumer utility and the producer
characteristics. Figure 5 shows the overall software architecture of the Gridlet Economics model
divided into modules and sub-modules.
To simulate and evaluate the model behaviour, it was implemented in Java using PeerSim, a
peer-to-peer simulator. In our implementation each module and sub-module corresponds to a Java
package and sub-package. In this section we describe the functionalities and responsibilities of each
module and how they were implemented. However, due to the large number of classes and methods,
only the most important classes and main method are presented.
4.1 Consumer
The consumer module is used when the user wants to consume the resources of the system.
Therefore its main task is to provide an interface that allows the user, or the gridlet providing layer, to
use the resources of the system. This module is also responsible for getting the utility from the user
and attaching it into the gridlet.
Inside the consumer module there is a controller sub-module, which contains the logic of managing
the submission of jobs into the system. It is this sub-module that sends the gridlet to a broker to be
executed in the system, and afterwards receives the result of its execution. It also interacts with the
gateway sub-modules (reputation and payment) to classify and pay the producer in the end of the
execution. This means that it is also this sub-module that contains the logic to detect misbehaving
producers. The last aspect of this sub-module is the fault tolerance, since this sub-module controls the
execution of the gridlet, it is also the responsible for its resubmission when the search fails, times out
or the execution fails.
Implementation details
Figure 6 shows a diagram with the classes of the consumer package and controller sub-package. The
consumer module has one main class, the ConsumerProtocol, with a method (submitJob) that
receives a job and passes it to the controller to be submitted into the system. For simulation proposes
we also implemented the methods (generateJobs, generateGridlet, generateRequirements) that
generate the Jobs, Gridlets and respective requirements. The UtilityGenerator class helps in this task
by simulating the production of different requirements based on the user preferences.
The ControllerProtocol class also provides the method for submitting jobs, which invokes the
submitGridlet for each gridlet of the job. The submitGridlet method creates the invoice and sends the
gridlet into a broker. It also starts the timer that resubmits the gridlet if the execution receipt is not
received. Since the same node might submit several jobs at the same time, the ControllerProtocol
class stores a collection of Job’s, each with a collection of JobEntry. The JobEntry stores the Gridlet,
the Result (class that represents the execution result) and the cost of the execution. In the end of the
execution, the controller receives the result trough the appropriate method, and can either save or
40
resubmit the gridlet, in the case of a failed execution or search. When all the results are received the
job is closed and the mechanism for detecting overpricing is executed, which marks the JobEntry that
correspond to overpriced execution. Then, depending on the result, the respective payments and
classification are made to the producers.
Consumer
ConsumerProtocol
submitJob (Job job) : Result
generateJob (int n) : Job
generateGridlet () : Gridlet
generateRequirements () : Requirements
UtilityGenerator
1
1 .. *
getUtilyTable () : TreeMap <Double, Double>
1
Controller
1
ControllerProtocol
submitJob (Job job) : Result
submitGridlet (Gridlet gridlet) : void
resubmitGridlet (Gridlet gridlet) : void
receiveResult (Result result) : void
saveResult (Result result) : void
closeJob (Job job) : void
detectOverpricing (Job job) : void
classifyExecutor (Result result) : void
payJob (Job job) : void
Job
1
1 .. *
addEntry (Gridlet gridlet) : void
getEntry (BigInteger gridletID) : JobEntry
getEntries () : Collection<JobEntry>
1
1 .. *
JobEntry
getGridlet () : Gridlet
setResult (Result result) : void
getResult () : Result
Figure 6 – Diagram of the consumer module implementation
4.2 Producer
The producer module is used when the user wants to contribute with resources to the system,
therefore its main responsibility is to request and save the configuration of how that contribution is
made. The configuration consists in the initial fee, the characteristics of the physical machine
(memory, bandwidth, etc), which must include all the characteristics of the unit of cost, and the
programs installed or that the user allows to be used. If the variable price policy is used, it also
includes the frequency in which the system occupation is sampled and the step used to update the
price. The producer module is also responsible for classifying the consumer at the end of the
transactions and storing the result of an execution temporarily, when the consumer that submitted the
gridlet is not available to receive it.
41
The advertiser sub-module is responsible for advertising the node availability to execute gridlets. To
do so, it registers itself in the market square by sending a registration message to a broker with its
chord ID and characteristics, which correspond to the configuration stored on the producer module.
While it is registered in the market square, this sub-module is responsible for renewing the lease
associated to this entry. If the variable price policy is used, the advertiser sub-module also analyses
the market status using the market analysis service provided by the brokers, and decides if it should
change or not the fee that is being asked, then it sends the corresponding update message to a
broker.
The executor sub-module is responsible for the execution of the gridlets received from the other users
of the system. It prepares the data required for the execution, invokes the execution command and
creates a message with the result that is sent to the node that submitted the gridlet. During execution,
this sub-module monitors the resources used and in the end sends the bill to the consumer, using the
appropriate service of the credit system.
Implementation details
In Figure 7 is presented the diagram of the Producer module implementation which consists in the
Producer package with the sub-packages Advertiser and Executor. The producer package main class
is the ProducerProtocol, that stores in a central place the nodes’ characteristics and brokerID that
stores the node index entry, information that is used by the executor and advertiser. When an invoice
is paid by the consumer, the payment system calls the endTransaction method, which classifies the
consumer and closes the invoice. If the producer is not present in the system, it completes all the
pending transactions when it re-enters the system. The ResultKeeper class stores the result of an
execution temporarily for a consumer and updates the invoice with the amount and time that the result
was stored.
The AdvertiserProtocol class uses the publishAvailability method to send a message to the broker with
its characteristics and implements a timer to control the index entry lease renewal. With the variable
price policy the updatePrice method is invoked to calculate the new fee that the producer will ask and
then it is used the updateAvailability method to send the corresponding message to the broker.
The ExecutorProtocol class receives the gridlets to be executed through the method executeGridlet, in
which the brokerID corresponds to the ID of the broker that is monitoring the gridlet execution. The
node stores the Gridlet waiting to be executed in a sorted list of QueueEntry, where the first in is the
first out (FIFO). The backups are also stored in this list, this way they also maintain the execution
order. However, they are not selected until they are activated through the executeBackup method.
When the execution of a gridlet is completed, the class uses the calculatePrice method to calculate
how much it will cost, updates the invoice and sends the result to the consumer. Also, it notifies the
broker that is monitoring the execution and the broker that stores its index entry.
42
Producer
ProducerProtocol
ResultKeeper
1
getSpecs () : Characteristics
isLeaving () : Boolean
getBrokerID () : BigInteger
1
addResult (Result result) : void
addResults (Collection<Result> results) : void
removeResult (BigInteger gridletID)
endTransaction (Invoice invoice) : void
endPedingTransactions () : void
1
classifyConsumer (Invoice invoice) : void
Advertiser
1
AdvertiserProtocol
1
publishAvailability () : void
renewLease () : void
updatePrice () : void
updateAvailability (double oldPrice) : void
Executor
1
ExecutorProtocol
executeGridlet (Gridlet gridlet, BigInteger brokerID) : void
runGridlet (QueueEntry entry) : void
endGridletExecution () : void
selectNextExecution () : QueueEntry
notifyBroker (BigInteger brokerID) : void
calculatePrice (QueueEntry entry) : void
sendToConsumer (Result result) : void
storeBakcup (Gridlet gridlet, BigInteger brokerID) : void
executeBackup (BigInteger gridletID)
discardBackup () : void
hasGridlet (BigInteger gridletID) : Boolean
1
1 .. *
QueuEntry
getGridlet () : Gridlet
getBrokerID () : BigInteger
getFee () : double
getOrder () : int
isToExecute () : Boolean
markToExecute () : void
Figure 7 - Diagram of the producer module implementation
4.3 Brokers
The broker module main functionalities are to maintain the market square, a distributed index that is
used to distribute the gridlets across the available resources, and monitor the gridlets while they are
being executed by the producer. This module also provides the market analysis service used by the
consumer and producers to check the status of the system and implements the logic that determines
whether the node should be a broker. Or in case the broker selection is being used, if it should be a
redirector. Moreover, it coordinates with the CAN module and the broker module of the other nodes to
implement the protocol necessary to traverse requests throughout the distributed index.
43
Broker
BrokerProtocol
MarketAnalysis
1
shouldBeBroker () : Boolean
isActive () : Boolean
1
receiveEntry (Message message) : void
createEntry (Message message) : void
updateEntry (Message message) : void
renewLease (Message message) : void
BrokerSelector
1
startSearchInTheIndex
(Gridlet gridlet) : void
getFullMarketAnalysis
(Characteristics specs) : void
getLocalMarketAnalysis
(Characteristics specs) : void
1
addPointer (BigInteger brokerID) : void
redirectMessage (Message message) : void
createNewBroker () : void
splitIndex() : void
1
1
Indexer
IndexMonitor
IndexSelector
addLease (BigInteger ID) : void
renewLease (BigInteger ID) : void
checkLease (BigInteger ID) : void
localSearch () : SearchResult
neighbourSearch () : SearchResult
conditionedLocalSearch () : SearchResult
1
1
1
IndexProtocol
1
writeEntry (Message message) : void
removeEntry (BigInteger producerID) : void
1 .. *
searchInTheIndex (Gridlet gridlet) : void
sendToExecute (Gridlet gridlet, BigInteger executorID) : void
continueSearch (Gridlet gridlet, BigInteger neighbourID) : void
notifySearchFail (Gridlet gridlet) : void
1
1
1 .. *
1
1 .. *
IndexEntry
NeighbourEntry
getID () : BigInteger
getSpecs () : Characteristics
getNode () : node
getSpecs () : Characteristics
Monitor
MonitorProtocol
1 .. *
monitorExecution (Gridlet gridlet) : void
sendToBackup (Gridlet gridlet) : void
checkExecution () : void
activateBackup (BigInteger gridletID) : void
MonitorEntry
1
1 .. *
getExecutor () : BigInteger
getBackup () : BigInteger
Figure 8 - Diagram of the broker module implementation
44
The index sub-module implements the distributed index which has an entry for each producer that is
available to execute gridlets. Each entry stores the produced Chord ID, its characteristics and a lease
with the expiration date. In order to control the expiration time of the entries, the sub-module
implements a scheduler that periodically checks if the lease of the entry has expired and, if so, deletes
it. The index sub-module also stores in a separate structure an entry for each of its neighbours in the
CAN coordinate space. These entries have a pointer to the neighbour and the estimation of the values
that are stored in the part of the index that belongs to that neighbour, which is necessary to perform
the neighbour search. In our implementation it is used the average value of the entries in that part of
the index. These entries never expire and are also updated periodically by the scheduler. The index
sub-module is also responsible for the logic of the search in the index, which uses the specification
module to calculate the utility of the entries in the index and the neighbour entries.
The monitoring sub-module is responsible for the fault tolerance mechanism during the execution of a
gridlet. This sub-module stores the information about the node that is executing the gridlet and where
the backups are stored. It periodically pings the node that is executing the gridlet and if it detects that it
failed instructs one of the backups to start the execution.
Implementation details
The Broker module is implemented in the Broker package that contains the Indexer and Monitor subpackage, as shown in Figure 8. The main class of the package, the BrokerProtocol, determines if the
node should be a broker and, if so, calls the methods of the CAN module to enter the CAN coordinate
space and the method splitIndex to receive the part of the distributed index for which it is responsible.
Also, this class receives the messages sent by the controller to execute a gridlet and the advertiser to
create/update an entry, then it uses the CAN routing mechanism to route them to the appropriate
broker and only afterwards passes them to the respective indexer. The MarketAnalysis class provides
the method for a local market analysis and full market analysis, the last requires the class to know who
are the neighbours in the CAN coordinate space. The BrokerSelector class implements the logic of the
broker selection mechanism.
In our implementation, the IndexProtocol class implements the distributed index through a sorted map
that stores the IndexEntry order by the fee. This allowed a faster filtering of the entries considered for
the search when is defined a limit for the fee. Nevertheless, other implementations can be used. The
class also stores a collection of NeighbourEntry with the neighbour node and its characteristics. Due
to the relatively small number of neighbours and the high number of interactions, the brokers
communicate directly with their neighbours without using the DHT. In the Indexer package there are
two more classes: the IndexMonitor class, that monitors the leases associated with the index entries;
and the IndexSelector class, that implements the search in the index algorithm described in section
3.2.2. The conditionLocalSearch is used with the mechanism that offers different quality of service
depending on the user class.
45
The Monitor package contains the MonitorProtocol class which monitors the gridlets execution. For
that propose, it stores a collection of MonitorEntry, each one with the ID of the node that is executing
the gridlet, the IDs of the nodes having a backup, and when the execution started. It also implements
a timer that periodically invokes the method that checks the execution of the gridlets.
4.4 Routing
The Routing module implements the Chord and CAN distributed hash tables that are used in the
Gridlet Economic model to organize the nodes and provide an efficient communication mechanism.
This chapter only provides a brief description of the features implemented, in order to get a complete
description of its details we refer to the Chord [36] and CAN [29] papers.
The Chord is the main routing mechanism of the system, it is used to organize all the nodes and most
communications. This sub-module implements all the methods required for the creation of the Chord
ring and the operations required to maintain it, such as entering, leaving and fault tolerance. The submodule also provides a unique ID that is used to identify the node and a mechanism to traverse
through the ring, more specifically the methods to find the node responsible for a specific key or to
send a message to it.
The CAN sub-module provides the implementation of the DHT that it is used by the brokers to
distribute the market square. The coordinate space implemented by this sub-module is non-circular,
which means that it is not possible to travel from the upper limit to the lower limit and that its
dimensions have the same upper and lower limit of the characteristics of the unit of cost to which they
correspond. The sub-module supplies all the methods necessary to create and maintain the
coordinate space and provide information about it, such as, who are the neighbours of a node, and
which sub-space the broker is responsible for.
Implementation details
In figure 9 are presented both the Chord and CAN packages with the respective classes, with the API
that they must provide to allow the model to operate. The Chord protocol is mainly used for the node
organization, therefore it is only required that it provides the ID to uniquely identify the node (getID)
and a method (findSucessor) to efficiently locate it. Additionally, a method to send a message to that
node can be used.
The CAN protocol is used by the brokers to create a distributed index over its coordinate space. In
order to be able to send messages and perform searches through the index the CAN must provide the
methods to find a zone to which a given coordinate belongs to (findZone and belongsToZone). It is
also necessary an auxiliary function that converts the Characteristics used to represent the
specification of the nodes into a set of coordinates (createCoordinate), this method does not have to
be provided by the CAN. To allow the brokers’ operations, the CAN protocol also has to make
available the methods to get the zone limits and the neighbours of that zone.
46
Routing
Chord
ChordProtocol
getID () : BigInteger
findSucessor (BigInteger key) : node
CAN
CANProtocol
createCoordinate (Characteristics specs) : Coordinate
findZone (Coordinate coord) : node
belongsToZone (Coordinate coord) : Boolean
getZoneMin (int dim) : double
getZoneMax (int dim) : double
getNeighbours () : ArrayList<Node>
Figure 9 - Diagram of the routing module implementation
4.5 Gateway
The Gateway module makes the bridge between the Gridlet Economics and two systems (credits and
reputation), whose implementation was considered to be outside of the scope of this work.
Nevertheless, due to its importance to the model, in the architecture there are two sub-modules, one
for each, reserved for these systems. The sub-modules can either contain the full implementation of
the system or just a stub that acts as gateway between the model and the system.
The credits sub-module is responsible for the storage and management of the credits that each user
has. For the model to work, it is required that the credit system has the concept of a transaction, which
is started by the creation of an invoice to which the values charged are added, and that in the end it is
paid. The credit system must also provide an interface to check the amount of money of each node
and the average cost paid in the transactions, a value which is used to calculate the deposits.
The reputation sub-module manages the reputation of the nodes in the system, this means that it
stores and calculates the reputation value of each node. The sub-module must provide an interface to
verify one user reputation and give him a classification of its behaviour in a transaction. It is also
expected that this system is resilient to Sybil attacks, and values more highly the most recent
classification, in order to prevent a node from profiting from gaining and milking the reputation.
47
Moreover, if the user classes are used, it is this sub-module that identifies and manages the users
from the different classes.
Implementation details
Figure 10 shows the Gateway package with the classes necessary to implement the basic
functionalities of those systems. In this implementation both the Reputation and Payment sub-package
implements the method to verify if the node already has an Account and if it does not have to create
one. The information about the Accounts of each user is stored in a collection of entries that belong to
the Protocol class.
Gateway
Reputation
ReputationProtocol
createAccount (BigInteger chordID) : void
hasAccount (BigInteger chordID) : Boolean
1
1 .. *
ReputationEntry
getReputation (BigInteger chordID) : double
getReputation () : double
giveClassification (BigInteger giver,
BigInteger receiver, Boolean good) : void
addClassification
(double value) : void
Payment
PaymentProtocol
createAccount (BigInteger chordID) : void
hasAccount (BigInteger chordID) : Boolean
1
createInvoice (BigInteger gridletID, BigInteger consumerID) : BigInteger
payInvoice (BigInteger invoiceID, double value) : void
getInvoice (BigInteger invoiceID) : Invoice
1 .. *
1
PaymentEntry
1 .. *
getAmount () : double
deposit (double value) : void
withdraw (double value) : void
Invoice
getValue () : double
getConsumerId () : BigInteger
getProducerId () : BigInteger
Figure 10 - Diagram of the gateway module implementation
48
In the reputation module the consumers and producers classify each other using the method
giveClassification, which receives as parameters the Chord ID of the node that is giving the
classification, as well as the ID of the node that is receiving it. The ID of the giver node is necessary
because its reputation and the number of classifications that it has received influence the importance
that is given to its classification.
The Payment package also implements the Invoice class which represents the concept of a
transaction. The transaction starts when the consumer creates the invoice, then during the transaction
the brokers and producer get the invoice with the appropriate method and attach to it their ID and
value charged for their services. In the end, the consumer pays the invoice and the PaymentProtocol
class makes the respective withdraw and deposits.
4.6 Specification
The Specification module provides the methods necessary to use the mechanism described in section
3.1.2 to represent the producer characteristics and the consumer requirements for the gridlet
execution. This module also evaluates the utility of a set of characteristics according to the
requirements defined.
The characteristics and requirements representation is done in two different forms, the XML
representation and an internal representation in programming language, e.g. Java. The XML
representation which is used in communications is describe and exemplified in the section 3.1.2. The
internal representation of the characteristics of the producer consists in a table that maps the resource
tag to its value. The internal representation of consumer requirements is more complex and consists in
the maximum or minimum values that must be satisfied, the partial utility of each resource, its weight
and how the partial utility is combined to calculate the utility of a set of characteristics. The maximum
or minimum values and weight are each represented with a table that maps the resources tag to the
value that must be satisfied. The partial utility consists in a table that maps resource tags to a sorted
list that has the minimum values that must be fulfilled to the utility that it represents. How to combine
the partial utility is represented in a tree structured where the leaf nodes are the resources tag, and
the node intermediate nodes have the operator that is used to combine the utility of the child nodes.
The module also provides the methods to convert the XML to the internal representation and from the
internal to XML representation. And make available the process to evaluate the utility of the nodes
according to a set of requirements.
Implementation details
Figure 11 shows the classes implemented in the Specification package. The characteristics and
requirements are implemented by the classes with the respective name. The XMLStub class provides
the method to convert those classes into XML documents and vice-versa. The Operators classes
represent how the resources are combined. Both classes implement the Operator interface and the
49
Operatornode has pointers to two other operators, therefore they can be combined in a binary tree
structure.
The evaluation of the characteristics is made by the Evaluater class, which is constructed using a
requirement. It consists in three steps: first, it is verified if the characteristics all fulfil the minimum and
maximum requirements specified. Then, the utility SortedMap is applied to resource tags available to
calculate the partial utility of that resource and multiplied by its weight. For a resource that is not
specified the partial result is 0. The last step is to calculate the utility by combining the partial utility
using the operators. This is done by recursively evaluating the OperatorNodes until the OperatorLeaf
are reached, and then combining them accordingly to the logical operator of the node. If the operators
are not specified, by default is used the and logical operator.
Specification
Characteristics
Evaluater
evaluate (Characteristics specs) : double
getNames () : Collection<String>
getCharacteristic (String name) : double
Requirements
XMLStub
getMaximun (String name) : double
getMinimum (String name) : double
getUtility (String name):SortedMap<double, double>
getWeigth (Sting name) : double
createDocument (Characteristics specs)
: XMLDocument
createDocument (Requirements req) :
XMLDocument
getOperators () : Operator
createCharacteritic (XMLDocument doc)
: Characteristics
createRequirement (XMLDocument doc)
: Requirements
Operator <Interface>
isLeaf () : Boolean
OperatorNode
isLeaf () : Boolean
getOperator () : int
OperatorLeaf
isLeaf () : Boolean
getName () : String
Figure 11 - Diagram of the specification module implementation
50
5 Simulation and Evaluation
In this section, we describe the evaluation made on the model to assess its capability to manage the
resources of a peer-to-peer cycle-sharing system, while providing incentives to contribution and
dealing with a heterogeneous population. In order to execute the evaluation we implemented the
model in Java using a peer-to-peer simulator, PeerSim. The general characteristics of this
environment are described in section 5.1.
The evaluation is divided into four main groups: resource management, credit system, reputation
system and model scalability. The first group (section 5.2) evaluates if the model is able to distribute
work effectively across the available resources, operate in the presence of faults and how well the
user utility is fulfilled. In the credit system group (section 5.3), we test if the economic model is viable
and measure the benefits of the variable price policy. In the reputation system group (section 5.4) we
evaluate the ability of the model to isolate misbehaving nodes and provide different quality of service
depending on the user class. In the final group (section 5.5) we test if the model is able to scale while
maintaining its ability to distribute work effectively across the available resources.
5.1 Simulation details
The model was implemented on Java using the PeerSim, a peer-to-peer simulator, and since this
simulator is not distributed, all the executions were made in a single machine. In the PeerSim it was
used the event driven simulation where the nodes communicate using events. In table 2 are presented
the general characteristics that define the simulation environment, which are common to all the tests
scenarios.
Characteristics
Value
Nodes
100.000
Chord ID
90 bits
Broker Predefined set
25
Multiples of 10
Brokers
123
Initial credits
5.000
Job size
20 Gridlets
Table 2 – General characteristics of the simulation environment
The simulation environment consists of 100.000 nodes, from which 123 brokers are brokers. The unit
of cost consists in the fee and five physical characteristics: CPU speed, number of cores, memory
size, upload and download bandwidth. The units and limits of each characteristic are showed in
Table 3. Two other characteristics are also taken into account, the occupation and reputation.
51
The nodes of the system have different characteristics, which match and are limited by the
characteristics of the unit of cost. Those characteristics or criteria are generated randomly and follow a
normal distribution, with the restriction that if one of the characteristics is high, then all of them are
high. This is done because normally if a computer has a fast processor it also has a lot of memory
space.
In the beginning of all simulations, all the nodes start with 5 000 credits. This is done so that they can
pay for the jobs that they are assigned to submit into the system, and avoid the long initial bootstrap
time required if the credits were solely spread through transactions. Each job consists of 20 Gridlets
and is submitted into the system by a consumer selected randomly. All the Gridlets have the same
size and the duration and cost of its execution is calculated in function of the executor characteristics,
which means that the higher the value of the characteristics the less time the execution will take, and
the more it will cost. The time unit used to monitor the time is the tick, which is marked by PeerSim.
Name
Unit
Minimum
Maximum
Fee
credit
1
100
CPU speed
MHz
1000
5000
n. of cores
-
1
8
memory size
MB
500
8000
upload
MB/s
1
100
download
MB/s
1
100
Table 3 – Characteristics of the unit of cost
5.2 Resource management
The main propose of this model is to manage the resources of a peer-to-peer cycle-sharing system, so
in this section, we tested if it is able to distribute the jobs effectively across the resources available.
Next, since in peer-to-peer systems the populations are often transient and leave suddenly, either by
decision of the user or due to crash, it was evaluated the impact that churn has on the system ability to
execute jobs. The last aspect analyzed was how well the model is able to satisfy the user utility.
5.2.1
Job Distribution
On important feature of a resource management mechanism is the ability to distribute jobs across all
the available resources, thus achieving a full occupation. The main aspect that affects the ability of the
model to occupy all the resources of the system is the weight that is given to the occupation
characteristic, since it is what determines the priority of the idle producers. So, it was tested how the
system reacted to different weights to the occupation, while being flooded with a number of gridlets
that exceeds its overall capacity.
In this test we made 2 executions, with the weight given to the occupation of 1 and 5, where 400.000
gridlets were quickly inserted into the system, which is four times the system overall capability.
52
Figure 12 shows the percentage of nodes occupied of the system over time. In the execution where
the weight given to the occupation was of 1, the same weight and therefore priority as the other
characteristics, the model was only able to occupy 67% of the nodes. However, with the occupation
weight of 5, which corresponds to the weight of the other characteristics combined, the model was
able to fully occupy system. So, we can conclude that, as long as the users give a high priority to the
less occupied nodes in the preferences that they specify as consumers, the system is able to
distribute the load evenly across all the resources available.
Occupation (%)
Occupation
weight:
Time (ticks)
Figure 12 – System occupation with different weights
for the occupation requirement
5.2.2
Fault tolerance
The populations of peer-to-peer systems are often transient and leave suddenly, either by decision of
the user or due to crash. So, it is important to measure the impact that those departures have on the
ability of the model to execute the gridlets. Since the actual execution of the gridlet by the producer is
the step that takes the longest and has a greater impact when it is dropped, in this test we only
considered nodes faults during that step. In this test it was evaluated how many gridlets the system
was able to execute with different levels of churn and how the backups mitigated that situation.
Figure 13 shows the result of 9 executions with different churn rate and number of backups. The churn
rate corresponds to the percentage of nodes that leave the system during the time that it takes on
average to execute a gridlets and the number of backups corresponds to the number of producers to
which the broker sends a copy of the gridlet. As it can be observed, with a churn rate of 5% and
without the use of backups about 10% of the executions fail, however this impact is almost completely
mitigated by the use of backups. Nevertheless, with a churn rate of 50%, which is a very demanding
scenario, the results are more substantial: without the use of backups, only 65% of the gridlets are
executed successfully, a value that rises over 80% with the use of a single backup and almost reaches
90% with 3 backups.
53
Successful Executions (%)
Number of
backups:
Churn rate
Figure 13 – Percentage of successful executions with
different levels of churn rate
5.2.3
User utility
Another important feature of a resource management mechanism is the ability to select the most
appropriate resources to execute the job depending of its requirements and preferences, which in this
model are represented by the user utility. So, in order to test the ability of the model to satisfy the user
utility, three types of users were created:
•
Balanced: this type of user aims to achieve the best balance between the price paid and
the execution time, therefore it uses the same weight to the fee asked, as to the remaining
characteristics.
•
Performance: this type of user wishes to achieve the fastest execution time possible,
regardless of the fee asked, and thus gives double the weight to the other characteristics
than to the fee.
•
Money: this type of user is the opposite of the performance, it wants to achieve the
cheapest execution possible regardless of the execution time. Therefore the weight of the
fee is the double of the other characteristics.
Figure 14 shows the average price paid and execution time for the three types of users. As it can be
observed, the type of users interested in having their jobs executed in the shortest amount of time
possible, achieving an execution time three times faster than the time it takes for the balanced users.
On the other hand the users which want to save credits pay almost less twenty percent than the
balanced ones, however that comes with an execution time two and half times slower. This
demonstrates that the model selects different types of resources according to the users’ preferences
and fulfilling their specific utility.
54
Credits / Ticks
User type
Figure 14 – Average cost and duration of a job (20 Gridlets)
execution with different user requirements
5.3 Credit system
The model proposed is an economic model, therefore one of its most important components is the
credit system. In this section we test the economic viability of the model by seeing if there was a
balance between the amount paid by a user as a consumer and received as producer. Also we
analyze the ability of the variable price to provide incentives to the contribution in times of greater
demand, and its impacts on the overall system effectiveness.
5.3.1
Economic viability
In order for the economic model to be viable the amount of credits paid by a user to execute a gridlet
in the system, as a consumer, must be similar to the amount received for each gridlet execution as a
producer. If this balanced is not achieved the economic model is not viable because some users will
not be able to gather enough credits to be able to use the system in an acceptable amount of time and
as result will leave the system.
Figure 15 compares the average amount of credits received and paid by the users during two
executions. In the first execution (I) the consumer imposes no limit to the fee charged, but in the
second execution (II) the users impose the limit that the fee charged by the producer selected to
execute the gridlet cannot be 10 credits higher than what they charge as a producer. The users are
divided into classes where A corresponds to the least powerful nodes and E to the most powerful
ones. As it can be seen, in the first execution the value paid is not always proportional to the value
received and the users from the classes A and B have to, respectively, contribute 3 and 2 times more
to be able to use system. This might prevent them from using the system and feel cheated, since the
contribution is not proportional to the benefit. However, in the second execution the amount paid and
55
received by the execution of a gridlet is proportional in every class, thus achieving the balance that
makes the system viable.
Credits
I – Without fee limit
Paid
User type
Credits
II – With fee limit
Paid
User type
Figure 15 – Average value paid and received for a Gridlet execution
for each user type with / without fee limits
5.3.2
Variable price policy
The variable price policy is better than the fixed price, because it changes the fee asked by the
producer according to the variations of the demand and supply, in order provide incentives to
contribution in times of greater demand and usage in times of greater supply.
In order to test it, the producers were divided into two categories, using the fixed price policy and the
variable price policy. Then, we monitored the evolution of the average fee asked, depending on the
occupations of the system, which is the best indicator of the relation between the demand and supply.
Since we consider that the variations in the demand are cyclical (as to simulate a daily periodicity), we
present the results of the extent of two cycles (of 3000 ticks each) where the system was flooded with
gridlets to be executed.
56
Fee (Credit)
Time (ticks)
Figure 16 – Variation of the fee with the variable price policy
depending on the occupation
As it can be seen in Figure 16, the initial fee asked by all the producers is of 50. However, while the
fee of the producers with the fixed price policy remains steady, the fee asked by the producers using
the variable price policy follows the trends of the occupation/utilization of the system. First, it lowers a
little because when simulation starts because the system is empty, but then the average fee is raised
while the system is heavily loaded and lowered when it starts to have many nodes available, meaning
that the offer is higher than the demand. In the end, the producers using the variable priced policy
received on average 59 credits for each execution, almost 10% more than the ones using the fixed
price.
This shows that resource management with our economic model is able to adapt to fluctuations in
supply and demand. And that the variable price policy provides incentives to contribution, because in
greater demand, a premium is awarded to suppliers; with greater supply, an equivalent refund is
awarded to consumers.
On another test, it was measured the impact that the variable price policy has on the overall
effectiveness of the system. So, we made two executions where the consumers used the fee limitation
described in section 5.3.1, using as reference the initial fee asked, and imposed a maximum queue
size of 5. In the first execution (I), the producers used a fixed price and in the second execution (II),
the variable price policy. Table 4 shows the results measured at the end of each execution for the
entire system and for the 10% of the more powerful nodes.
In the first execution, only 74% of the gridlets submitted into the system were executed and the top
10% more powerful nodes just executed 3%; this happens because the fee limitation prevents the
selection of these nodes to execute the jobs from the less powerful nodes, which ask a lower fee.
However, with the variable price policy, when the nodes are idle they lower their fee, which makes
them eligible to execute the gridlets from the nodes less powerful. This can be seen in the second
execution, where the more powerful nodes executed 14% of the gridlets submitted into the system.
Moreover, the total number of gridlets executed increased to 90%. This is a great benefit because, not
57
only more gridlets were successfully executed, they were executed faster by more powerful nodes,
thus increasing the users satisfaction. Also, although the average fee paid to execute each gridlet was
lower, the total amount of credits traded was higher, mainly by the top 10 more powerful nodes which
received 4 times more credits. So, we can conclude that the variable price policy improves the
flexibility, fairness and overall performance of the system.
Execution I
Execution II
Metric
Total
Top 10%
Total
Top 10%
Gridlets Executed
551.376 (74%)
19.910 (3%)
674.073 (90%)
107.440 (14%)
Gridlets Dropped
198.624 (26%)
-
75.927 (10%)
-
Average Fee Paid
43,24
87,54
39,83
67,15
Total traded
23.841.498
1.742.921
26.848.327
7.214.596
Table 4 – System effectiveness with and without
variable price policy
5.4 Reputation System
In this model, the reputation system is used to identify and differentiate the nodes, either based on
their behaviour or class. In this section we tested the ability of the reputation system to isolate the
misbehaving nodes, and thus preventing them from taking benefit from such actions. Also, we
measured the effectiveness of the mechanism that provides different quality of services to different
classes of users.
5.4.1
Misbehaving nodes
In the model the nodes use the reputation system to classify the transactions in order for the system to
be able to detect and isolate the misbehaving nodes. The classification of the transactions is made
automatically by the nodes and we propose a mechanism that tries to detect producers that overprice.
In order to evaluate the effectiveness of the reputation system and classification mechanism we made
a test where 1% of the producers (1000 nodes) committed fraud, 1% practiced overpricing asking
100% more than what the execution had cost, and 1% practiced overpricing asking 50% more. The
percentage of misbehaving nodes is rather small because the mechanism that detects overpricing
relies on the assumption that most users are well behaved. In this test, it was used as threshold twice
the standard deviation, and it was given the same weight to the reputation as to the other
characteristics combined.
58
Gridlet executed \ Nodes
Time (ticks)
Figure 17 – Number of gridlets executed on average by
different types of users
Figure 17 shows the average number of gridlets executed by a node of each type over a period of
10000 ticks, and Table 5 shows the number of misbehaving cases detected during the test. As it can
be seen on the graphic, initially all the producers received gridlets to execute. However, after a short
period of time the nodes that commit fraud and 100% overpricing stop receiving gridlets; this happens
because both cases have a detection rate close to 100% and therefore get a low reputation very fast,
which makes them ineligible to be producers.
On the other hand, the producers that do 50% overpricing continue to receive gridlets, this happens
because the detection mechanism is only able to detect the situation half the times, and on the other
half, they receive a good classification, which counter balances with the bad classification that they
receive when are detected; therefore they maintain an average reputation. Nevertheless, the false
detection rate was of only 0,6%, so the well behave nodes always receive a good classification which
raises their reputation and on the long-term makes them receive more gridlets, as it can already be
seen in Figure 17. So, we can conclude that the detection mechanism and reputation system are able
to isolate or penalize, depending on the severity, the nodes that misbehave, thus mitigating their
impact on the system.
50% Overpricing
100% Overpricing
Fraud
Detected
10.592 (49%)
6.053 (97%)
5.734 (100%)
Undetected
11.153 (51%)
160 (3%)
0 (0%)
Table 5 – Number of misbehave cases detected
59
5.4.2
User classes
The model proposed offer methods to provide different qualities of service depending on user classes,
which is registered in the reputation system. In this section, we present the test made to the method
Duration (ticks)
that blocks the access of the nodes from lower classes when the system reaches a certain occupation.
Time (ticks)
Figure 18 – Average duration of a job (20 Gridlets)
for each user class
In this test we divided the nodes into 3 classes, A, B and C. When the system had an occupation
below 70%, the users from all the classes had access to the full system. When the occupation was
over 70%, the users from class A continued to have access to the full system, the users from class B
only had access to the bottom 80% of the index and the ones from class C to the bottom 60%. The
bottom 80% of the index corresponds to the lower segment of the characteristics that the user wants
to maximizes (ex: CPU speed between 1.000 and 4.200) and to the higher segment of the ones that
should be minimized (ex: fee between 100 and 20).
Class A (100%)
Class B (80%)
Class C (60%)
Cost (Credits)
1.265
1.237
1.252
Duration (Ticks)
1.555
1.779
2.057
Table 6 – Average cost and duration of a Job
for each user class
Figure 18 shows the average duration of a job execution for each class. The initial 1000 ticks are not
shown because there were not enough jobs executed to calculate a stable average. Table 6 shows
the average duration and cost of a job execution measured at the end of the test. Initially all the
classes have access to the full system, which means that they receive the same quality of service and
therefore the duration for job execution is similar. But, as the occupation increases and exceeds 70%,
the duration of the jobs execution for each class becomes very different, and it takes more 30% ticks
60
for the users of class C than to the ones of class A. Also, as it can be seen in Table 6, although the
execution times are different, the average cost is similar, this happens because the nodes from
class A, in addition to having exclusive access to the more powerful producers, also have exclusive
access to the cheaper resources. As a result, we can conclude that the system is able to provide
different quality of services depending on the user class because the nodes from the class A were
able to execute the jobs faster at the same cost.
5.5 Model scalability
Since peer-to-peer systems there is no central point of access that creates a bottleneck and limits the
growth of the system, they usually have the ability to scale very well. This means that they are able to
achieve the same effectiveness with 1.000.000 that they had with only 100.000 nodes. Since the
model proposed is intended to be applied on top of a peer-to-peer system, it is important that it also
has the ability to scale without losing its effectiveness. With this in mind, we repeated the tests made
in section 5.2 (resource management), with 1.000.000 nodes. The tests from the remaining sections
(credit system and reputation system) were not preformed since they depend more on the ability of the
respective systems to scale, which was considered to be outside of the scope of this system, then on
Occupation (%)
the model itself.
Occupation
weight:
Time (ticks)
Figure 19 – System occupation with 1.000.000 nodes
The first test that we made in the resource management section was to determine whether the model
was able to occupy all the available resources of the system. For that, the system was quickly flooded
with 400.000 gridlets, which was 4 times its overall capacity of 100.000 nodes, and it was verified that
when is given a weight of 5 to the occupation the model is able to achieve 100% occupation. In this
test we reproduced the same environment but in order to flood the system with 4 times its capacity,
instead of 400.000 gridlets, 4.000.000 gridlets were quickly inserted into the system. Figure 19 shows
the percentage of nodes occupied in the system over time. As it can be seen, the model was able to
fully occupy all the resources available in the system, achieving a 100% occupation. Moreover,
considering that the results obtained in this test with 1.000.000 nodes were very similar to the ones
61
obtained in section 5.2.1 with 100.000 nodes, we can conclude that the number of nodes in the
system had no impact on its ability to distribute the load evenly across the available resources.
In section 5.2.2, we tested whether the model was able to operate in the presence of faults and
unannounced departures during the execution of a gridlet. For that we performed 9 executions with
different churn rates and number of backups. We repeated those tests with 1.000.000 nodes and
present the results in Figure 20. As it can be observed, with a churn rate of 5% and 25% the results
are very similar to the ones obtained with 100.000 nodes, there is only a slight decrease in the
percentage of successful executions with and without backup that can be considered negligible. But,
as it happened before, the results with 50% of churn are more expressive, in this case the percentage
of successful executions without backup dropped almost 10 points and stayed below 60%.
Nevertheless, although there was also a drop in number of successful executions with one backup, as
it happened in the other test, the fault tolerance mechanism was able to keep that value above the
80%. And with the use of 3 backups, the values almost did not change between the executions with
100.000 and 1.000.000 nodes. So, since the number of successful executions has decreased only
slightly with the lower churn rates, and that with very demanding churn rates the use of backups still is
able to achieve goods success rates, we can conclude that the fault tolerance mechanism is also able
Successful Executions (%)
to scale very well.
Number of
backups:
Churn rate
Figure 20 – Percentage of successful executions with 1.000.000 nodes
The last test made in the resource management section was to evaluate the model ability to satisfy the
users’ utility. In order to test it, in section 5.2.3 we created 3 different types of users: balanced,
performance and money. As it is explained in that section each type of user has specific utility
preferences and objectives. Figure 21 shows the result of the execution with 1.000.000 nodes. As it
can be observed the results are very similar to the ones obtained before. The balanced users have a
slight increase in the duration of the job, but mainly maintain the same results. For the other users,
there is a slight decrease in the duration of a job execution for the performance users, and also a
small decrease in the cost of an execution for the money users, with the corresponding increase in
cost or duration. This can be related to the fact that since there are more nodes, there are also more
62
very powerful nodes and very cheap nodes. Nevertheless, the overall results are almost the same has
the ones presented in section 5.2.3, therefore we can conclude that the number of nodes in the
Credits / Ticks
system has no impact on the model ability to satisfy the user utility.
User type
Figure 21 – Average cost and duration of a job with 1.000.000 nodes
To test the model ability to scale in this section we repeated the tests executed in section 5.2
(resource management) using 10 times more nodes than before, 1.000.000 nodes instead of 100.000
nodes used in the first tests. Seeing as in all the tests the results were very similar to the ones
obtained in section 5.2, we are able to conclude that the number of nodes did not prevent the model
from maintaining its functionality. On the overall, we can claim that the model is able to scale and
therefore does not limit the number of nodes that the peer-to-peer cycle-sharing system can support.
63
6 Conclusion
Over time the home computers were able to provide a greater computation power at a cheaper price.
When connected through a high speed network these computers have the potential of providing a
bigger computational power than the supercomputers. Some systems, such as Grids and BOINC
appeared to take advantages of this potential, but they did not allow home users to also benefit from it.
In the P2P system all the component perform the same roles, acting simultaneously as client and
server, which mean that the users which contribute can also use the resource of the system. However,
most of the research in peer-to-peer system has been focus on file-sharing and less attention has
been given to other types, such as cycle-sharing.
Some aspects of the peer-to-peer cycle-sharing systems are common to the Grids, BOINC or P2P filesharing. However, due to its specific requirements, other such as the resource management
mechanism cannot be reused. With this problem in mind, in this work we proposed an economic
model capable of managing the resources of a P2P cycle-sharing system.
In our system the users make their idle resources available to the other users, so that they can
execute gridlets (small and independent work units) in them. The model that we proposed is able to
select from the pool of all the resources available the most suitable to execute the gridlet. This
selection is made automatically without the need of a central third party or a node with the information
about the entire system. Moreover, the choice of the node that is going to execute the gridlet is able to
take into consideration the specification (requirements and preferences) defined by the user that
submitted the gridlet. The mechanism that represents and evaluates the user specification is capable
of dealing with multiple distinct requirements, such as CPU speed or Memory size. Also, it is able to
deal with binary requirements, which either are fulfilled or not, and with requirements that can be
partially fulfilled.
Since this is an economic model the resources are traded for credits, the currency of a virtual money
system, in commercial transactions. This means that when a user has a gridlet executed on the
resources of the system, which belong to another user, the user that submitted the gridlet pays the
owner of the resources for its usage. Since it is hard to determine how much resources will be used
during an execution beforehand, the value paid is calculated by multiplying a fee for the amount of
resources consumed. The use of an economic model regulates the contribution and consumption
made by each used, since the user has to contribute to the system to earn the credits that he needs to
pay for the consumption of resources of the system. Also, in this work we propose a variable price
policy where the fee asked is defined dynamically according to the demand / supply ratio. This policy
provides incentives to the contribution in times of lesser supply and the consumption in times of lesser
demand by increasing and decreasing the value of the fee asked.
However, the use of an economic model also carries the risk that one participant in the transaction
tries to take advantage of the other. In order to mitigate that risk the model presented uses a
65
reputation system that helps identifying and isolate the misbehaving nodes from the system. It is also
provided a mechanism that is able to automatically detect and identify the nodes that commit
overpricing or fraud, thus preventing them from harming the system.
Since the population of peer-to-peer system is normally transient and heterogeneous, in this work we
also present mechanisms that allow the system to tolerate unannounced departures and provide
different quality of service to different types users.
The model ability to manage resources of a peer-to-peer cycle system sharing was successfully tested
in simulation, achieving good results in capability to distribute gridlets across all the available
resources, operate in the presence of faults and respect the users preferences. It was evaluated the
viability of the economic model and its effectiveness to provide incentives to contribution in times
lesser supply. Also, it was tested if the reputation system was able to mitigate the risk by identifying
the misbehaving nodes.
66
References
1. D. Abramson, R. Buyya, and J. Giddy. A computational economy for grid computing and its
implementation in the Nimrod-G resource broker. Future Generation Computer Systems,
18(8):1061–1074. 2002.
2. K.G. Anagnostakis and M.B. Greenwald. Exchange-based incentive mechanisms for peer-to-peer
file sharing. Proceedings of the 24th International Conference on Distributed Computing
(ICDCS04). 2004.
3. D.P. Anderson, J. Cobb, E. Korpela, M. Lebofsky, and D. Werthimer. SETI@ home: an
experiment in public-resource computing. Communications of the ACM, 45(11):61. 2002.
4. N. Andrade, M. Mowbray, A. Lima, G. Wagner, and M. Ripeanu. Influences on cooperation in
bittorrent communities. Proceedings of the 2005 ACM SIGCOMM workshop on Economics of peerto-peer systems, page 115. ACM. 2005.
5. S. Androutsellis-Theotokis and D. Spinellis. A survey of peer-to-peer content distribution
technologies. ACM Computing Surveys (CSUR), 36(4):371. 2004.
6. A. Andrzejak and Z. Xu. Scalable, efficient range queries for grid information services.
Proceedings of the Second IEEE International Conference on Peer-to-Peer Computing (P2P2002).
2002.
7. C. Buragohain, D. Agrawal, and S. Suri. A game theoretic framework for incentives in P2P
systems. Proceedings of the 3rd International Conference on Peer-to-Peer Computing, page 48.
IEEE Computer Society. 2003.
8. R. Buyya, H. Stockinger, J. Giddy, and D. Abramson. Economic models for management of
resources in grid computing. Technical Track on Commercial Applications for High-Performance
Computing, SPIE International Symposium on The Convergence of Information Technologies and
Communications (ITCom 2001). 2001.
9. R. Buyya and S. Vazhkudai. Compute power market: Towards a marketoriented grid. In The First
IEEE/ACM International Symposium on Cluster Computing and the Grid (CCGrid 2001). 2001.
10. L.G.L.M. Carlo, E.T.O. Felipe, and M.G. França. The Use of Reciprocal Trade as a Model of
Sharing Resources in P2P Networks. Proceedings of the 2009 Fifth International Conference on
Networking and Services-Volume 00, pages 91–96. IEEE. 2009.
11. A. Cheng and E. Friedman. Sybilproof reputation mechanisms. Proceedings of the 2005 ACM
SIGCOMM workshop on Economics of peer-to-peer systems, page 132. ACM. 2005.
12. Y. Chou, C. Lee, and J. Chung. Understanding m-commerce payment systems through the
analytic hierarchy process. Journal of Business Research, 57(12):1423–1430. 2004.
13. B. Chun, Y. Fu, and A. Vahdat. Bootstrapping a distributed computational economy with peer-topeer bartering. Proceedings of the 1st Workshop on Economics of Peer-to-Peer Systems. 2003.
14. B.N. Chun, P. Buonadonna, A. AuYoung, C. Ng, D.C. Parkes, J. Shneidman, A.C. Snoeren,
and A. Vahdat. Mirage: A microeconomic resource allocation system for sensornet testbeds.
Proceedings of the 2nd IEEE workshop on Embedded Networked Sensors, pages 19–28. 2005.
15. C. Dellarocas. Analyzing the economic efficiency of eBay-like online reputation reporting
mechanisms. Proceedings of the 3rd ACM Conference on Electronic Commerce, pages 171–179.
ACM New York, NY, USA. 2001.
16. S. Esteves, L. Veiga, P. Ferreira. GridP2P: Resource Usage in Grids and Peer-to-Peer. Seventh
High-Performance Grid Computing Workshop. 2010.
17. M. Gupta, P. Judge, and M. Ammar. A reputation system for peer-to-peer networks. Proceedings
of the 13th international workshop on Network and operating systems support for digital audio and
video, pages 144–152. ACM New York, NY, USA. 2003.
18. R. Gupta and A.K. Somani. Compup2p: An architecture for sharing of computing resources in
peer-to-peer networks with selfish nodes. Second workshop on the Economics of Peer-to-Peer
systems. 2004.
19. A. Iamnitchi, I.T. Foster. A Peer-to-Peer approach to resource location in Grid environments.
Proceedings of the 11th Symposium on High Performance Distributed Computing. 2003.
20. D. Irwin, J. Chase, L. Grit, and A. Yumerefendi. Self-recharging virtual currency. Proceedings of
the 2005 ACM SIGCOMM workshop on Economics of peer-to-peer systems, page 98. ACM. 2005.
67
21. R. Jurca and B. Faltings. Reputation-based pricing of P2P services. Proceedings of the 2005
ACM SIGCOMM workshop on Economics of peer-to-peer systems, pages 144–149. ACM New
York, NY, USA. 2005.
22. S.D. Kamvar, M.T. Schlosser, and H. Garcia-Molina. The eigentrust algorithm for reputation
management in p2p networks. Proceedings of the 12th international conference on World Wide
Web, pages 640–651. ACM New York, NY, USA. 2003.
23. N. Liebau, V. Darlagiannis, A. Mauthe, and R. Steinmetz. Token-based accounting for p2psystems. Proceeding of Kommunikation in Verteilten Systemen KiVS, pages 16–28. Springer.
2005.
24. Q. Lv, P. Cao, E. Cohen, K. Li, and S. Shenker. Search and replication in unstructured peer-topeer networks. Proceedings of the 16th international conference on Supercomputing, pages 84–95.
ACM New York, NY, USA. 2002.
25. R.J. Mann. Regulating Internet Payment Intermediaries. Proceedings of the 5th international
conference on Electronic commerce, pages 376–386. ACM New York, NY, USA. 2003.
26. S. Marti and H. Garcia-Molina. Limited reputation sharing in P2P systems. Proceedings of the 5th
ACM conference on Electronic commerce, pages 91–101. ACM New York, NY, USA. 2004.
27. J. Morais, J. Silva, P. Ferreira and L. Veiga. Transparent Adaptation of e-Science Applications
for Parallel and Cycle-Sharing Infrastructures. 11th International IFIP Conference on Distributed
Applications and Interoperable Systems (DAIS). 2011.
28. C. Ng, P. Buonadonna, B.N. Chun, A.C. Snoeren, and A. Vahdat. Addressing strategic behavior
in a deployed microeconomic resource allocator. Proceedings of the 2005 ACM SIGCOMM
workshop on Economics of peer-to-peer systems, page 104. ACM. 2005.
29. S. Ratnasamy, P. Francis, M. Handley, R. Karp, and S. Schenker. A scalable contentaddressable network. Proceedings of the 2001 conference on Applications, technologies,
architectures, and protocols for computer communications, page 172. ACM. 2001.
30. D. Rolli, M. Conrad, D. Neumann, and C. Sorge. An asynchronous and secure ascending peerto-peer auction. Proceedings of the 2005 ACM SIGCOMM workshop on Economics of peer-to-peer
systems, page 110. ACM. 2005.
31. A. Rowstron and P. Druschel. Pastry: Scalable, distributed object location and routing for largescale peer-to-peer systems. IFIP/ACM International Conference on Distributed Systems Platforms
(Middleware), volume 11, pages 329–350. 2001.
32. C. Schmidt and M. Parashar. Flexible information discovery in decentralized distributed systems.
Proceedings of the 12th IEEE International Symposium on High Performance Distributed
Computing, page 226. 2003.
33. M.R. Shirts, C.D. Snow, E.J. Sorin, and B. Zagrovic. Atomistic protein folding simulations on the
submillisecond time scale using worldwide distributed computing. Biopolymers, 68:91–109. 2003.
34. J. Silva, P. Ferreira, and L. Veiga. Service and Resource Discovery in Cycle Sharing
Environments with an Utility Algebra. 24th IEEE International Parallel & Distributed Processing
Symposium. 2010.
35. D. Spence and T. Harris. Xenosearch: Distributed resource discovery in the xenoserver open
platform. Proceedings of HPDC, pages 216–225. IEEE Computer Society. 2003.
36. I. Stoica, R. Morris, D. Karger, M.F. Kaashoek, and H. Balakrishnan. Chord: A scalable peerto-peer lookup service for internet applications. Proceedings of the 2001 conference on
Applications, technologies, architectures, and protocols for computer communications, page 160.
ACM. 2001.
37. P. Trunfio, D. Talia, H. Papadakis, P. Fragopoulou, M. Mordacchini, M.Pennanen, K. Popov,
V. Vlassov, S. Haridi. Peer-to-Peer resource discovery in Grids: Models and systems. Future
Generation Computer Systems, Volume 23, Issue 7. 2007.
38. D.A. Turner and K.W. Ross. A lightweight currency paradigm for the P2P resource market.
Proceedings of the 7th International Conference on Electronic Commerce Research. 2004.
39. L. Veiga, R. Rodrigues, and P. Ferreira. GiGi: An Ocean of Gridlets on a “Grid-for-the-Masses”.
Proceedings of the Seventh IEEE International Symposium on Cluster Computing and the Grid,
pages 783–788. IEEE Computer Society. 2007.
40. V. Vishnumurthy, S. Chandrakumar, and E.G. Sirer. Karma: A secure economic framework for
peer-to-peer resource sharing. Workshop on Economics of Peer-to-Peer Systems. 2003.
41. R. Wang. Bargaining versus posted-price selling. European Economic Review, 39(9):1747–1764.
1995.
68
42. L. Xiong and L. Liu. Building trust in decentralized peer-to-peer electronic communities. Fifth
International Conference on Electronic Commerce Research (ICECR-5). 2002.
43. B. Yu and M.P. Singh. Incentive mechanisms for peer-to-peer systems. Agents and peer-to-peer
computing: first international workshop, AP2PC 2002, Bologna, Italy. 2002.
69
Baixar