ProbT: A Temporal Probabilistic Protocol to
Mitigate the Broadcast Storm Problem in VANETs
Daniel Sucupira Lima, Manoel Rui P. Paula, Filipe Maciel Roberto,
André Ribeiro Cardoso and Joaquim Celestino Júnior
Universidade Estadual do Ceará (UECE)
Laboratório de Redes de Computadores e Segurança (LARCES)
Fortaleza, Ceará, Brasil
Emails: {daniel.lima, manoel.rui, filipe, andrec, celestino}@larces.uece.br
Abstract—VANETs are self-organized networks in which their
constituent nodes are vehicles. They can be classified as a
subcategory of MANETs. Due to their special characteristics,
they demand protocols designed specifically for their scenario
of action. Different types of applications can be created for
VANETs such as security protocols, traffic management, systems
maintenance, comfort for drivers and passengers, and others.
In general, applications developed for VANETs make use of
broadcast information. However, there are many issues to be
considered. One of the central problems is the broadcast storm.
In this paper we propose a temporal probabilistic protocol, named
ProbT, to mitigate the broadcast storm problem. The ProbT
performance was measured and compared to the protocols Blind
Flooding, Weighted p-Persistence, AutoCast and Irresponsible
Forwarding. Based on the results, the ProbT shows a good
performance when compared to the mentioned protocols.
I.
I NTRODUCTION
With the development of wireless ad hoc communication
and vehicle technologies, there is a new model for traffic
information systems. Using such technologies, data can be
sent and received without fixed structures that are common
in systems based in infrastructure. VANETs can be used as an
alternative for data dissemination [1].
When the aim is to disseminate data in VANETs, one of
the problems is the broadcast storm. In a scenario where this
problem occurs, there is a high level of contention and packet
collision [2]. The broadcast information can be done by single
or multiple hops. A strategy in the case of multiple hops is the
use of probabilistic protocols.
This paper proposes a Probabilistic Temporal Protocol
named ProbT, that uses as a basis for forwarding decision
taking the number of neighbors in common between the source
and target, the distance between the source and its last known
neighbor and the distance between the source and target.
The following sections of this paper are organized as follows: Section 2 presents related work to this research. Section
3 introduces different broadcast schemes in VANETs. Section
4 describes the algorithm proposed in this article. Section 5
presents analysis and test results performed comparing the
ProbT performance to related work. Finally, section 6 presents
the conclusion and future work.
II.
R ELATED W ORK
One way of carrying out the data broadcast in VANETs is
through the use of blind flooding. This strategy is inefficient
because its use may result in the broadcast storm in the network
[3]. Studies show that the solution to this problem is NPComplete [4].
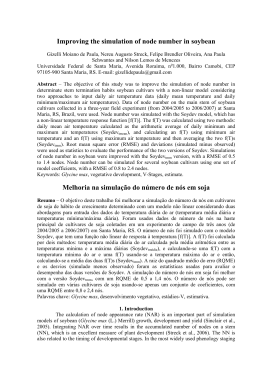
Figure 1 shows a classification for data broadcast protocols
presented by [1]:
Fig. 1.
A classification of broadcast protocols for VANETs (Edited) [1].
The data broadcast is divided into two categories: singlehop and multi-hop. The multi-hop category is subdivided into
three parts: delay based model, network coding model and
probabilistic protocols. In the delay based model, in general,
different waiting times are assigned to the receiving nodes of
a given packet prior to the data rebroadcast. In the network
coding model, generally the data rebroadcast is sought from
the junction of content of packet sent by different sources.
In probabilistic protocols, some characteristic relevant to the
network is analyzed and then translated into a mathematical
formula, modeling of the probability of forwarding a given
message.
In this classification [1], four probabilistic protocols used to
broadcast information are presented: Weighted p-persistence;
Optimized Adaptive Probabilistic Broadcast (OAPB), AutoCast and Irresponsible Forwarding (IF).
The Weighted P-Persistence assigns higher probability to
nodes that are located farther away from the broadcaster given
that GPS information is available and accessible from the
packet header [2].
The Optimized Adaptive Probabilistic Broadcast Protocol
(OAPB) [5] is a probability and restricted zone based broadcast
scheme to handle the broadcast storm problem. Each vehicle
node determines its own rebroadcast probability depending on
its local information within two-hops. The local information
is simply obtained from the periodical HELLO packets which
are involved in the operation of Ad-hoc On Demand Distance
Vector(AODV) routing protocol.
The AutoCast [6] protocol derives the forwarding probability from the number of neighbors of a node. To avoid
broadcast storms, on average only two nodes of those receiving
a new data unit rebroadcast it. An observation concerning this
protocol in [1] is the fact that it does not indicate the procedure
to be used in cases in which the number of neighbors is less
than 5, producing not acceptable values for probability.
The Irresponsible Forwarding [7] takes into account the
distance between transmitter and receiver and the statistical
distribution of vehicles in the following way: once received
the packet, the receiving node evaluates the probability of
another vehicle farther from the transmitter with a better
forwarding probability. If such vehicle is available - according
to the distance and vehicle density - the node “Irresponsibly”
chooses not to forward the packet (hence the name of the
Irresponsible Forwarding protocol). Otherwise, it forwards the
data according to the probability defined by this protocol.
In this work, will be simulated the Blind Flooding,
Weighted p-persistence, AutoCast, Irresponsible Forwarding
and ProbT.
III.
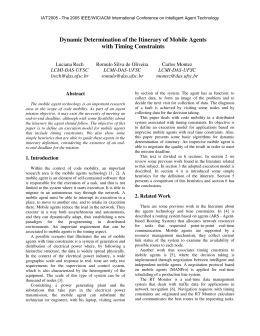
entries in its neighbor table to predict the position of all nodes
and consequently all the common neighbors with node B, as
depicted in the Figure 3.
Fig. 3.
Calculation of the number of neighbors in common.
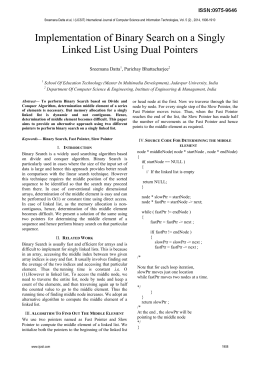
The ProbT takes into account a second characteristic that
uses as a basis for decision forwarding the positioning of the
receiving node within the transmission range of the source
node. Each sender includes in the data packet the position
of its farthest node. That permits all the receiving nodes to
calculate the distance between them and the source as shown
in Figure 4.
P ROB T
The ProbT is a hybrid protocol that takes into consideration
the characteristics presented by probabilistic and delay-based
protocols as basis for forwarding decision.
The forwarding decision is characterized by two phases.
The first phase makes use of two characteristics as the basis
for forwarding decision:
The first characteristic is related to the number of neighbors
in common between the source and receiver nodes.
Fig. 4.
Figure 2 represents the number of common neighbors between two nodes A and B, taking into account the transmission
range.
The decision forwarding using ProbT protocol can be
described by the Formula 1:
Distance to the last neighbor
p = α ∗ p1 + (1 − α) ∗ v ∗ p2
(1)
Where:
α = Priority factor belonging to the interval [0.0, 1.0] in R;
v = 1 if the receiver node is at a distance that belongs to the
interval [0.9 * Transmission Range, Transmission Range], or
0, otherwise;
p1 = The probability associated to the number of neighbors;
p2 = The probability associated with the receiver node position.
Fig. 2.
Number of neighbors in common.
The number of neighbors in common with another node
is predicted using as a basis a neighbor table maintained by
the vehicle and a mechanism for predicting position. Each
node sends a beacon packet (position, speed and acceleration)
in broadcasting. All the nodes receiving it build a table of
neighbohrs. When a node (e.g. A) receives a data packet
issued by another node (e.g. B) to be rebroadcast it has to
predict all the common neighbors between them (nodes A and
B). In order to do this, the node A should iterate over the
The probability associated to the number of neighbors is
defined by the formula 2:
p1 =
qN eigh − q
qN eigh
(2)
Where:
qNeigh = Number of neighbors that the receiving node has;
q = Number of neighbors in common with source and target
node.
The most distant nodes from the sending node tend to have
lower numbers of neighbors in common with the source when
compared to the closest nodes. The greater the number of
neighbors in common with the source, the worst node it is
considered and vice versa. Thus, the formula for forwarding
makes the receiving nodes with smaller numbers of neighbors
in common with the source have the highest values of probability of forwarding and vice versa.
The probability associated with the receiver node position
is modeled using the formula 3:
p2 = (1 −
|dLastN eigh − dT oSource|
)
max(dLastN eigh, dT oSource)
(3)
Where:
dLastNeigh = Distance to the last neighbor informed by the
source;
dToSource = Distance between the source and receiver node.
When the node receives the data packet, it calculates its
distance to the sending node. The closer the last neighbor
known by the source node is the receiver, it is considered the
best forwarder and vice versa. Figure 4 shows such distances.
Assuming that the car C received a packet from A, dLastNeigh
is the value of dA, B and dToSouce is the value of dA, C.
The priority factor α is used to assign percentages of values
for the criteria analyzed. The variable v is used to apply a
sectorization in the nodes transmission range (R). A node
that is at a distance less than 0.9 * R, will have zero value
as the probability associated with its positioning between the
source and the last known neighbor. This is done because, in
spite of the nodes located within this range have lower values
of forwarding probability, many of them may still decide to
send such packet, which is not desired. Thus, this reduces the
number of rebroadcasts in the network.
In the second phase, the ProbT algorithm differs the time
that a node will forward a given messages, as shown in Figure
5. This is done, since many nodes may receive a data packet,
many of them may try to forward it at the same time and
produce the previously mentioned problems such as contention
and packet collision.
The node generates a random number x in the range 0.0
to 1.0 using a uniform distribution. If this number is less than
the probability value calculated according to formula 1, it is
assumed that the node has volunteered to send this packet. In
this case, many nodes may volunteer and then try to send the
packet at the same time. To avoid this problem, the ProbT
protocol makes the nodes wait a time interval before sending
the packet, according to formula 4. The nodes with the higher
probabilities wait a shorter time interval to forward a message.
Also, if another node has already volunteered and sent this
packet received, such forwarding is no longer required . Thus,
at the end of the waiting period, the receiving node checks if
any node has sent this packet, if yes, it discards the packet, If
not, it forwards that.
W ait T ime 1 = (1 − p) ∗ DT 1
(4)
Fig. 5.
Receiving Diagram and packets forwarding.
Where:
DT1 = Time Interval 1.
If the receiving node does not volunteer, it means, the
random number x is greater than the probability value, the
receiver must wait for some other node to volunteer and
forward the packet if any other has not done it until the
end of Wait Time 2. Nodes that are not volunteers, when
realizing that no other node sent the packet, try to forward
the packet simultaneously. To avoid this problem, ProbT adjust
their waiting time according to the probability value. This time
interval is given by equation 5:
W ait T ime 2 = DT 1 + (1 − p) ∗ DT 2
(5)
Where:
DT2 = Time Interval 2.
To define the values of waiting time, we consider the
drivers’ brake reaction time according to [8], which varied
from 0.4 second to 2.7 seconds with a mean value of 1.0
second.
IV.
A NALYSIS AND R ESULTS
For the tests, we use the scenario with two lanes in a
given direction. The vehicles in the simulation move through
this lane with the same speed and direction. In [9], three
types of traffic schemes for VANETs protocols are presented:
sparse, dense and regular traffic. The regime of vehicular traffic
simulated were: regular traffic (20, 30) and dense traffic (60,
90 and 120) cars / km by road. Once the number of cars and
its density are determined, the cars are positioned on the lane
following an intervehicular spacing exponentially distributed.
Such scenario is created using the traffic simulator SUMO to
generate the file that describes the mobility of vehicles.
All vehicles are moving from left to right. The vehicle that
is on left edge will be the data message source so that the
intermediate nodes must forward the messages according to
the mentioned model.
For the simulations, the settings displayed in Table I were
used:
TABLE I.
Configuration of the scenarios
Parameter
Number of iterations
Number of vehicles
Velocity
Packet Delivery Rate
Propagation Model
Parameter α of the ProbT
Traffic
Transport
MAC/PHY
Transmission Range
Simulation Time
Confidence Interval
Value
33
500
60 km/h
1 packet/seg
Nakagami
0.3
20, 30, 90, 60 e 120 vehicles/km
UDP
802.11p
1 km
300 seconds
95 %
Fig. 6.
Delivery rate of packets with DT1 = DT2 = 0.5 s.
Fig. 7.
Delivery rate of packets with DT1 = DT2 = 0.05 s.
The Protocols Blind Flooding, Weighted P-persistence,
Autocast and Irresponsible Forwarding are simulated in the
NS-3 and compared with ProbT. The following metrics are
analyzed: packet delivery rate, packet loss rate, link load and
redundancy rate, defined in [1].
Packet Delivery Rate =
Number of vehicles receiving packets
Total of vehicles
Packet Loss Rate =
Link Load =
Number of lost packets
Total of packets sent
number of received packets
Observation period
Redundance Rate =
Number of duplicate packets
Number of source packets
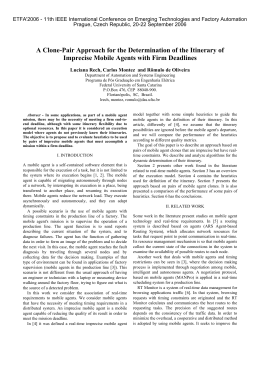
Figures 6 and 7 show the results obtained with the delivery
rate. For both scenarios, DT1 = DT2 = 0.5 s and DT1 = DT2 =
0.05 s, the ProbT showed the highest delivery rates. Obtaining
such forwarding rate indicates that the spatial distribution of
the volunteers, ie, their position is sufficient to deliver the
packets to a large number of nodes in the network. If the
selected nodes were not well positioned, a lot of nodes would
not receive the packets, which is not true. This indicates that
the forwarding probability is an efficient model on which the
nodes should send the message, because there is a high delivery
rate for it.
The delivery rate was bigger when the network was denser.
This happened because there was a greater number of potential
volunteer nodes, ie, a greater number of nodes to decide on
the routing. Another factor responsible for the high delivery
rate was the use of the waiting time before the forwardings.
This strategy prevented the occurrence of broadcast storms.
Figures 8 and 9 show the results obtained with the packet
loss. For both scenarios, DT1 = DT2 = 0.5 s and DT1 =
DT2 = 0.05 s, the ProbT presented the lowest loss rates. The
minimization of the loss rate occurred due to the junction of
the mechanisms of probabilistic protocols to the delay-based
protocols.
Another reason to the minimization of the loss rate was
the waiting time from the nodes which were not volunteers for
forwarding, to check if any node has really performed it. This
strategy increased the number of reception of data packets.
The low rate of packet loss reflects the efficiency of the
combination of these mechanisms. This indicates that the
waiting mechanisms, when applications may use them, are
efficient to produce low rates of packet loss.
Fig. 8.
Packet loss rate with DT1 = DT2 = 0.5 s.
Fig. 11.
Link load with DT1 = DT2 = 0.05 s.
Figures 10 and 11 show the results obtained with the link
load. This metric must be examined in parallel with the metrics
delivery rate and loss rate. The reason is that the link load
protocols with a high rate of delivery cannot be compared
to a protocol with a low delivery rate. Protocols with higher
delivery rates tend to have larger link loads and vice versa.
Among the simulated protocols, the protocol that approximates the rate of delivery of ProbT is the Blind Flooding.
With lower delivery rates there are the Weighted P-persistence
and Auto Cast. With a very low rate of delivery there is
the Irresponsible Forwarding. Thus, the protocols that can be
compared concerning the link load, more fairly, are the Blind
Flooding and ProbT. If Weighted P-persistence and Auto Cast
are included in the load link comparison, it is not fair due to
lower delivery rate that they have in relation to ProbT.
Fig. 9.
Fig. 10.
Packet loss rate with DT1 = DT2 = 0.05 s.
Link load with DT1 = DT2 = 0.5 s.
It is observed that, as the vehicle density increases, ProbT
has higher link loads. This is due to the fact that with a greater
number of nodes, the greater the number of nodes to take the
forwarding decision. Thus, it tends to increase the amount of
forwarding. This fact also explains the greater link load in other
protocols for higher densities of vehicles. It is also observed,
as expected, that the higher the waiting time for forwarding,
the lower the link load. When the nodes volunteer, they wait
intervals to check if any node has already sent the message. If
a node has already sent it, the packet can be discarded. If the
nodes tend to wait some more time, they should send fewer
packets and vice versa. Thus, it is justified the higher link
load for ProbT in a scenario with DT1 = DT2 = 0.05 s when
compared to the scenario with DT1 = DT2 = 0.5 s.
Figures 12 and 13 show the results obtained with the redundancy rate. Similarly to the load link, it must be analyzed in
parallel with the both metrics delivery rate and loss rate, since
the redundancy rate of a protocol with a high delivery cannot
be compared to a protocol with a low one. Protocols with
lower delivery rates tend to have lower rates of redundancy and
vice versa. Then, considering the delivery rate, the comparison
of rates of duplication is fairer between ProbT and Blind
Flooding.
packet loss. Depending on the delay limit that application can
handle, it is possible to manage the metrics link load and
redundancy rate.
V.
CONCLUSION AND FUTURE WORK
Based on the results, this protocol can be classified as a
great option when it is aimed to have a high delivery rate
and a low packet loss rate. It is also a reasonable option
concerning the metrics link load and duplicate packets. Thus
ProbT presents itself as a new option for broadcast packet
protocols using a new model for the problem.
As future work may be indicated:
Fig. 12.
•
Changing the layer on which the waiting intervals
occur: In ProbT, the intervals of waiting time occur
at the application layer from the calculation of the
forwarding probability. It is possible to study how to
put this waiting period, only at the data link layer;
•
Implementation of this protocol in a Manhattan scenario: ProbT was applied only in the Highway scenario. It is possible to study the changes needed to its
use in both scenarios.
Redundance rate with DT1 = DT2 = 0.5 s.
ACKNOWLEDGMENT
The authors would like to thank CAPES (Coordenação
de Aperfeiçoamento de Pessoal de Nı́vel Superior) for their
financial support.
R EFERENCES
[1]
[2]
[3]
Fig. 13.
Redundance rate with DT1 = DT2 = 0.05 s.
The ProbT showed the greatest packet redundancy rates
in higher densities of vehicles, since the higher the densities
of vehicles, the more the nodes that take the decision on
forwarding packets, ie, the greater the number of possible
duplication of packets.
As expected, the longer the waiting time for routing, the
lower the number of packet duplicates. Once a node sends a
packet, its neighborhood receives it, and takes the forwarding
decision. The volunteer nodes will wait time intervals. The
higher the waiting time, the lower the number of packet duplicates, since the vehicles give a greater time for its neighbors
to perform the forwarding.
In general, the ProbT shows better performance for higher
values of DT1 and DT2. The ProbT had good values regarding
the metrics delivery rate and loss rate and the increase in
these values highlighted that characteristic. To reduce the link
load the values of the waiting time should be increased. Thus,
non-emergency VANETs applications can make use of this
broadcast protocol for high delivery rates and low rates of
[4]
[5]
[6]
[7]
[8]
[9]
S. Panichpapiboon and W. Pattara-Atikom, “A review of information
dissemination protocols for vehicular ad hoc networks,” Communications
Surveys & Tutorials, IEEE, vol. 14, no. 3, pp. 784–798, 2012.
N. Wisitpongphan, O. K. Tonguz, J. Parikh, P. Mudalige, F. Bai, and
V. Sadekar, “Broadcast storm mitigation techniques in vehicular ad hoc
networks,” Wireless Communications, IEEE, vol. 14, no. 6, pp. 84–94,
2007.
R. Kumar and M. Dave, “A review of various vanet data dissemination
protocols.”
F. M. Roberto, J. Celestino, and H. Schulzrinne, “Using a symmetric
game based in volunteer’s dilemma to improve vanets multihop broadcast
communication,” in Personal Indoor and Mobile Radio Communications
(PIMRC), 2011 IEEE 22nd International Symposium on. IEEE, 2011,
pp. 777–782.
H. ALshaer and E. Horlait, “An optimized adaptive broadcast scheme
for inter-vehicle communication,” in Vehicular Technology Conference,
2005. VTC 2005-Spring. 2005 IEEE 61st, vol. 5. IEEE, pp. 2840–2844.
A. Wegener, H. Hellbruck, S. Fischer, C. Schmidt, and S. Fekete,
“Autocast: An adaptive data dissemination protocol for traffic information
systems,” in Vehicular Technology Conference, 2007. VTC-2007 Fall.
2007 IEEE 66th. IEEE, 2007, pp. 1947–1951.
S. Panichpapiboon and G. Ferrari, “Irresponsible forwarding,” in ITS
Telecommunications, 2008. ITST 2008. 8th International Conference on.
IEEE, 2008, pp. 311–316.
G. Johansson and K. Rumar, “Drivers’ brake reaction times,” Human
Factors: The Journal of the Human Factors and Ergonomics Society,
vol. 13, no. 1, pp. 23–27, 1971.
O. Tonguz, N. Wisitpongphan, F. Bai, P. Mudalige, and V. Sadekar,
“Broadcasting in vanet,” in 2007 mobile networking for vehicular environments. IEEE, 2007, pp. 7–12.
Baixar