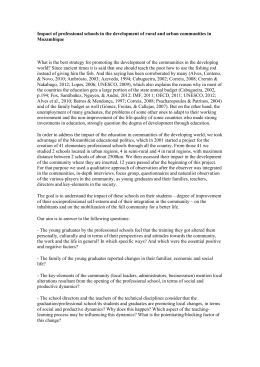
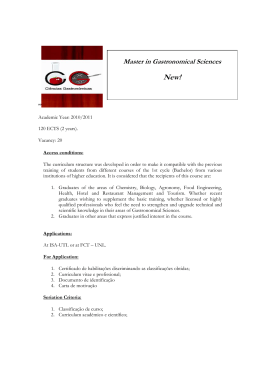
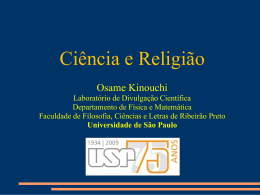
261
educação, ciência e tecnologia
WATER SOLUBILITY OF COPPER SULPHATE FROM POLYMERS
RAQUEL PINHO FERREIRA GUINÉ*
Keywords: Copper sulphate, solubility, diffusion.
Abstract
To study the solubility of the copper sulphate in water, different
types of tablets were prepared from different polymers with different
percentages of CuSO4. The tablets were left in water for some days and
the amount of CuSO4 released from the tablets was determined by
measuring the absorbency of the final solution.
In the first phase of this work 10 samples were prepared,
corresponding to two similar sets. The results from these two sets were
not much different, and similar samples registered approximately the
same amount of CuSO4 in the water. By the seventh day more than the
maximum amount of CuSO4 expected was already registered in the
solution, meaning that all the copper sulphate present had been
transferred from the tablets to the water.
To try to get some more information about the influence of various
factors on the solubility of the CuSO4, another experiment was carried
out and more tablets of different sizes and from different polymers were
prepared.
From the results obtained it was possible to take some conclusions
regarding the way both factors, thickness and type of polymer, influence
the release of the copper sulphate from the tablets.
*
Docente da Escola Superior Agrária do Instituto Superior Politécnico de Viseu.
262
educação, ciência e tecnologia
Introduction
The kinetics of release of simple solutes into water, like sulphates incorporated
in polymer matrices is of great importance, and has been subject to studies by many
authors. Papadokostaki et all (1), for example, found out in his work that the kinetic of
release obeyed a root t law, although there is an initial period where the diffusion
coefficient increases with increasing solute load.
The process of solute diffusion, which is the major responsible for rate
controlling, is dependent on the tortuosity of the available pathways (1).
The formation of a porous network in the matrix by mechanical rupture of the
walls that separate the different holes that contain the solute particles, may influence the
release rates of the solutes present (2).
One other mechanism is proposed by Papadokostaki et al (2) based on the
combination of both interacting factors: solute release and water absorption-desorption
processes. One other very important factor to consider when analysing the influence on
the mechanism of solute release is the molecular relaxation processes that occur
simultaneously.
Purdy et al (3) studied the interactions of solvent with copper in the diffusion
and/or dissolution of copper into polymers, having concluded that copper dissolves
easily in a wide variety of solvents, including water, under a pure oxygen atmosphere.
Shin et al (4) studied the release of certain chemicals from polymeric materials,
having concluded that both pH and temperature controlled indirectly the release rate.
The release of different solutes may be governed either by osmotic pressure or
by the diffusion process, not excluding the possibility of the influence of the matrix
degradation at the final stage of the process. The rate of release may be determined by
the polymer composition and molecular weight, coating thickness and device geometry
(5).
Mi et al (6) prepared polymer tablets containing solutes by directly compressing
the wet and dry blended powders containing the polymer and the solute, that were used
to study the releasing rates.
Experimental
Materials:
- Tone P-300 Polymer (Union Carbide Chemical & Plastics SA)
- Tone P-700 Polymer (Union Carbide Chemical & Plastics SA)
263
educação, ciência e tecnologia
- Tone P-767 Polyol HP (Union Carbide Chemical & Plastics SA)
- Capa 650 (Union Carbide Chemical & Plastics SA)
- Copper(II)-Sulphate-Pentahydrate: CuSO4.5H2O (MERK)
Equipment:
- FONTIJNE TABLE PRESS TP 400
- PU 8620 UV/VIS/NIR Spectrophotometer PHILIPS
Experimental procedure
The experimental procedure to prepare the tablets was as follows:
a) Weight the quantities of polymer (Tone P-300) and CuSO4 needed.
b) Melt the polymer (Tone P-300) in a glass by heating for 1-2 minutes.
c) Add the copper sulphate and mix the two.
d) Fill the holes of the mould1 with the melted mixture.
e) Press during 1-2 minutes at 80ºC with 100 kN.
f) Take the tablets out of the mould.
g) Keep in a closed plastic bag.
The experimental procedure to measure the absorbency of the tablet solutions
was:
a) Put three small (or one big) tablets into a container with 20.00 ml of distilled
water.
b) Measure the absorbency of the solution.
The characteristics of the tablets produced according to the procedure described
above and used in the first two sets of samples (set A and set B) are presented in tables
1 and 2.
Table 1 - Quantities used in the preparation of the tablets for sets A and B.
Tablet reference
T50
T30
T25
T20
T10
1
CuSO4
(g)
20.00
10.90
8.30
6.00
2.50
Polymer (g)
(Tone P-300)
20.00
25.00
24.80
24.00
22.50
Total
(g)
40.00
35.90
33.10
30.00
25.00
The dimensions of the tablets made with this mould are: diameter = 10 mm, thickness = 2 mm.
% of CuSO4
(w/w)
50.0
30.4
25.1
20.0
10.0
264
educação, ciência e tecnologia
Table 2 - Characteristics of the tablets for sets of samples A and B.
Tablet reference
T50
T30
T25
T20
T10
Characteristics
Not well pressed, with some bubbles of air.
The colour is uniform, strong blue.
Better pressed.
Colour asymmetrically distributed, with some dark blue areas and
some clear blue (or white) areas.
Well pressed.
Clear blue with some darker and clearer areas.
Well pressed.
Clear blue, more or less uniform, with some areas turning to
brown.
Well pressed.
Clear blue with some asymmetries. Some brown areas.
Table 3 - Characteristics of the tablets for set C.
Polymer used
P – 300
P – 700
P – 767
Capa 650
Notes on the preparation
•Melted quickly.
•Easy to mix both components.
Type
Thin
•Easy to put in the holes of the Thick
mould.
Thin
•Melted very slowly.
•Very difficult to mix.
•Very high viscosity.
Thick
•Difficult to put in the mould.
•Melted very slowly.
•Very high viscosity, almost like
a ball of moulding clay or
rubber.
•Almost impossible to mix
properly.
•If heated after mixing, does not
melt and becomes brown.
•Melted even more slowly.
•Very high viscosity, almost like
a ball of moulding clay or
rubber.
•Mixing is difficult.
•If heated after mixing, it melts a
little without degrading the
polymer. Therefore it is easier to
mould.
Thin
Thick
Thin
Thick
Notes on the tablets
•Not well pressed.
•Strong Blue with some
white areas.
•Well pressed.
•Uniform strong blue.
•Well pressed.
•Uniform clear blue.
•Very well pressed.
•Clear blue with some
brown areas.
•Well pressed.
•Clear blue with some
brown areas.
•Very well pressed.
•Clear blue with
brown areas.
some
•Well pressed.
•Uniform strong blue.
•Very well pressed.
•Strong blue with some
light blue areas.
265
educação, ciência e tecnologia
In the third set of samples (set C) all the tablets were prepared with 50% of
CuSO4 and 50% of Polymer (30.00 g of each), and two different types were made
according to their size:
Thin:
diameter = 10 mm, thickness = 2 mm.
Thick: diameter = 10 mm, thickness = 10 mm.
The characteristics of the tablets used in set C are listed in table 3.
The experimental procedure to draw the calibration curve was as follows:
a) Prepare some standard solutions by weighting an exact amount of CuSO4 and
diluting it into a certain volume of distilled water.
b) Measure the absorbency of these solutions.
NOTES: - The absorbency of the water (Reference) was set to zero.
- The wave length of measurement was 810.
The characteristics of the samples used as standards to determine the calibration
curve are presented in table 4.
Table 4- Preparation of the standards for drawing the calibration curve.
ard nº
Stand
1
2
3
4
5
6
Amount of
diluted in 25.00 ml
0.025
0.075
0.175
0.325
0.500
0.750
CuSO4
(g)
Concentration of CuSO4 (g/l)
1.0
3.0
7.0
13.0
20.0
30.0
Results and discussion
Calibration curve
The calibration curve consists of a set of points that allow us to plot the
absorbency of the solution versus the concentration of CuSO4. Those points were
determined by measuring the absorbency of a set of standard solutions, prepared
according to the procedure described earlier, and whose characteristics are those in table
4.
The measured absorbency of the standard solutions was registered along time in
table 5, and it is possible to verify that after the first day the absorption of the standards
266
educação, ciência e tecnologia
was maintained approximately constant. The data used to draw the calibration curve in
figure 1 was naturally the data from the last day, that in this experiment corresponds to
the 7th day.
Table 5 - Absorbency measurements of the standard solutions.
Standard
Absorbency
nº
Day 0
Day 1
Day 2
Day 5
Day 7
1
0.039
0.054
0.051
0.051
0.049
2
0.161
0.143
0.145
0.141
0.141
3
0.301
0.337
0.335
0.333
0.333
4
0.492
0.618
0.627
0.615
0.617
5
0.739
0.872
0.876
0.869
0.876
6
1.014
1.512
1.520
1.523
1.522
Absorbency
Figure 1- Calibration curve.
1,6
1,4
1,2
1
0,8
0,6
0,4
0,2
0
y = 0,0494x - 0,019
2
R = 0,9916
0
5
10
15
20
25
30
35
Concentration of CuSO4 (g/l)
The calibration curve was found to be approximately a straight line of the form:
abs = a + b * conc. (g/l)
(1)
where b is the slope and a the absorption when the concentration is zero.
The experimental value of a should be as close to zero as possible for it was
defined that the absorption of pure water was zero.
The values for a and b in equation (1) were found to be:
a = -0.019
b = 0.049 (l/g)
267
educação, ciência e tecnologia
with a correlation coefficient of 0.9958.
Absorbency measurement of the tablet solutions
In the first part of this work 10 samples were prepared, consisting of two sets
denominated by set A and set B, and their expected absorbency was determined
theoretically from the calibration curve as a function of the maximum concentration of
CuSO4 that would be expected in the solutions. Those results are presented in table 6.
The maximum theoretical concentration of CuSO4 in the sample’s solutions was
calculated assuming that the copper Sulphate was uniformly distributed through all the
tablets. Therefore,
W(CuSO4) = x(CuSO4) * W(3 tablets) (g)
(2)
and
Conc(CuSO4) = W(CuSO4) * 1000/20 (g/l)
(3)
where x represents the weight fraction and W the weight.
Table 6 – Expected absorbency of the samples used in sets A and B.
Sample nº
Set A
1
2
3
4
5
Set B
6
7
8
9
10
% of CuSO4
(w/w)
Weight of 3
tablets (g)
Vol. Distilled
water (ml)
Max. Conc.
CuSO4 (g/l)
Correspond.
Absorbency
(*)
50.0
30.4
25.1
20.0
10.0
0.8435
0.6879
0.6345
0.5858
0.5495
20.00
20.00
20.00
20.00
20.00
21.0875
10.4561
7.9630
5.8580
2.7475
1.014
0.493
0.371
0.268
0.116
50.0
30.4
25.1
20.0
10.0
0.8442
0.6980
0.6062
0.5950
0.5363
20.00
20.00
20.00
20.00
20.00
21.1050
10.6096
7.6078
5.9500
2.6815
1.015
0.501
0.354
0.273
0.112
(*) Calculated from the calibration curve: equation (1).
In figures 2 and 3 the absorbency of the samples in sets A and B is represented as
a function of time.
268
educação, ciência e tecnologia
Figure 2 – Absorbency measurements for set A of samples.
1.6
Sample 1
Sample 2
Sample 3
Sample 4
Sample 5
1.4
Absorbency
1.2
1
0.8
0.6
0.4
0.2
0
Day 0
Day 1
Day 2
Day 3
Day 4
Day 5
Day 6
Day 7
Time
Figure 3 – Absorbency measurements for set B of samples.
1.6
1.4
Absorbency
1.2
Sample 6
Sample 7
Sample 8
Sample 9
Sample 10
1
0.8
0.6
0.4
0.2
0
Day 0
Day 1
Day 2
Day 3
Day 4
Day 5
Day 6
Day 7
Time
The results from these two sets of samples are not much different and show that
similar samples originated approximately the same amount of CuSO4 in the water. In
table 7 the relative percentage over the expected value of absorbency is presented.
269
educação, ciência e tecnologia
Table 7 - Results from sets A and B of samples.
Sample nº
1
6
2
7
3
8
4
9
5
10
% over conc.
CuSO4 (*)
41
37
45
47
26
25
22
26
36
30
Day of
confirmation
3
3
7
3
7
3
7
3
7
7
(*) Calculated relatively to the expected absorbency:
%=
measured abs. - expected abs.
* 100
expected abs.
By the seventh day more than the maximum amount of CuSO4 expected is
already registered in the solution, meaning that all the copper sulphate present has been
transferred from the tablets to the water.
The measurements made after the maximum concentration of CuSO4 has been
registered were made to confirm that fact and do not differ much from the previous
ones. Therefore, by the 3rd day practically all the copper Sulphate had actually left the
tablets.
During the first experiment it was possible to notice that for higher
concentrations of CuSO4 the tablets were not so consistent and would break easily when
in water. This could be due to insufficient pressing while they were being prepared or to
the high amount of CuSO4 present.
To try to get some more information on the influence of these factors in the
structure of the tablets some more tablets of two different sizes were prepared and more
polymers were used. In table 8 the characteristics of these tablets are presented as well
as the corresponding expected absorbency determined by the calibration curve.
According to the results of the first experiments, at least by the 7th day the
transference of the copper sulphate from the tablets to the water has been completed.
Therefore, the time scale-up of the measurements has been altered and more
measurements were made in the first days.
270
educação, ciência e tecnologia
Table 8 – Characteristics of the samples for set C.
Sample nº Type of
polymer
11
P – 300
12
P – 300
13
P – 300
14
P – 300
15
P – 700
16
P – 700
17
P – 700
18
P – 700
19
P – 767
20
P – 767
21
P – 767
22
P – 767
23
Capa 650
24
Capa 650
25
Capa 650
26
Capa 650
Type of
tablet
Thin
Thin
Thick
Thick
Thin
Thin
Thick
Thick
Thin
Thin
Thick
Thick
Thin
Thin
Thick
Thick
Weight of
tablets (g)
0.8009
0.7938
1.2823
1.2213
0.7553
0.7660
1.2265
1.1942
0.7465
0.7306
1.2187
1.2549
0.8289
0.8615
1.2896
1.2462
Max. conc.
CuSO4 (g/l)
20.0225
19.8450
32.0575
30.5325
18.8825
19.1500
30.6625
29.8550
18.6625
18.2650
30.4675
31.3725
20.7450
21.5375
32.2400
31.1550
Corresp.
Absorb. (*)
0.962
0.953
1.552
1.477
0.906
0.919
1.483
1.444
0.895
0.876
1.474
1.518
0.998
1.036
1.561
1.508
(*) Calculated from calibration curve: equation (1).
In figures 4 and 5 the absorbency of the samples 11 to 26 is registered for a
period of 24 days.
Figure 4 – Evolution with time of absorbency for samples 11 to 18.
1.8
1.6
Absorbency
1.4
1.2
S 11
S 12
S 13
S 14
S 15
S 16
S 17
S 18
1
0.8
0.6
0.4
0.2
0
Day 0
Day 5
Day 10
Day 15
Time
Day 20
Day 25
271
educação, ciência e tecnologia
Figure 5 – Evolution with time of absorbency for samples 19 to 26.
0.9
0.8
Absorbency
0.7
0.6
S 19
S 20
S 21
S 22
S 23
S 24
S 25
S 26
0.5
0.4
0.3
0.2
0.1
0
Day 0
Day 5
Day 10
Day 15
Day 20
Day 25
Time
Table 9 – Results from the second experiment (set C of samples).
Polymer used
Type of tablet
Thin
P - 300
Thick
Thin
P - 700
Thick
Thin
P - 767
Thick
Thin
Capa 650
Thick
Sample nº
11
12
13
14
15
16
17
18
19
20
21
22
23
24
25
26
% of solubility at last day (*)
> 100
> 100
> 100
> 100
80
94
48
54
71
79
26
48
70
82
32
32
(*) Calculated relatively to maximum absorbency: % solubility = (abs. at last day) / (max.
abs.) * 100 %
In table 9 the degree of solubility of the copper sulphate in water, according to
type and shape of the tablets is shown, according to type and shape of the tablets. The
degree of solubility was calculated as a percentage of absorbency relatively to
maximum absorbency expected.
272
educação, ciência e tecnologia
From the results presented, it is possible to infer that both factors, type of
polymer and thickness of the tablet, influence the degree of solubility of the CuSO4.
As could be expected, thicker tablets retain the CuSO4 for longer time than the
thinner ones. This behaviour is general and concerns all four types of polymers tested.
In fact, table 9 shows that the percentage of solubility is always less for thicker tablets.
The type of polymer is also an important factor, and tablets made from P-300
released all the CuSO4 quite easily (thin tablets on the 1st day and thick tablets on the
16th day). The polymers that seem to retain better the CuSO4, and in a similar way, are
P-767 and capa 650.
In table 10 is indicated the order by which the types of tablets release or would
release all the CuSO4 present.
Table 10 - Order of release of the CuSO4.
Order of release
1
2
3
4
5
6
7
8
Type of tablet
P-300
P-300
P-700
P-767
Capa 650
P-700
P-767
Capa 650
Thin
Thick
Thin
Thin
Thin
Thick
Thick
Thick
Conclusions
From this work is possible to conclude that the degree of solubility of copper
sulphate is both influenced by the type of polymeric material used to produce the tablets
and it’s size.
As to the type of polymer, the behaviour of the polymers tested is different,
which is easily understanding regarding their different macromolecules and
consequently different structures.
Concerning the factor size, and as would be expected according to mass
diffusion laws, thicker tablets retain the copper sulphate during more time than thin
ones.
273
educação, ciência e tecnologia
References
(1) - Papadokostaki, K. G.; Amarantos, S. G.; Petropoulos, J. H., ‘Kinetics of release of
particulate solutes incorporated in cellulosic polymer matrices as a function of solute solubility
and polymer swellability. I. Sparingly soluble solutes’, Journal of Applied Polymer Science 67(2),
1998, 277-287.
(2) - Papadokostaki, K. G.; Amarantos, S. G.; Petropoulos, J. H., ‘Kinetics of release of
particulate solutes incorporated in cellulosic polymer matrices as a function of solute solubility
and polymer swellability. II. Highly soluble solute’, Journal of Applied Polymer Science 69(7),
1998, 1275-1290.
(3) - Purdy A. P.; Godbey, D.; Buckley, L., ‘The dissolution of copper in common
solvents used for low dielectric polymers’, Thin Solid Films 308, 1997, 486-489.
(4) - Shin, H. S.; Kim, S. Y.; Lee, Y. M., ‘Indomethacin release behaviour from pH and
thermoresponsive poly(vinyl alcohol) and poly(acrylic acid) IPN hidrogels for site specific drug
delivery’, Journal of Applied Polymer Science 65(4), 1997, 685-693.
(5) - Lemmouchi, Y.; Schacht, E., ‘In vitro evaluation of poly(epsilon-caprolactone-co-llactide) implants containing trypanocidal drugs’, Journal of Bioactive & Compatible Polymers
12(3), 1997, 175-185.
(6) - Mi F. L.; Her, N. L.; kuan, C. Y.; Wong, T. B.; Shyu, S. S., ‘Chitosan tablets for
controlled release of theophylline-efect of polymer-drug wet or dry blending and anionic-cationic
interpolymer complex’, Journal of Applied Polymer Science 66(13), 1997, 2495-2505.
Baixar