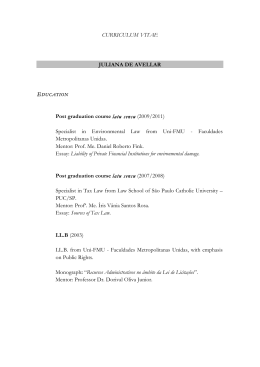
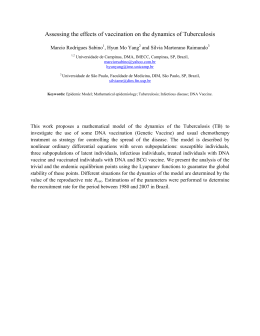
Lobo. Monitoring of water temperature of the Roncador river MONITORING OF WATER TEMPERATURE OF THE RONCADOR RIVER: CONTRIBUTION TO SPELEOCLIMATE ANALYSIS AND TOURIST MANAGEMENT OF THE CAVE OF SANTANA (IPORANGA, BRAZIL) MONITORAMENTO DA TEMPERATURA DA ÁGUA NO RIO RONCADOR: CONTRIBUIÇÃO À ANÁLISE ESPELEOCLIMÁTICA E AO MANEJO TURÍSTICO DA CAVERNA DE SANTANA (IPORANGA-SP, BRASIL) Heros Augusto Santos LOBO Programa de Pós-GRaduação em Geociências e Meio Ambiente - UNESP Instituto Ekos Brasil Indaiatuba SP - [email protected] Abstract The monitoring of cave environments for tourist management is necessary for the establishment of limitations in visitation, thus promoting the preservation of caves. With this in mind, the water temperature of the Roncador river was monitored in the cave of Santana, along with that of the atmosphere, in order to verify their participation in the atmospheric system of the cave and possible impacts of tourism to be considered during management decisions. The results show that for a large portion of the river gallery, at distances greater than 300m from the resurgence, the air temperature is governed by the temperature of water. This has made it possible to establish conclusions identifying the dynamics of atmospheric circulation, the dispersion of the impacts of visitation, and the capacity of the Roncador river to maintain the stationary state of the atmosphere in the gallery of the river in the cave of Santana. Key-Words: Environmental monitoring; Energy flow; Cave management; Speleotourism; microclimate. Resumo O monitoramento dos ambientes cavernícolas para fins de manejo turístico deve ser realizado em uma base ampla, de forma a considerar todas as possibilidades e limitações para o seu uso. Nesse sentido, realizou-se um monitoramento da temperatura da água do rio Roncador, em conjunto com o monitoramento de variáveis atmosféricas, na caverna de Santana, com o intuito de verificar sua participação no sistema atmosférico da cavidade e possíveis interferências no manejo turístico. Os resultados demonstraram que grande parte da galeria do rio, em trechos em distância superior a 300 m de sua ressurgência, possuem a temperatura do ar governada pela temperatura da água. Com isso, foi possível estabelecer conclusões que dão suporte para a dinâmica de circulação atmosférica, a dispersão de impactos de visitação e a capacidade do rio Roncador na manutenção do estado estacionário da atmosfera na galeria do rio na caverna de Santana. Palavras-Chave: Monitoramento Ambiental; Níveis de Circulação de Energia; Manejo de Cavernas; Espeleoturismo; Microclima. 1. INTRODUCTION The management of caves for tourist purposes requires a wide array of environmental studies in an attempt to preserve the subterranean environment and make its use sustainable. From a practical point of view, speleoclimatic parameters are among the most important for the management of caves because they have proved to have a relation of cause and effect, with environmental alterations due to visitation can be identified, whether they are transitory or permanent, direct or indirect (CIGNA; FORTI, 1988; LOBO, 2008; ROCHA, 2010). The presence of bodies of water inside caves also exercises a decisive role in tourist management, since they objects of considerable attraction for tourism (LOBO, 2007); moreover, they play a role as vectors in the dispersion of impacts (HEATON, 1986; PULIDO-BOSCH et al., 1997), and they influence the relative and absolute humidity of the air (DUBLYANSKY; DUBLYANSKY, 1998; BUECHER, 1999; CARRASCO et al., 2002), as well as the temperature, with the size of the effect depending on the size of this body of water. In Campinas, SeTur/SBE. Tourism and Karst Areas, 4(1), 2011. 33 Lobo. Monitoring of water temperature of the Roncador river extreme cases, the temperature of the water can even make a direct contribution to condensation corrosion at higher temperatures (SARBU; LASCU, 1997) or, at greatly reduced temperatures, participate in the formation of speleothems of ice (PFLITSCH et al., 2006; PIASECKI et al., 2006). The present paper presents partial results of research monitoring the speleoclimate in the cave of Santana, located in Iporanga city, Brazil, focusing of the temperature of the water of the Roncador river. This river has already been the focus of earlier studies which have emphasized its role in the evolution and dynamics of the local karst (KARMANN, 1994), as well as the sources of recharge and hydrological connections within the system (AYUB, 2007). Here, the monitoring of the temperature of the water was focused on the identification of its possible correlation with the temperature of the air, serving as a basis for the understanding of the physics of the thermal system of the cavity and its atmospheric resilience in relation to the impact of visitation. 2. MATERIALS AND METHODS of the State Touristic Park of the Upper Ribeira River (PETAR) in the municipality of Iporanga in the southwestern part of the state of São Paulo. The cave is located in a limestone massif, more than 200m below the surface. At present, some 7.2km have been mapped, and hundreds of meters are left to be explored. The traditional visitation circuit encompasses some 460m of galleries in three of the six levels, close to the resurgence of the Roncador river. The total vertical variation is 54m, with the resurgence located at an altitude of 250m above sea level. The cave of Santana, in a subtropical zone, is surrounded by dense Atlantic Coastal Rain Forest, with rains concentrated between December and February, an annual average of 1,500mm of rain, and daily accumulations of up to 300mm (GUTJHAR; TARIFA, 1993). The lower gallery of the cave of Santana is traversed by the Roncador river; the main swallet is located in the Pérolas cave. Recharge here is mainly allogenic, although autogenic recharge is also quite active, as can be seen in periods of intense rain, when segments of the upper galleries suffer partial flooding (Figure 2). This study was conducted in the cave of Santana, which is partially located within the bounds Figure 1 – Location of cave of Santana and points of data collection Campinas, SeTur/SBE. Tourism and Karst Areas, 4(1), 2011. 34 Lobo. Monitoring of water temperature of the Roncador river Figure 2 – Variation in water level in cave of Santana: a) normal level of the Roncador river, with the paths for visitation clearly evident (historic photo from 2007, when the cave still had a gate); b) raised water level, with the river covering the paths; c) normal level of water in the Meeting Room, with rimstone dams apparently totally fossilized; d) rimstone dams filled with water, showing active autogenic flow in the upper gallery The choice of the cave of Santana for the realization of this study was due to its importance in the regional and national context of ecotourism and speleotourism. The cave receives an average of 20,000 visits per year, with peaks of over 30,000. The carrying capacity at present is limited to 117 visits per day, as established by Lobo (2008), although recent studies by Lobo et al. (2011) suggest the feasibility of an increase to 297. The monitoring of atmospheric parameters and the temperature of the water was conducted with Testo instruments (series 175 and 177). Only the data about temperature and relative humidity of the external station and a single point in the river gallery some 300m from the entrance of the cave are presented here for the comparison of the temperature of the water (Figure 1). The accuracy of the instruments is 0.2 °C for air temperature, and 0.1 °C for that of water, as well as 2% for relative humidity. The precision of the temperatures presented here is 0.1 °C and 0.1% for the relative humidity of the air. The sensors were installed against the walls of the cave, which may alter the results somewhat in relation to the integration of the readings with the underground atmosphere of the specific passage. However, preliminary studies in the cave of Santana have shown that for the scale of accuracy of the sensors, this difference is not detectable. Monitoring was carried out for a continuous period of a year, although instrument failures left certain gaps in the data. Collections were made every 30 minutes, for a total of 48 readings per day. The river station was monitored continuously from April 1 to December 11, 2009, but at this time the flooding of the gallery of the river interrupted the functioning of the thermohygrometer. During the period of effective monitoring, the cave continued to receive regular tourist visitation from Tuesday to Sunday, from 9 am to 5 pm. The first set of analyses involves descriptive statistics. These provide averages of central tendency (medium, mode, and average) and variability (height, standard deviation, and variance) for each daily, monthly, and annual series. This procedure made it possible to determine the Campinas, SeTur/SBE. Tourism and Karst Areas, 4(1), 2011. 35 Lobo. Monitoring of water temperature of the Roncador river simplification necessary to conclude the other statistical analyses. The mode was used as the main measurement of central tendency for the analysis because the daily series involved great repetition and the standard pattern of variability could be identified for each of the parameters. The use of the mode is also justified, as pointed out by Gerardi; Silva (1981), because it is efficient for the graphic presentation of data. The average, on the other hand, was used to present the disadvantages of asymmetric series (GERARDI; SILVA, 1981), such as was found for the external monitoring points. Statistics were used for the analysis of speleoclimatic parameters (e.g. MANGIN, 1984; LAROCQUE et al., 1998; MANGIN et al., 1999; FERRARI; KARMANN, 2008), as well as for speleoclimatology (e.g. CALAFORRA et al., 2003; FERNÁNDEZ-CORTÉS et al., 2006). The statistical analyses of temporal series are initiated with a moving average. In addition to the graphs with the moving averages, the revelation of greater discrepancies in the original series, led to the plotting of the residuals. Analyses were also made using three temporal functions: autocorrelation, spectral density, and cross correlations. Autocorrelation quantifies the relation of linear dependence for successive values in an interval of time. The spectral density corresponds to a transformation of the domain of time to that of frequency using a Fourier transformation of the function of autocorrelation. Cross correlation verifies the independence of two series of variables, showing whether they are equal to or distinct from each other. 3. RESULTS AND DISCUSSION 3.1. Temperature and relative humidity of air The results from the monitoring of the temperature and relative humidity of the air outside the cave are presented in Figure 3. The highest maximum temperatures during the period were registered in the months of September (31.2 °C) and November (32.1 °C). On the other hand, the minimum temperatures were registered in June (9.7 °C) and August (9.5 °C). These absolute values cannot be seen in Figure 3, which provides only the moving averages. The month which was the hottest during the period monitored was November, while July and August were the coldest. Measures of central tendency of the external temperature series revealed an annual average of 19.9 °C, with a mode of 17.9 °C and a median of 19.9 °C. For the relative humidity, the central tendency and dispersion reflected in the mode and median, as well as the maximum, were 99.9%, while the average was 98.9% and the low 60.2%. The variation over the year was a spread of 23.4 °C for temperature and 39.7%.for humidity. Figure 3 – Smoothed series based on moving averages of temperature (red) and relative humidity of air (blue) for the external monitoring station for the period from April 1 to December 11, 2009. Campinas, SeTur/SBE. Tourism and Karst Areas, 4(1), 2011. 36 Lobo. Monitoring of water temperature of the Roncador river The various gaps in the original series make a global statistical analysis of the data via temporal series impossible; consequently, the analyses here are limited to the longest uninterrupted period of the original series, from July 1 to December 13, 2009, a total of 166 days, which includes part of the winter and part of the summer. In this series, autocorrelation and spectral density were calculated, as presented in Figures 4 and 5 for air temperature. when the r index reaches a value of 0.198. In general, the autocorrelation function shows a decrease over time, a pattern that is repeated for the other series analyzed by other monitoring stations. A Figure 5 – Spectral density of series selected at external monitoring station Spectral density shows peaks at 24h and 12h, which is coherent with the atmospheric dynamics and the results of autocorrelation. However, the high spectral density is close to zero, with the existence of periodic phenomena which extend beyond the time period analyzed. B For the monitoring station near the point of collection of data in the river, Figure 6 shows the averages of dispersion and central tendency for the entire series for the air temperature. The relative humidity of the air at this point was constant throughout the monitoring period, with a value of 99.9%, showing the saturation of the air. Figure 4 – Autocorrelation function for entire series (A) and in detail for the first 500 hours (20,8 days) (B) in external station. Autocorrelation was used to study the series of 3984h (166 days). The variation shows a cyclic periodicity of 24 hours, as can be seen in Figure 4A; details can be seen in Figure 4B. The memory effect of the system is approximately 930h (38.75 days), The minimal temperature fell to 17.3 °C at 9am on June 4, 2009, at this monitoring station, although the temperature here had been close to this for hours (17.4 °C between 5:30am and 8:30am). At the other extreme, the high registered was 20.2 °C at 6:30pm on July 4; this same temperature was registered at other monitoring stations in the same cave. Except for this single elevated value, the maximum registered was 19.3 °C. The daily thermal variation was normally less than 1 °C. Visual analysis of the graph suggests that the air temperature at this station is correlated with that of the outside air in relation to the minimum. Campinas, SeTur/SBE. Tourism and Karst Areas, 4(1), 2011. 37 Lobo. Monitoring of water temperature of the Roncador river Figure 6 – Simplified series of air temperature at station in gallery of river, with measures of dispersion (maximum and minimum) and central tendency (mode) for the period from April 1 2009 to March 31, 2010. An analysis of the entire temperature series for the air at this station reveals an annual average of 18.28 °C, a mode of 18,1 °C and a median of 18,2 °C. The annual temperature variation was 2.9 °C, if the extreme of 20.2 °C is included in the analysis, but only 2 °C if it is ignored. Any variation in humidity was observed at this station, with all the measures of central tendency being equal to 99.9% throughout the period monitored. The smoothing of the data involved the adoption of the moving average; the graph of the respective residuals is presented in Figure 7. The smoothed series does not reveal any large differences in relation to the original series of data (Figure 7A), suggesting the lack of anthropic influence at this point in the cave. The only exception deviating from the general behavior of the temperature at this point occurred on July 4, reflecting an event of unknown origin also revealed in Figure 6 and the residuals observed in Figure 7B. The results of the autocorrelation and spectral density functions for the temperature of the air in the gallery of the river are presented in Figure 8. The analysis of the data was applied to a series of 6120h (255 days). The autocorrelation function (Figure 8A) shows a slow decrease, revealing reduced atmospheric dynamics at this point. The memory effect was found after 2266h (94,41 days), when r was equal to 0,2. On the other hand, the spectral density (Figure 8B) shows that the cut-off frequency was very low at this point, so that only the visualization of a single 24h cycle of low spectral density was possible. A B Figure 7 – Original series for temperature (T) and relative humidity (RH), showing moving averages (A) and the graphs of the respective residuals from smoothing x moving average (B) measured at the station in the gallery of the river for the period from April 1 to December 11, 2009. Campinas, SeTur/SBE. Tourism and Karst Areas, 4(1), 2011. 38 Lobo. Monitoring of water temperature of the Roncador river A B Figure 8 – Functions of autocorrelation (A) and spectral density (B) for the series of air temperature at the station in the gallery of the river. 3.2. Water temperature The results of the monitoring of the temperature of the water with the measures of dispersion and central tendency of the series collected are presented in Figure 9. The temperature of the water was coldest on July 27, with a temperature of 17,1 °C between 5:00h and 15:30h. On the other hand, the maximum was registered in November, reaching 19,3 °C between 16h on November 28 and 4h on the 29th. For most of the days monitored, the variation in daily temperature was zero. The only unusual value was registered for July 27, when this variation reached 0.8 °C. On a daily scale, the high, low and mode were the same. Table 1 presents the descriptive statistics for water temperature on a monthly scale. Although the annual series was incomplete and rainfall was not measured, the increase of the temperature of the water during November and December, as well as the decrease in the months of June through August are in agreement with historical rainfall data for the region, with summer (December to February) registering the most rain and winter (July to August) the least (GUTJHAR; TARIFA, 1993). In July, the daily temperature variation was the greatest, 0.8 °C, which gave rise to a sudden increase in the temperature of the water on July 22. In the same month, a daily variation of 0.6 °C was also found, as well as other lesser variations in the range of 0.1 °C to 0.2 °C on 18 other days of the month; hence, July was the month with the greatest variation in temperature of the Roncador river. Figure 9 – Simplified series of water temperature at station in the river gallery, with measures of dispersion (maximum and minimum) and central tendency (mode) for the period from April 1 to December 11, 2009. Campinas, SeTur/SBE. Tourism and Karst Areas, 4(1), 2011. 39 Lobo. Monitoring of water temperature of the Roncador river Table 1 – Measures of dispersion and central tendency for the water temperature on a monthly scale. Measure April May June July Aug. Sept. Oct. Nov. Dec. Maximum (°C) 18,40 18,40 18,30 18,20 18,20 18,40 18,60 19,30 19,20 Average (°C) 18,40 18,29 18,23 17,79 17,88 18,22 18,37 18,91 19,07 Mode (°C) 18,40 18,30 18,20 18,00 17,90 18,20 18,30 18,90 19,10 Minimum (°C) 18,30 18,00 18,10 17,10 17,40 18,10 18,00 18,60 18,90 Daily variation (°C) 0,10 0,10 0,10 0,80 0,10 0,20 0,20 0,30 0,10 Standard deviation 0,005 0,066 0,048 0,304 0,191 0,063 0,150 0,154 0,075 On the other hand, on a broader time scale, the temperature variation during the entire period of 8 months and 11 days was minimal, showing the great thermal stability of the water. The variation during the entire period was 2.2 °C, with an average of 18,29 °C and a mode and median of 18,3 °C. The temperature series for the water was also analyzed by statistical techniques for temporal series. Figure 10 shows the results for the moving average and the autocorrelation function. For the analysis of the temperature of the water, a series of 6120h (255 days) was adopted. The smoothing of the series did not generate any major variation in relation to the original data collected (Figure 10A). Even for those days of greatest variation in temperature in July, the residuals generated did not surpass 0.1 °C, showing that the variation was gradual and slow. The autocorrelation function (Figure 10B) supports the conclusion of a system with low dynamics of exchange, especially in comparison with the dynamics of the gallery of the river; the memory effect was 1851h (77,12 days). On the other hand, the dynamics of the water was greater than that of the air at this point in the cave, as shown by the autocorrelation function of air temperature presented in Figure 8A. Based on the data collected, an attempt was made to identify the existence of a relationship between the variation of the temperature of the water and that of the air in an attempt to verify the role of water as a vector in the dispersion of atmospheric impacts. For this purpose, the results of correlation tests were crossed with those of the temperature series (Figure 11). The temperature of the air at the point monitored in the gallery of the river had a low correlation with that outside the cave, with a total lag of 435h (Fig. 11A). This values differs from that at other points monitored in the gallery of the river, and even in one of the upper galleries (LOBO et al., 2009), where the lags differed between 1 and 4 hours. On the other hand, Figure 11B shows the high correlation between the temperatures of the water and air at this point in the gallery of the river, with an index of 0.422 in the zero interval. B A Figure 10 –original temperature series for the water and the moving average (A) and respective autocorrelation function (B) for the period from April 1 to December 11, 2009. Campinas, SeTur/SBE. Tourism and Karst Areas, 4(1), 2011. 40 Lobo. Monitoring of water temperature of the Roncador river A B Figure 11 – Cross correlations between external air temperature and that at the collection point in the gallery of the river (A) and between that of the air in the gallery of the river and that of the water (B) The time it takes for the water of the Roncador river to traverse the distance from the swallet to the region of the ressurgence varies from 44 to 51h 20min (AYUB, 2007). With this, the water suffers little influence from the external temperature, an influence limited to specific points and the limited variation mentioned in Table 1. The water thus takes on the thermal characteristics of the rock, which, in the long run, governs the thermal system of caves (FREITAS; SCHMEKAL, 2003; LUETSCHER; JEANNIN, 2004). This is especially true in the case of confined underground aquifers, such as is the case of the Pérolas-Santana system, which for much of the trajectory is a freatic system without any contact with the underground atmosphere. On the other hand, the low correlation between the air temperatures outside and inside the cave at this point reveals a limited gas exchange, which may be caused either by the rise of masses of warmer air to the upper galleries or by the gradual difference in air density generated by the differences in temperature and relative humidity, which causes a certain atmospheric isolation along part of the gallery of the river, and which may indeed extend for the entire trajectory after this point. These results show the importance of water temperature in the maintenance of the stationary state of the thermal system of the cave of Santana after this stretch of the river gallery, where a buffer effect on temperature is introduced These results corroborate those of Pflitsch; Piasecki (2003), who affirm that the water is much more influential in thermal alterations than are air currents, since the water has a greater capacity for the retention of heat. As a result of this behavior, it seems that hypothesis that the impacts generated by visitation of the downstream gallery of the river and that of the upper galleries should not be extended to the deeper regions of the cave. This hypothesis is in agreement with what is known about the movement of masses of air as a function of the direction of water flow (CIGNA, 1967) or even variation in the depth of bodies of water, which show an effect of air movement resembling a piston (PULIDO-BOSCH et al., 1997). The effect of the water temperature on the dynamics of the circulation of energy in the cave of Santana is clear. In caves with active rivers, the courses of the water are the main determinants in the energy balance (see article by Arrigo Cigna in this volume of the journal). In the cave of Santana, the data presented show the influence of water in the energy balance for a large part of the cave, which complements with details the results of the studies of Lobo; Zago (2007) on the energy flow in a cave from the perspective of the analysis of Heaton (1986). This influence decreases in importance in the regions close to the resurgence and in the upper galleries, where the energy balance is strongly influenced by air currents. 4. CONCLUSIONS Based on this study in the cave of Santana, it is possible to conclude that: The temperature of the water exerts an influence on the temperature of the air in the gallery of the river up to 300m from the resurgence. Given the dynamics of the Roncador river and the physical shape of the galleries of the cave of Santana, these results can be extended to the Campinas, SeTur/SBE. Tourism and Karst Areas, 4(1), 2011. 41 Lobo. Monitoring of water temperature of the Roncador river gallery of the river upstream from the monitoring station. Based on the mechanism of thermal regulation linking the water in the Roncador river and the atmosphere of the cave, the impacts from visitation to downstream areas and in the upper galleries are not the same as those observed for this point and upstream from it. Therefore, monitoring the temperature of the water has proved to be an efficient tool for speleotourist management, making it possible to establish a limit for sustainability in the face of impacts from touristic visitation. Its use can contribute to the establishment of hydrothermal zones inside a cave with distinct patterns of variation in temperature and relative humidity. Moreover, the patterns of water temperature identified may also contribute to the classification of the levels of energy circulation in a cave, thus serving as an important indicator for speleological management and of dispersion and/or accumulation of the impacts of visitation. ACKNOWLEDGEMENTS The authors would like to acknowledge the suggestions of prof. Emerson Galvani (FFLCH/USP), which have contributed to an improvement in the original manuscript, and also prof. Linda Gentry El-Dash (Unicamp) for the translation of the final text. REFERENCES AYUB, S. Aplicação de rhodamina-WT no estudo hidrológico de sistemas cársticos em Iporanga, estado de São Paulo. Espeleo-Tema, Campinas, v.19, p.1-14, 2007. BUECHER, R.H. Microclimate study of Kartchner caverns, Arizona. Journal of Cave and Karst Studies, Huntsville, v.61, n.2, p.108-120, 1999. CARRASCO, F.; VADILLO, I.; LIÑÁN, C.; ANDREO, B.; DURÁN, J.J. Control of environmental parameters for management and conservation of Nerja cave (Malaga, Spain). Acta Carsologica, Ljubljana, v.31, n.1, p.105-122, 2002. CIGNA, A. A. An analytical study of air circulation in caves. International Journal of Speleology, Bologna, v.3B, n.1/2, p.42-54, 1967. CIGNA, A.A.; FORTI, P. The environmental impact assessment of a tourist cave. In: UIS (ed.) CAVE TOURISM INTERNATIONAL SYMPOSIUM AT-170 ANNIVERSARY OF POSTOJNSKA JAMA, 1988, Postojna (Yugoslavia), Proceedings. Postojna: UIS, 1988. p. 29-38. DUBLYANSKY, V.N.; DUBLYANSKY, Y.V. The problem of condensation in karst studies. Journal of Cave and Karst Studies, Huntsville, v.60, n.1, p.3-17, 1998. FERNÁNDEZ-CORTÉS, A.; CALAFORRA, J.M.; SÁNCHEZ-MARTOS, F. Spatiotemporal analysis of air condition as a tool for the environmental management of a show cave (Cueva del Agua, Spain). Atmospheric Environment, v.40, p. 7378-7394, 2006. FERRARI, J.A.; KARMANN, I. Comportamento hidrodinâmico de sistemas cársticos na bacia do rio Betari, município de Iporanga-SP. Geologia USP Série Científica, São Paulo, v.8, n.1, p.1-13, 2008. FREITAS, C.R. de; SCHMEKAL, A. Condensation as a microclimate process: measurement, numerical simulation and prediction in the Glowworm cave, New Zealand. International Journal of Climatology, v.23, p.557-575, 2003. GERARDI, L.H. de O.; SILVA, B.C.N. Quantificação em geografia. São Paulo: Difel, 1981. 161 p. GPME – GRUPO PIERRE MARTIN DE ESPELEOLOGIA. Mapa da caverna de Santana. São Paulo: GPME, 2009. 1 mapa. Escala 1:500. Campinas, SeTur/SBE. Tourism and Karst Areas, 4(1), 2011. 42 Lobo. Monitoring of water temperature of the Roncador river GUTJAHR, M.R.; TARIFA, J.R. Critérios relacionados a compartimentação climática de bacias hidrográficas: a bacia do rio Ribeira de Iguape-SP. In: SIMPÓSIO BRASILEIRO DE GEOGRAFIA FÍSICA APLICADA, 5, 1993, São Paulo. Anais. São Paulo: USP, 1993. p.447-449. HEATON, T. Caves: a tremendous range in energy environments on earth. National Speleological Society News, Huntsville, v.08, n.44, p.301-304, 1986. IGC – INSTITUTO DE GEOCIÊNCIAS DA USP. Mapa da caverna de Santana. São Paulo: IGc/USP, 1991. 1 mapa. Escala 1:500. KARMANN, I. Evolução e dinâmica atual do sistema cárstico do Alto Vale do Rio Ribeira de Iguape, Sudeste do estado de São Paulo. 1994. 228 p. Tese (Doutorado em Geoquímica) – Instituto de Geociências, Universidade de São Paulo, São Paulo. 1994. LAROCQUE, M.; MANGIN, A.; RAZACK, M.; BANTON, O. Contribution of correlation and spectral analyses to the regional study of a large karst aquifer (Charente, France). Journal of Hydrology, v.205, p.217-231, 1998. LOBO. H.A.S. Método para avaliação do potencial espeleoturístico do Parque Nacional da Serra da Bodoquena, MS. Caderno Virtual de Turismo, Rio de Janeiro, v.7, n.3, p.99-110, 2007. LOBO, H.A.S. Capacidade de carga real (CCR) da caverna de Santana, PETAR-SP e indicações para o seu manejo turístico. Geociências, Rio Claro, v.27, n.3, p.369-385, 2008. LOBO, H.A.S.; ZAGO, S. Classificação dos níveis de circulação de energia no circuito turístico da Caverna de Santana – PETAR – Iporanga, SP. In: ENCONTRO BRASILEIRO DE ESTUDOS DO CARSTE, 2, São Paulo, Brasil. Resumos expandidos e simples. São Paulo: Redespeleo, 2007. p.113-122. LOBO, H.A.S.; PERINOTTO, J.A. de J.; POUDOU, S. Análise de agrupamentos aplicada à variabilidade térmica da atmosfera subterrânea: contribuição ao zoneamento ambiental microclimático de cavernas. Revista de Estudos Ambientais, Blumenau, v.11, n.1, p.22-35, 2009. LOBO, H.A.S.; MARINHO, M. de A.; TRAJANO, E.; SCALEANTE, J.A.B.; ROCHA, B.N.; SCALEANTE, O.A.F.; LATERZA, F.V. Projection of tourist scenario integrated with environmental fragility maps: a framework to the provisory tourist carrying capacity in caves in Brazil. 2011. Article in analysis for publication. LUETSCHER, M.; JEANNIN, P.Y. Temperature distribution in karst systems: the role of air and water fluxes. Terra Nova, v.16, n.6, p.344-350, 2004. MANGIN, A. Pour une meilleure connaissance des systems hydrologiques à partir des analyses corrélatoire et spectrale. Journal of Hydrology, v.67, p.25-43, 1984. MANGIN, A.; BOURGES, F.; D’HULST, D. La conservation des grottes ornées: um problème de stabilité d´un système naturel (l´e exemple de la grotte préhistorique de Gargas, Pyrénées françaises). Sciences de la Terre et des Planètes, v.328, n.5, p.295-301, 1999. MARINHO, M. de A. Contribuição à geomorfologia cárstica do Vale do Betari, Iporanga – Apiaí, São Paulo. 1992. 73 p. Trabalho de conclusão de curso (Graduação em Geografia) – Faculdade de Filosofia, Letras e Ciências Humanas, Universidade de São Paulo, São Paulo. 1992. PIASECKI, J.; SAWINSKI, T.; STRUG, K.; ZELINKA, J. Selected characteristics of the microclimate of the Demänovská Ice cave (Slovakia). In: ZELINKA, J. (Ed.) INTERNATIONAL WORKSHOP ON ICE CAVES, 2, Liptovsky Mikulas, 2006. Proceedings. Liptovsky Mikulas, Slovak Caves Administration, 2006. p.50-61. Campinas, SeTur/SBE. Tourism and Karst Areas, 4(1), 2011. 43 Lobo. Monitoring of water temperature of the Roncador river PFLITSCH, A.; PIASECKI, J. Detection of an airflow system in Niedzwiedzia (Bear) cave, Kletno, Poland. Journal of Cave and Karst Studies, v.65, n.3, p.160-173, 2003. PFLITSCH, A.; PIASECKI, J.; SAWINSKI, T.; STRUG, K.; ZELINKA, J. Development and degradation of ice crystals sediment in Dobsinska ice cave (Slovakia). In: ZELINKA, J. (Ed.) INTERNATIONAL WORKSHOP ON ICE CAVES, 2, Liptovsky Mikulas, 2006. Proceedings. LIptovsky Mikulas, Slovak Caves Administration, 2006. p.38-49. PULIDO-BOSCH, A.; MARTÍN-ROSALES, W.; LÓPEZ-CHICANO, M.; RODRÍGUEZ-NAVARRO, M.; VALLEJOS, A. Human impact in a tourist karstic cave (Aracena, Spain). Environmental Geology, Berlin, v.31 n.3/4, p.142-149, 1997. ROCHA, B.N. Estudo microclimático do ambiente de cavernas, Parque Estadual Intervales, SP. 2010. 107 p. Dissertação (Mestrado em Geografia Física) – Faculdade de Filosofia, Letras e Ciências Humanas, Universidade de São Paulo, São Paulo. 2010. VIANA JÚNIOR, O. Hidroquímica, hidrologia e geoquímica isotópica (O e H) da fácies de percolação vadosa autogênica, caverna Santana, Município de Iporanga, Estado de São Paulo. 2002. 113 p. Dissertação (Mestrado em Geoquímica) – Instituto de Geociências, Universidade de São Paulo, São Paulo. 2002. Fluxo editorial: Recebido em: 04.03.2011 Corrigido em: 19.04.2011 Aprovado em: 23.05.2011 TOURISM AND KARST AREAS (formally/formalmente: Pesquisas em Turismo e Paisagens Cársticas) Brazilian Society of Speleology / Sociedade Brasileira de Espeleologia (SBE) www.cavernas.org.br/turismo.asp Campinas, SeTur/SBE. Tourism and Karst Areas, 4(1), 2011. 44
Baixar