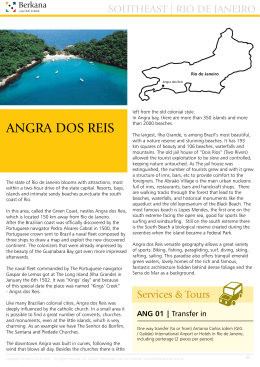
HEMATOLOGICAL VALUES OF JUVENILE GREEN TURTLES (Chelonia mydas) CAPTURED IN THE COAST OF ANGRA DOS REIS AND PARATY, SOUTH OF RIO DE JANEIRO STATE Marcon M.1, Gitirana H. M.1,2, Werneck M. R.1, Lobo-Hajdu G.1,2 1Projeto PROMONTAR-ANGRA, Avenida Brasil, 21, Vila Residencial de Mambucaba, Paraty- RJ, CEP 23.970-000, Brasil. 2Laboratório de Genética Marinha (LGMar), Departamento de Genética, Universidade do Estado do Rio de Janeiro, Rua São Francisco Xavier, 524, PHLC, Salas 224 e 205, Maracanã, Rio de Janeiro - RJ, CEP 20.550-013, Brasil. Introduction Results and discussion The coastline of Angra dos Reis and Paraty, south of the State of Rio de Janeiro, collects oceanographic and biological characteristics sufficient to house the species of sea turtles. However, very little is known about these and animals in the area, leaving sporadic communications in the scientific literature to proximal areas. The health status of these endangered animals is essential to develop conservation plans based on the assessment of population health condition [1,2,4,3]. most There is a small amount of information about the hematological values of wild sea turtles, most studies based on samples kept in captivity turtles. Hematologic values of these animals may show a significant difference resulting from an artificial diet, stress, etc. [1]. In this sense, the objective of this study was to investigate the hematological values of green turtles (Chelonia mydas) caught off the coast of Angra dos Reis and Paraty, at PROMONTARANGRA Project. The curve carapace length obtained from the sea turtles of this study was 39.7±7.8 (29-60) cm and weight 6.9±3.7 (2.5-21.4) kg. The mean and standard deviation values (mean ± SD) obtained in the blood count of 33 individuals of Chelonia mydas are described in the table below. Table 1. Mean, standard deviation, maximum and minimum values for hematological patterns of the samples. Mean ± SD Minimum - Maximum Red blood cell( 106 /µl) 0.49 ± 0.13 0.25 – 0.90 Hematocrit (%) 30.41±04.06 22.0 – 49.0 Hemoglobin (g/dl) 10.13 ± 1.98 7.3 – 16.30 667.34±155.07 386 – 1088.8 34.2±29.1 33.0 – 37.0 3782.12±2452.13 1000 - 9000 Monocytes (/µl) 258.31±668.75 0 - 3360 Lymphocytes (/µl) 98.61±222.79 0 - 960 Heterophil (/µl) 647.32±1125.52 24 - 4160 Eosinophils (/µl) 199.23±539. 0 - 2560 Basophi (l/µl) 13.71±65.25 0 - 320 Parameter VCM fl MCHC (g/dl) Materials and methods WBC (/dl) During the period June/2013 and June/2014 were captured 33 juveniles of-green turtles from freediving in three different parts of the region. After capture, the biometric procedures were performed, marking the frontal flippers (metal clips transferred by TAMAR-ICMBio) and blood collection from the cervical dorsal venous sinus puncture. All individuals selected for this study were clinically healthy with robust body condition and had no apparent fibropapillomas. A B With respect to morphological classification of the cells were found six cell types: red blood cells, lymphocytes, monocytes, heterophile, eosinophils, basophils. It is known that the hematological values may be influenced by many biological factors such as age, size, sex, body condition, diet, season and habitat [1]. The hematological values found in this study differ from those described by other authors. This strengthens the necessity of establishing specific hematological values for each population, also considering the characteristics such as the size of the animals and the methodology used. Figure 1. Diving for intentional capture of sea turtles (A); Measurement of biometric data (B). Hematological samples were placed in tubes containing sodium heparin, being kept at low temperatures until arrival in the laboratory. The blood count was performed using total cell count in a Neubauer camera and differential counts in blood smears. A B C Conclusions The results of this study point to the possibility of a local hematological pattern, which can be distinguished from other described by other authors for free living sea turtles of the same species and age. Acknowledgments Eletrobras Termonuclear S/A-Eletronuclear. Figure 2. Blood sampling is performed in the field (A and B). Procedure performed in the laboratory © References 1. 2. 3. 4. Bolten, A. B. ; Bjorndal, K. A. 1992. Blood profiles for a wild population of green turtles (Chelonia mydas) in the southern Bahamas: sizespecific and sex-specific relationships. J Wildl Dis 28:407–413 Eckert, K.L.; Bjordnal, K.A.; Abreu-Grobois, F.A..; Donnelly, M. 2000. Técnicas de Investigación y Manejo para la Conservación de las Tortugas Marinas. Vol.4. Consolidated Grafic Communications, Pennsylvania. 265p. IUCN 2014. Red List of Theatened Species. Disponível em <http: //www.iucnredlist.org>. Acesso em 15 mar. 2014. Santos, M. R. D.; Ferreira, L. S.; Batistote, C.; Grossman, A.; Bellini, C. 2009. Valores hematológicos de tartarugas marinhas Chelonia mydas (Linaeus, 1758) juvenis selvagens do Arquipélago de Fernando de Noronha, Pernambuco, Brasil. Braz. J. Vet. Res. Anim. Sci., 46:491-499.
Baixar