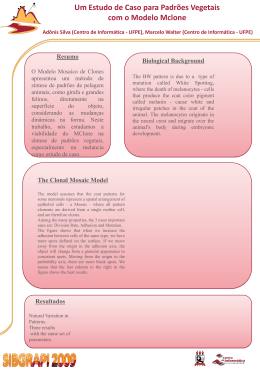
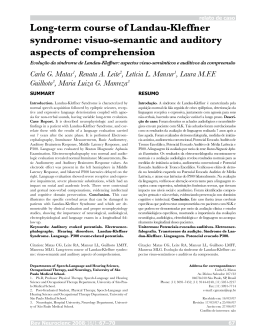
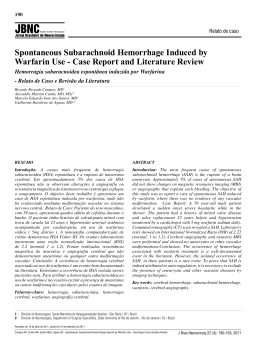
Otimização de trade-offs no gerenciamento
de cadeias de suprimentos verdes
Gabriel Alves Jr.
[email protected]
Orientador: Dr. Paulo Maciel
Co-Orientador: Dr. Ricardo Massa
Agenda
•
•
•
•
•
•
•
Contexto
Métricas
Modelos
Estudo de Caso
Conclusões
Links
Referências
Contexto
• Cadeia de suprimentos verdes
– Mudanças para melhorar o processo podem
impactar métricas ambientais
Contexto
• Classificação dos Indicadores de
Sustentabilidade
Indicador de
Sustentabilidad
e
Social
Objetivo
Subjetivo
Ambiente
Objetivo
Subjetivo
Econômico
Objetivo
Subjetivo
Métricas
• Exergia
– Eficiência da energia (depende da fonte e do
sistema)
– Permite comparar fontes diferentes
– Pouco suporte/dados
• Global Warming Potential (GWP)
– Compara o impacto de diferentes recursos com os
efeitos do CO2
– Considera a origem/destinação dos recursos
– Bom suporte/apelo prático
Métricas
• Esquema gráfico para a
definição dos rewards
• Exergia
– Consumo energético
• GWP
– Detritos
– Consumo de energia em separado
Tabela 5.8 Entradas e saídas dos elementos do componen
Modelos
Elemento
• Componentes
Saíd
Entradas
pMPRCi
-
-
pPPRCi
-
-
pRPRCi
-
-
tiPRCi
-
-
toPRCi
-
-
t pPRCi
insumos, água, energia
água, d
energéticas bastante utilizadas em processos de manufatura. Entre
derar o trabalho humano e as matérias-primas utilizadas na produç
Os detritos sólidos
bastante comuns nos processos de ma
– Logística de entrada e saída (puxada/empurrada),
e sãoreversa
dem ser decorrentes de sobras das matérias-primas, embalagens, o
massa/água devido a processos como o de cozimento e secagem. O
– Manufatura (baseados em Desrochers)
costuma ser bastante intensivo para alguns tipos de processo. Isto p
na indústria de alimentos e em metalúrgicas. Muitas vezes a água u
– Stochastic Reward nets (SRNs)
por isso ela também é considerada nas saídas deste componente.
ppDual
pstDual
${M}
${S}
${n}
pst
tp
pp
td
${n}
PRD
Figura 5.17 Componente GSPN para representar p
O componente apresentado na Figura 5.17 é uma GSPN defi
TPRDi ,
PRDi ,
IPRDi , OPRDi , HPRDi , gPRDi , ssPRDi , m 0 PRDi , WPRDi
PPRDi = { ppPRDi ,ppDualPRDi ,pstPRDi ,pstDualPRDi } e TPRDi = { td
vos conjuntos ordenados de lugares e transições, sua estrutura pode
mente como
Consumidor
Transporte
Intermediário
Transporte
Produtor
Modelos
CAPÍTULO 5 – PROPOSTA
114
• Parâmetros Ambientais dos Componentes
Tabela 5.9 Entradas e saídas dos elementos do componente de fluxos.
Inputs
Entradas
Outputs
Saídas
poFLWi
-
-
psFLWi
-
-
pstFLWi
-
-
pstDualFLWi
-
-
ptFLWi
-
-
pt0FLWi
-
-
pt1FLWi
-
-
pt2FLWi
-
-
taFLWi
insumos, energia
detritos,co2
toFLWi
insumos, energia
-
tsFLWi
-
-
tt0FLWi
insumos, energia
detritos,co2
tt1FLWi
insumos, energia
detritos,co2
Elemento
Element
Modelos
• Modelo de Otimização
– Goal Programming
– Metas definidas
empiricamente, ou
por outro modelo de
otimização
– Pesos (ωx) definidos
empiricamente ou com AHP
– Visa à redução do consumo
de energia e recursos,
geração de detritos,
destruição de exergia,
geração de GWP e objetivos
de negócio (bo)
Estudo de Caso
• OBJETIVO: Otimizar a utilização das
máquinas da linha de produção
considerando um possível aumento de
45% na demanda
– A demanda precisa ser atendida com um desvio
negativo de no máximo 10%
– Deve-se definir a quantidade e o tipo das máquinas
utilizadas em cada etapa da linha de produção
(ex.: na fase de embalagem a vácuo pode-se
utilizar 2 máquinas de grande porte e uma de
pequeno porte).
Estudo de Caso
• Linha de produção
RN model.
Estudo de Caso
(a) BPM for the production line.
(b) BPM for the vacuum packaging.
(d) Part of the SRN equivalent to the BPMN model.
Estudo de Caso
• Os cenários foram criados utilizando o GP
apresentado considerando os seguintes
critérios
– Cenário 1: atual (referência demanda 4 ton/h)
– Cenário 2: otimizado, considerando metas
ambientais
– Cenário 3: otimizado para demanda maior (45%),
sem considerar metas ambientais
– Cenário 4: otimizado para demanda maior (45%),
considerando metas ambientais
• Análise de sensibilidade feita com SRNs
their usage. For instance, cellulose casings are used to provide
shape to sausages and other products, and are completely
discarded after the cooking process. This type of organic waste
must be discarded cautiously, generally using composting
We estimate this kind of waste based on knowledge of the
product’s10composition.
Estudo de Caso
012
TABLE III
• GP para o cenário 3
P RODUCTION LINE PARAMETERS .
the first experiment is simplified becoming:
minimize
t∈T
(ndRt + pdRt )
subject to
Qp
p∈Pt
p
+ ndRt − pdRt = 5.8, ∀t ∈ T
ndRt ≤ 0.58, ∀t ∈ T
ndRt pdRt = 0, ∀t ∈ T
p∈Pt
Parameter
Delay
Rate
Energy Sources
Electricity (kWh)
Waste
Cardboard (kg/ton)
Wood (kg/ton)
Dense Plastic (kg/ton)
Ferrous Metal (kg/ton)
Non-Ferrous Metal (kg/ton)
Grinder
0.250
4.000
Stage 1
Emulsifier
Moister
0.167
0.167
6.000
6.000
36.000
11.000
110.000
3.742
0.152
0.917
0.344
0.036
-
-
Parameter
Small
Linker
1.250
0.800
Stage 2
Big
Medium
Linker
Linker
0.556
0.769
1.800
1.300
12.000
-
13.000
-
1.370
3.084
2.227
Stage 3
Dry
Chiller
Delay
Rate
Energy Sources
Electricity (kWh)
Natural Gas (m3/h)
Waste
Water (liters/ton)
Water (liters/h)
Film Plastic (kg/ton)
15.000
-
Oven
Sprinkler
Tank
1.175
0.851
0.392
2.554
1.000
1.000
30.000
26.800
-
2.200
-
-
353.749
-
342.857
-
Packers
Big
Small
Peeler
Parameter
The third experiment uses the same optimization model
as the
VacVacuum
uum
first one, but also increases the goal rate by 45% just as the sec0.370
0.400
0.455
0.200
0.200
0.625
Delay
2.700
2.500
2.200
5.000
5.000
1.600
Rate
ond scenario does. Therefore, this experiment also addresses
Energy Sources
2.200
17.400
15.300
87.000
2.200
5.000
(kWh)
Electricity
the environmental goals and utilizations when GR = 5.8.
The
Waste
6.287
Organic Material
number of machines for each pool Q p resultant from
the (kg/ton)
optimization models are depicted in Table IV. These values
The system works as a pipeline, where the tasks are
the number of machines in the pool and for each machine, the
parameters p , EL p, NG p , Wp , GW Pp, Xloss p are, respectively,
its rate, the amount of electricity that it consumes, the amount
of natural gas that it consumes, the amount of waste it
generates, its GWP, and the exergy losses. Since variable Q p
is an integer, the optimization model should be defined as
a mixed integer programming (MIP) [11]model. We use the
grinder to model production line demand, hence the set T does
not take it into account. The objective of the following models
is to find the optimal number of machines Q p in each pool,
considering a hypothetical situation where
could
Rt the machines
Rt
operate at their maximum rate. In this way, a reduction in the
t∈T
utilization gap of the system can be expected.
Let E , W , GW P , Xloss , and R be the weights assigned
to reduce energy consumption, waste, GWP, exergy losses and
the difference between the goal rate (GR ) and the maximum
rate of the pool. These weights were set according to stakep GEL , GNG
Rt, GW , GGWRP ,t GXloss ,
holder expectations. Inpaddition,
and GR are p∈P
the respective
goals
for
electricity
consumption,
t
natural gas consumption, waste generation, resultant GWP,
exergy losses,
Rt and task rate. The goal rate GR is equal for
every task pursuing a synchronized operation, thus reducing
the utilization gap. The deviational variables of the energy
Rt
Rt
source refer to the consumption of electricity (ndEL and pdEL )
p∈P
and natural
gast (ndNG and pdNG ), although the weight constant
is shared between both variables. In addition, the following
experiments include a restriction that imposes a lower limit of
10% of the desired rate for each task.
The first experiment considers a goal rate of 4 tons/ hour
for each task (GR = 4). This objective is the current maximum
grinder rate. The goal programming (GP) is defined below. The
value of each goal of the GP, except for the goal rate, was
defined through a linear programming whose aim was to find
its minimal value. The objective of this linear programming
is the same expression as the goal constraint, without the
deviational variables. Furthermore, all deviational variables
and the objective constraints are also removed in the linearp
their usage. For instance, cellulose casings are used to provide
p∈P
to sausages and other products, and are completely
shape
10
Qp ∈ N
discarded after the cooking process. This type of organic waste
ndR ≤ 0.1GR, ∀t ∈ T
cautiously, generally using composting
ndEL pdEL = ndNG pdNG must
= ndW pdWbe
= nddiscarded
GWP pdGW P =
rst experiment is simplified becoming: ndX pdX = ndR pdWe
R = 0estimate this kind of waste based on knowledge of the
t∈T
product’s composition.
minimize
(nd + pd )
Qp
p
+ ndRt − pdRt = GR , ∀t ∈ T
t
Estudo de Caso
t
loss
t
loss
t
The evaluation stakeholders also expressed their expectations
TABLE III
of a considerable increment of demand in the next year. The
P RODUCTION LINE PARAMETERS .
second and third optimization models were thus constructed
Stage 1
with an increment of 45% in the goal rate (GR = 5.8). The
Emulsifier
Moister
Grinder
Parameter
second experiment was carried out
without taking into account
0.167
0.167
0.250
Delay
environmental goals, thus the optimization
model
presented
for
6.000
6.000
4.000
Rate
the first experiment is simplifiedEnergy
becoming:
Sources
• Para embutimento:
subject to
Q
+ nd − pd = 5.8, ∀t ∈ T
nd ≤ 0.58, ∀t ∈ T
nd pd = 0, ∀t ∈ T
Electricity (kWh)
minimize
t∈T
(ndRt + pd
Rt )
Waste
subject to
Qp
+
p
p∈Pt
Cardboard (kg/ton)
Wood (kg/ton)
Dense Plastic (kg/ton)
Ferrous Metal (kg/ton)
ndRt −Non-Ferrous
pdRt = 5.8,
∀t ∈ T
Metal (kg/ton)
ndRt ≤ 0.58, ∀t ∈ T
36.000
11.000
110.000
3.742
0.152
0.917
0.344
0.036
-
-
1) 0.8 SLINKER + 1.3 MLINKER +
ndR pdR = 0, ∀t Delay
∈T
1.8 BLINKER + nd_LINKING + p∈P
Rate
Energy Sources
pd_LINKING = 5.8
12.000
Electricity (kWh)
hird experiment uses the same optimization
modeluses
as thethe
Gas (m3/h) model as the
Natural
The third experiment
same
optimization
Waste
first
one,
but
also
increases
the
goal
rate
by
45%
just
as
the
secone, but also increases the goal rate by 45%
just as the sec-Waterexperiment
(liters/ton) also addresses
ond scenario does. Therefore, this
2)
nd_LINKING
<=
0.58
Water (liters/h)
the environmental
goals and utilizations
GR = 5.8. The
scenario does. Therefore, this experiment
also addresses
1.370
(kg/ton)
Film Plasticwhen
number of machines for each pool Q p resultant from the
nvironmental goals and utilizations when
GR models
= 5.8.
TheParameter
Peeler
optimization
are depicted
in Table IV. These values
nd_LINKING
* pd_LINKING
= to0 change
used
the SRN pictured in Figure 3(d). It is
ber of 3)
machines
for each
pool Q were
resultant
from
the throughput of the machines
important to highlight that theDelay
0.625
mization models are depicted in Table IV. These valuesRate
1.600
Energy Sources
used to change the SRN pictured in Figure 3(d). It isElectricity (kWh)
5.000
Waste
rtant to highlight that the throughput of the machinesOrganic Material (kg/ton)
6.287
sed with the SRN are expected to be lower than the
t
t
t
Parameter
Small
Linker
1.250
0.800
Stage 2
Big
Medium
Linker
Linker
0.556
0.769
1.800
1.300
13.000
-
15.000
-
3.084
2.227
Stage 3
Dry
Chiller
Oven
Sprinkler
Tank
1.175
0.851
0.392
2.554
1.000
1.000
30.000
26.800
-
2.200
-
-
353.749
-
342.857
-
Big
Vacuum
0.400
2.500
Packers
0.200
5.000
0.200
5.000
Small
Vacuum
0.455
2.200
2.200
87.000
15.300
17.400
2.200
-
-
-
-
-
0.370
2.700
The system works as a pipeline, where the tasks are
of resources, and the consequent occurrence of bottlenecks.
Estudo de Caso
The results provided by the SRN will thus be closer to the
ones presented in the real system. The listing below shows the
TABLE IV
•UMBER
Resultados
N
OF MACHINES IN THE POOL FOR EACH EXPERIMENT.
Pool
Current
EXP 1
EXP 2
MOISTER
1
1
1
EMULSIFIER
1
1
1
SLINKING
2
2
0
MLINKING
1
0
3
BLINKING
1
2
1
OVEN
6
5
7
SPRINKLER
3
2
3
CHILLINGTANK
5
5
6
PEELER
3
3
4
CHILER
1
1
2
DRY
1
1
2
SVACUUM
1
2
3
BVACUUM
2
0
0
SECPACK
2
2
2
Total
31
28
36
EXP 1: Orders’ rate of 4 with environment goal.
EXP 3
1
1
0
0
3
7
3
6
4
2
2
3
0
2
35
Estudo de Caso
• Utilization Gap acumulado
Demanda de 5,8 ton/h
Demanda de 4 ton/h
Estudo de Caso
Throughput do sistema
Consumo relativo de eletricidade
GWP relativo
Consumo relativo de água
Estudo de Caso
• Comparação dos cenários
– AHP poderia ser utilizado para “extrapolar” os dados encontrados
informando qual é o melhor cenário
Demanda de 4 ton/h
Demanda de 5,8 ton/h
Estudo de Caso 2
Estudo de Caso 2
Estudo de Caso 2
Estudo de Caso 2
Estudo de Caso 2
Estudo de Caso 2
Estudo de Caso 2
Estudo de Caso 2
Estudo de Caso 2
Estudo de Caso 2
Estudo de Caso 2
Estudo de Caso 2
Estudo de Caso 2
Estudo de Caso 2
Parte do relatório gerado a partir
do programa apresentado nos
slides anteriores.
Resultados não correspondem à
análise apresentada nos slides
anteriores
Os pesos ao lado podem ser
utilizados no GP do modelo de
otimização apresentado
Conclusões
• Métricas de desempenho ambiental e
operacional
– Exergia provê resultados confiáveis para a
utilização de diferentes fontes de energia e
maquinário
– GWP é uma métrica já bastante aceita
comercialmente e utilizada no LCA
– Impacto de mudanças no processo/falhas sobre
indicadores ambientais
• GP evita um experimento fatorial completo
– Não representa as relações causais da rede
Conclusões
• Estudos de caso reais e de validação
–
–
–
–
Cadeias de suprimentos
Avaliação de diferentes políticas de estoque
Linha de produção
Avaliação da exergia e GWP
Links
•
•
•
•
•
•
•
•
•
Intergovernamental Panel on Climate Change (IPCC): http://www.ipcc.ch/
United States Environmental Protection Agency (EPA): http://www.epa.gov/
– http://www.epa.gov/climatechange/
Energy Information Administration (EIA, US): http://www.eia.doe.gov/
Department for Environment, Food and Rural Affairs (DEFRA, UK): http://www.defra.gov.uk/
Carbon Trust, UK: http://www.carbontrust.co.uk/
Ministério de Minas e Energia (MME, BR): http://www.mme.gov.br/
Ministério de Ciência e Tecnologia (MCT, BR): http://www.mct.gov.br/
World Energy Council: http://www.worldenergy.org/
Green Peace: http://www.greenpeace.org/
– http://www.greenpeace.org.br/
Referências
•
•
•
•
•
•
•
•
•
•
•
•
•
•
•
•
•
•
•
D. Simchi-Levi, P. Kaminsky, and E. Simchi-Levi, Designing and managing the supply chain: concepts, strategies and case
studies. McGraw-Hill, 2000.
“Environmental Protection Agency – EPA”, 2007, last access 10/jan/2009. [Online]. Available: http://www.epa.gov.
WEC, 2007 Survey of Energy Resources. World Energy Council, 2007.
Ministério de Minas e Energia, “Resenha Energética Brasileira – Exercício de 2008”, 2009.
Ministério de Minas e Energia, “Balanço Energético Nacional – Exercício de 2008”, 2009.
Empresa de Pesquisa Energética, last access 14/mar/2009. [Online]. Available: http://www.epe.gov.br
DEFRA - Department for Environment, Food and Rural Affairs, “Environmental Key Performance Indicators – Reporting Guidelines
for UK Business”, 2006.
V. Veleva, M. Hart, T. Greiner, and C. Crumbley, “Indicators of sustainable production,” Journal of Cleaner Production, vol. 9, no.
5, pp. 447 – 452, 2001.
B. M. Beamon, “Designing the green supply chain,” Logistics Information Management, vol. 12, no. 4, pp. 332–342, 1999.
R. Cash and T. Wilkerson, “GreenSCOR: Developing a Green Supply Chain Analytical Tool,” 2003, LMI - Logistics Management
Institute.
J. Cascio, The Iso 14000 Handbook. ASQ Quality Press, 1999.
IPCC, Climate Change 2001: The Scientific Basis. Cambridge University Press, 2001.
IPCC, 2006 IPCC Guidelines for National Greenhouse Gas Inventories. Available: http://www.ipcc-nggip.iges.or.jp/public/2006gl/
G. Bolch, S. Greiner, H. de Meer, and K. S. Trivedi, Queueing Networks and Markov Chains: Modeling and Performance Evaluation
with Computer Science Applications, 2nd ed. New York, NY, USA: John Wiley and Sons, 2006.
G. Balbo, “Introduction to Stochastic Petri Nets,” LNCS 2090, pp. 84–155, 2001.
M. A. Marsan, G. Balbo, G. Conte, S. Donatelli, and G. Franceschinis, Modelling with Generalized Stochastic Petri Nets. John
Wiley and Sons, 1995.
A. Zimmermann and M. Knoke, TimeNET 4.0 User Manual, 2007, http://pdv.cs.tu-berlin.de/∼timenet.
A. A. Desrochers and R. Y. Al-Jaar, Applications of Petri Nets in Manufacturing Systems: Modeling, Control, and
Performance Analysis. Institute of Electrical & Electronics Enginee, 1994.
N. Viswanadham and N. R. S. Raghavan, “Performance analysis and design of supply chains: a Petri net approach,” Journal of
Operations Research Society, pp. 1158–1169, 2000.
Baixar