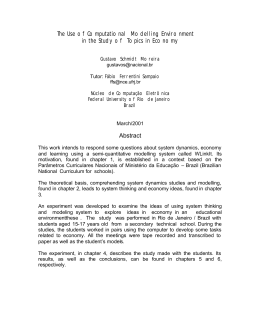
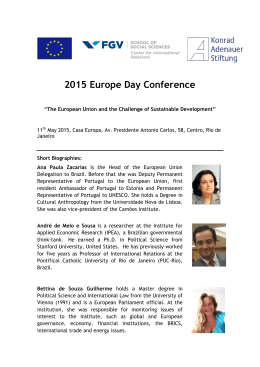
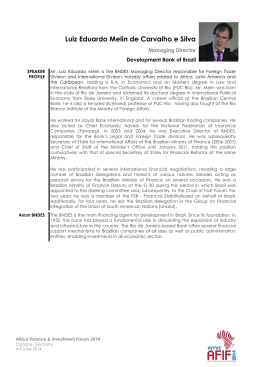
DEMOGRAPHIC DYNAMICS IN BRAZIL
RECENT TRENDS AND PERSPECTIVES
José Alberto Magno de Carvalho
DEMOGRAPHIC DYNAMICS IN BRAZIL
RECENT TRENDS AND PERSPECTIVES*
José Alberto Magno de Carvalho **
INTRODUCTION 1
The Brazilian population has undergone deep demographic changes in the last three decades. This has
brought about important consequences in social and economic terms. The evolution of the Brazilian
population size, its growth rate and relative age structure between 1940 and 1991 as well as its expected
trajectory until 2020 are presented in this paper. After briefly considering the quasi-stability of the
Brazilian population in the past, the role of fast fertility decline is emphasised in the current changing age
structure.
Given the rapid and generalised decline in fertility in Brazil and previous experience in First and Third
World countries, it is quite realistic to suppose that in the end of the 1990s or at the beginning of the next
decade the Brazilian population will show fertility and mortality levels leading to growth rates near zero. In
addition, considering that this trend would place Brazil at the end of the transitional phase, some emerging
points for the demographic research agenda are outlined.
1. QUASI-STABLE POPULATION AND HIGH GROWTH RATES - 1940/1970
Brazil experienced a rapid population increase between 1940-1970 due to its high natural growth since
international migration did not exert a significant role. Total population increased from 43 million to 93
million in the period with an average growth rate (r) of 2.8% per year. Furthermore, despite the average,
there was an increasing trend in the growth pace between the 1940s and the two following decades, when r
increased from 2.4% to 3.0%, respectively.
?? This paper was especially written for this first edition of the Brazilian Journal on Population Studies. This was translated
into Inglish by haydn Coutinho Pimenta and, reviewed by Bárbara Melo and Ana Amélia Camarano.
** Department of Demography and Center for Regional Development and Planning of the Federal University of Minas Gerais
1Laura Rodriguez Wong collaborated in the preparation of this paper.
Content of this paper is partially based on the following articles:
Crescimento Populacional e Estrutura Demográfica no Brasil (Population Growth and Demographic Structure in Brazil).
J.A.M. de Carvalho, 1993; and
A Window of Opportunity: some demographic and socio-economic implications of the rapid fertility decline in Brazil.
(J.A.M. de Carvalho and L.R. Wong, 1995).
The author is grateful to Juarez C. de Oliveira for making it easier the use of data on projections elaborated by the team of the
Department of Population and Social Indicators (DEPIS) of the IBGE ( the Brazilian Census Bureau).
Acceleration in the growth rate was mainly due to decline in mortality with life expectancy at birth
increasing from 44 to 54 years between the 1940s and the 1960s. Fertility was held almost constant and at
high levels during this period. Total Fertility Rate (TFR) experienced a slight decrease, from 6.3 to 5.8
children per woman over these years (Carvalho, 1980). 2 The rapid mortality decline during the period did
not lead to any significant change in age distribution of population. Comparing age structure of the
Brazilian population from 1940 to 1970, a very similar distribution is observed with approximately 52% of
population under age 20 and 3% over 65. This age composition characterised a quasi-stable population
(see Figure 1 for 1970).
2.FERTILITY DECREASE AND LOW POPULATION GROWTH RATES: THE CHANGING
AGE STRUCTURE - 1970/1996
The Brazilian annual average growth rate of of 2.9% between 1960 and 1970, similar to that of the
previous decade. This was not surprising, even for those who were on opposite sides of the debate on birth
control. In view of existing theories there was no reason to expect, fertility decline in the short run and a
consequent slower pace in demographic growth. On the empirical side, one could not count on data about
birth registration, which, apart from being unreliable in most parts of the country, did not have updated
publications. In addition, indirect estimates based on the 1970 Census showed divergent trends with
increasing fertility levels in some regions (the poorest ones) and a slight decline in others (Carvalho, 1974).
Data collected annually during the 1970's - particularly the Pesquisa Nacional por Amostra de Domicílios,
PNAD (General Household Surveys), however, started to show that fertility was declining. It initiated in
the most developed regions and in higher social groups and was gradually expanding to other regions and
social strata. The phenomenon was irrefutably confirmed by the 1980 Census. The enumerated population
was of 119 million people and r fell to 2.4%. This trend persisted in 1980/91: r was less than 2.0%, and
according to the observed age distribution of the 1991 Census, fertility decline was once again responsible
for a slower rate of population growth. Despite continuous and rapid growth of women in reproductive age,
there were less children aged 0 to 4 than those aged 5 to 9 in 1991.
2
In spite of being held in high levels until the 1960s, fertility had a declining trend since the beginning of the Century. During
the first decades of the XX century, rich regions (the South, Rio de Janeiro and São Paulo) showed a fertility level higher
than those of the poor ones (the North and the Northeast). TFR has slowly decreased in all regions until the 1950s, when
there was an increase in fertility which would last until the mid-sixties (See Frias and Carvalho, 1994).
Table 1 presents TFRs for several Brazilian regions during the 1970-1996 period. All of them underwent
significant decline in fertility level in just one decade (1970/80) that surpassed 30% in the East, Rio de
Janeiro, the South and the Mid-West. The Northeast (the poorest region in the country which had 30.2% of
the total Brazilian population in 1980) experienced a surprisingly high decrease of approximately 20%.
The decline in rural fertility was also generalised in the period 1970-1980, with an average decline on a
national level of 22.4% (Fernández and Carvalho, 1986)3
TABLE 1
Brazil and Regions: Population in 1996 and Total Fertility Rates (TFR)
1970 - 1996
Region
Population
(millions)
TFR
Percent Variation
1996
1970
1980
1991
1996
1970 to
1980
1980 to
1991
1991 to
1996
1970 to
1996
the Amazon
10.2
8.1
6.4
4.1
2.7
-21.0
-35.9
-34.1
-66.7
the Center-West
11.6
6.6
4.5
2.7
2.3
-31.8
-40.0
-14.8
-65.2
the Northeast
44.8
7.6
6.1
3.7
3.1
-19.7
-39.3
-16.2
-59.2
the East
19.5
6.5
4.3
2.6
2.4
-33.8
-39.5
-7.7
-63.1
Rio de Janeiro
13.4
4.2
2.9
2.0
2.1
-31.0
-31
+5,0
-50.0
São Paulo
34.5
4.2
3.2
2.2
2.2
-23.8
-31.3
0.0
-47.6
the South
23.5
5.4
3.6
2.5
2.3
-33.3
-30.6
-8.0
-57.4
Brazil
157.1
5.8
4.3
2.8
2.5
-25.9
-34.9
-10.7
-56.9
NOTE:The regions are composed of the following states: the North: Amazonas, Pará, Acre, Amapá, Rondônia and Roraima the Mid-West: Mato Grosso,
Mato Grosso do Sul, Goiás, Tocantins and Federal District; the Northeast: Maranhão, Piauí, Cerá, Rio Grande do Norte, Paraíba, Pernambuco,
Alagoas, Sergipe and Bahia; the East: Minas Gerais and Espírito Santo; Rio de Janeiro: Rio de Janeiro; São Paulo: São Paulo; theSouth: Paraná,
Santa Catarina and Rio Grande Sul. (See Map of Brazil, pp 4)
SOURCES: CARVALHO, J.A.M., DE. “O tamanho da população brasileira e sua distribuição etária: uma visão prospectiva” (The size of Brazilian
population and its age distribution: a prospective view). São Paulo: ABEP, V Encontro Nacional de Estudos Populacionais, 1988, v. 1, pp 33-36.
IBGE, Contagem Geral da População de 1996. (1996 National Population Counting)
BEMFAM , DHS. Brasil : Pesquisa Nacional sobre Saúde e Demografia ; 1996. Rio de Janeiro : BEMFAM; Macro International, 1997.
180p.
SAWYER, D.O. e FREIRE, F.H. (1997): A fecundidade e mortalidade no Brasil (Fertility and Mortality in Brazil) - POP -MUM Project.
Ongoing Research - Belo Horizonte: CEDEPLAR/UFMG
3
The rural population in Brazil has been showing an increasingly lower weight in view of very rapid urbanisation and this
involved massive migratory flows in rural-urban direction. In 1960, the urban population represented only 45% of the total
population, being 56% in 1970, 68% in 1980, and 74% in 1991. Furthermore, the rural population experienced a negative
growth rate in the 1980s. The urban population started to increasingly concentrate in cities with more than 500,000 people.
In 1991, the twenty Brazilian cities with more than 500,000 people concentrated 60% of the urban population and 45% of the
total Brazilian population (Martine, 1994a).
Mapa do Brasil com suas regiões
The most evident effect of fertility decline was a decrease in the population growth rate. As previously
mentioned, during the 1970s, r was 2.4% as opposed to 2.9% in the previous decade. However, while TFR
declined 25.9% as seen in Table 1, r decreased only 14%. The difference was due , first, to its being a
closed population, as the Brazilian population could have been considered at that time. The growth rate is
the difference between the crude birth rate (b) and the crude mortality rate (d). During the 1970s, there was
a mortality decline in the country and d passed from 13% to 10% between the 1960s and the 1970s,
partially offsetting the effect of the fertility decline in terms of population growth. Secondly, with the
fertility decline the annual figure of live births became relatively lower in terms of the total population and
this caused a narrowing of the base of the age pyramid and an increasing of the relative size of the other
age groups, including those of women in the reproductive age. As a result, the annual births as a proportion
of the total population, i.e., b, decreased less than that of 25.9% in fertility decline. This is the reason why
b fell only 17% between the two decades, from 40.8% to 33.7%.
The fall in the proportion of children in the Brazilian population as a consequence of fertility decline in the
1970s can be seen in the results of the 1980 Demographic Census. Between 1970 and 1980, the relative
size of children under 5 years of age decreased from 14.8% to 13.7% and that of the population aged 5 to
9 fell from 14.4% to 12.6%. This is considered the landmark of the Brazilian ageing process.
Data from the 1991 Demographic Census and the 1996 Brazilian Demographic and Health Survey, shown
in Table 1, show a continuation of there fertility decline in Brazil. In only 26 years, the TFR dropped from
5.8 to 2.5 children per woman, corresponding to a decline of 57% in the period or a nearly annual average
fall of 3% in fertility rate. The greatest declines, if the whole period was considered, would be found in
regions where the fertility level was highest in 1970 - the Amazon, the Northeast, the East, and the MidWest - indicating a convergence trend among regional fertility levels. The fact that the greatest and recent
decline in fertility have occured , at present, in the poor regions of the country (the Northeast and the
Amazon) allows us to infer that there is an unquestionable tendency for fertility to converge toward the
lower levels among social groups4.
Given the great heterogeneity in Brazil, a country known as one of the most unequally distributed social
and regional income in the world (PNUD, 1996), a geographically generalised decline in fertility (which
started among the population elite5) could only be true, if it had also reached the poorer population groups.
It should be considered that these low levels of fertility and their convergent trend toward homogenisation
are happenning simultaneously to the well advanced phase of the so-called 'urban transition'(Martine
1994b). According to him, the existence of several metropolitan centers which assemble a significant
portion of the population and the most important economic activities and a fairly balanced network of
urban centers with over 500 cities with 20,000 inhabitants or more represent an excellent base for both
4
There are several studies for localised areas and the country as a whole indicating the homogenisation of levels among the
different population strata. See, for example, Merrick and Berquó (1988); Wood and Carvalho (1988); Campanário and
Morell (1994). Convergence of fertility rates are also discussed in Camarano (1996).
5
Already in 1970, the highest income population strata had their fertility levels below replacement (Wood and Carvalho,
1988).
development and national integration. This 'urban network' has surely contributed to the convergence of
fertility rates in a country like Brazil which, furthermore, traditionally shows intense migratory flows.
Data from the General Population Count of 1996 showed population of 157 million people, corresponding
to r = 1.5% between 1991 and 1996, against 1.9% for the 1980s. These results have been promptly
displayed by the media and viewed with generalised surprise throughout the country. In spite of constant
effort, on the part of demographers to call attention to the rapid decline in fertility in Brazil, even a good
many of the public planners and the most educated strata of the Brazilian society still believe that this
phenomenon is limited to the more privileged classes.
2.1.Population Between 1970 and 1991 - The observed age structure and the corresponding stable
population
At any time, a population has a given fertility and mortality function (age specific fertility and mortality
rates) and an intrinsic growth rate. On the assumption that they remain constant, whatever the initial age
distribution, the population will necessarily become stable, i.e., will have a constant age structure and
growth rate in the long run.
When only mortality varies significantly over time, the observed age structure of a closed population and
its growth rate will be very similar to those of a stable population. Then, a quasi-stable situation is
characterised. As has already been seen, this was the case of the Brazilian population between 1940 and
1970.
With the significant fertility decline in Brazil, an increasing gap between observed age distribution and that
of the stable population was perceivable. The stable population had an older lage structure. This indicates
the trend of age distribution in the future, if the functions of fertility and mortality were not to change and if
the population were to be closed to migration. Every time a change occurs, another stable population is
automatically defined.
TABLE 2
BRAZIL
Age Distribution of Observed and Stable Population
1970, 1980 and 1991
Age
Groups
1970
1980
1991
r of the
observed
population (%)
Observed
Stable
Observed
Stable
Observed
Stable
1980/1991
00—04
15.5
16.6
14.3
13.6
11.6
9.5
-0.1
05—09
14.4
13.8
12.6
12.0
11.8
9.0
1.5
10--14
12.7
11.9
11.9
10.8
11.6
8.6
1.7
15--19
10.9
10.3
11.3
9.7
10.2
8.2
1.0
20--24
8.8
8.8
9.6
8.6
9.2
7.8
1.5
25--29
6.9
7.5
7.9
7.7
8.6
7.4
1.7
30--34
6.0
6.4
6.4
6.8
7.5
7.0
2.7
35--39
5.4
5.4
5.3
6.0
6.4
6.6
3.4
40--44
4.9
4.5
4.8
5.3
5.3
6.2
3.7
45--49
3.8
3.7
3.9
4.6
4.2
5.8
2.9
50--54
3.2
3.1
3.4
3.9
3.5
5.3
2.6
55--59
2.5
2.5
2.6
3.2
2.9
4.8
2.1
60--64
1.9
1.9
2.0
2.6
2.5
4.2
2.8
65--69
1.3
1.4
1.7
2.0
1.9
3.6
3.7
70 e +
1.8
2.1
2.3
3.2
2.9
6.2
2.9
Total
100.0
100.0
100.0
100.0
100.0
100.0
1.9
r (%)
2.8
2.7
2.4
2.1
1.9
0.9
1.9
SOURCE:1970 and 1980 - CARVALHO,op. cit. 1991
1991 - Demographic census of 1991
NOTE: Population aged 00 to 04 enumerated in the censuses of 1970, 1980, and 1991was increased in 5%. r
corresponds to the intercensal annual average growth rate of observed population or the intrinsic growth rate, when
stable population is concerned.
GRÁFICO 1
BRAZIL
Age Distribution of Observed and Stable
Population
1970, 1980 and 1991
18
16
14
12
10
8
6
4
2
0
1970 - Observed
1980 - Stable
r - 1980/1991
1970 - Stable
1991 - Observed
1980 - Observed
1991 - Stable
70 e +
65--69
60--64
55--59
50--54
45--49
40--44
35--39
30--34
25--29
20--24
15--19
10--14
05—09
00—04
-2
Table 2 shows the observed and corresponding stable Brazilian relative age structures in 1970, 1980, and
1991 which are also shown in Figure 1. They point to a similar structures and growth rates of observed and
stable populations in 1970 as well as an increasing gap in 1980 and 1991. The difference between the
observed and the stable age structure increases in the sense that stable population indicates a less young
population. This indicates an older age structure than that in the observed population.
Between 1980 and 1991, there was a significant decline in the observed growth rate (about 21%).
However, relative decline was much greater in terms of intrinsic growth rate - approximately 57%. The
difference between the observed and intrinsic rates shows the effect of inert population growth.
The last column in Table 2 shows values of r in each age group between 1980 and 1991. Two different
sets become quite clear:
-the generations born after 1965 (population under 25 in 1991) and therefore, during the period of fertility
decline grew at rates well below the general average and some of them showed negative rates; for
instance, children below 5 years of age and
-the groups over 25 grew at greater rates.
It is this pattern of differentiated growth rates (lower for the young population and higher for the adult and
elder population) that necessarily produces a change in the age structure. To the extent that the generations
born after the beginning of the fertility decline become constituents of older age groups, they will also
show lower growth rates.
The short and long term effects of fertility decline between 1970 and 1991 on the age structure of the
population and its growth rate are clear (see table 2). In the short term, the proportion of the observed
population under 15 fell from 42.6% to 35.0%, a relative decrease of 18%, and r passed from 2.9% to
1.9%, a relative decline of 30%. In the long run, seen on the stable population, the population up to age 15
would necessarily pass to 27.1%, a decline of 37%, and the growth rate would reach 0.9%, a decline of
68%.
Data relative to the stable population in 1991 indicate the limits of age structure and growth rate, if fertility
and mortality for that year remain constant. The international experience, the trajectory followed by the
evolution of fertility in Brazil the increasing prevalence and the mix of methods used indicate that fertility
in the country will continue to fall towards to replacement rates.
2.2. Contraception in Brazil
The causes and determinants of fertility decline, including the proximate determinants, both for the country
as a whole and at regional levels have been the subject of several analyses6 and are not in the scope of this
study. In one way or another, however, they have pointed to the relevance that contraception has had in
fertility decline, this being the reason why a general summary of contraception is made in this section.
No official policy of birth control or family planning policy has ever been applied in the country. Brazil
was put under military rule from 1964 to 1985 during which the official position in respect to population
growth was (at least at the level of discourse) neutral or even pro-natalist and there are some detailed
studies on the subject among which those of Fonseca Sobrinho (1993) and Rocha (1992).
Briefly, it can be said that at the end of the 1970s family planning started to be considered by the
government as a subject of the strict responsibility of the couples and the definition of the family size as
part of their rights. The government would guarantee the exercise of such a right through the availability of
the necessary means for family planning in the public health services. Thus, these services were gradually
offered in the national health system and through some specific programs in a somewhat fragile schedule,
partially due to the very weakness of the national health system. At the same time, still in the 1960s, nongovernmental organisations were created throughout the nation aimed at implementing family planning.
Some of them were extremely dynamic at managing their own clinics or agreements with state or municipal
governments despite the formerly pro-natalist position of the first military governments. They reached
some relevance in localised areas of the country, though with limited geographic coverage.
As for available data for evaluating the role of contraception, although there are some partial surveys for
the 1970s and the first years of the 1980s7, the country could only count on nation-wide household surveys
on prevalence of contraception from 1986 onwards. The first two national surveys with very similar results
were: 1996 - Demographic Healter Survey - DHS -national survey on infant-maternal health and family
planning - (Arruda et al., 1987) in the DHS project, and the PNAD-86 by the Brazilian Census Bureau. In
1996, another DHS survey was undertaken.
Table 3, based on the DHS/86 and DHS/96, presents data about contraception for married women aged 1544 in 1986 and 15-49 in 1996. During this period, the prevalence rate rose from 65.8% to 76.7%.
6In this respect, see among others: Merrick and Berquó, 1983; Carvalho et al., 1983; Faria, 1989; Silva et al, 1990; Camarano,
1994; Wong, 1994 and Carvalho and Wong, 1996.
7There are, for example, previous estimates for the state of São Paulo and some of its municipalities (Berquó et al, 1977;
Nakamura e Fonseca, 1978), and for some states in the Northeast (Arruda et al., 1988).
TABLE 3
Brazil and Regions: Percent of Married Women At Reproductive Age (*)
on Method by Mix of Method(**)
1986-1996
Region(***)
On Method
Mix of method
Female sterilization
The North
Oral contraception
Condom
Other methods
Total
1986
1996
1986
1996
1986
1996
1986
1996
1986
1996
1986
1996
62.1
72.3
67.6
71.0
20.0
15.4
0.9
3.2
11.5
10.4
100.0
100.0
The Mid-West
84.5
70.4
19.1
27.0
7.8
100.0
The Northeast
52.9
68.2
46.5
64.4
32.7
18.6
0.9
4.4
19.9
12.6
100.0
100.0
The East
63.7
77.8
40.3
49.9
36.9
28.0
3.1
5.5
19.7
16.6
100.0
100.0
Rio de Janeiro
70.9
83.0
46.5
55.8
36.0
27.1
2.5
5.7
15.0
11.4
100.0
100.0
São Paulo
73.5
78.8
42.7
42.6
33.0
27.2
4.2
8.8
9.2
21.4
100.0
100.0
The South
74.4
80.3
24.6
36.1
55.1
42.5
2.3
6.1
18.0
15.3
100.0
100.0
Brazil(***)
65.8
76.7
40.9
52.3
38.3
27.0
2.6
5.7
18.2
15.0
100.0
100.0
(*)Women aged 15-44 in 1986 and 15-49 in 1996.
(** ) Including the partner’s method.
(***)Rural population in the North is not included. In 1991, rural population in this region corresponded to 42.2% of total
population and 2.9% of total population in Brazil.
SOURCE: Arruda, J.M., Rutemberg N., Morris,L., Ferraz, E. A. Pesquisa nacional sobre saúde materno-infantil
e planejamento familiar no Brazil - 1986 (Demographic Health Survey-1986), Rio de Janeiro:BEMFAM,
1987.
BEMFAM/DHS. Pesquisa nacional sobre demografia e saúde - 1996 (Demographic Health Survey), Rio de
Janeiro: BEMFAM/Macro International
Inc. DHS Program, 1997.
The already high prevalence in 1986 varied from 53% in the Northeast to74% in the South with only two
methods reaching the great majority of users - oral contraceptives and sterilisation (79.2%). At the regional
level, sterilisation was already the most important method, except for the South, and was adopted by
almost 70% of users in the North and Mid-West.
Ten years later, in 1996, prevalence increased in the country as a whole, reaching 68.2% in the Northeast
and 84.5% in the Mix-West. Similarly, the majority prevalence of the two methods found in 1986 is also
observed, with the difference that for this time there was a significant increase in the incidence of female
sterilisation with greater increase in the South (47%). In this region, the pill was the most prevalent method,
though it lost relative importance compared to sterilisation. The greatest relative increase in prevalence
occurred in the Northeast (29%) whose proportion of sterilised women increased by 38%.
The high prevalence among Brazilian women in all regions and predominance of female sterilisation point
to the irreversibility of the fertility decline thereby reinforcing the previously raised hypothesis on the trend
to convergence of fertility rates in Brazil.
3.THE EXPECTED TRAJECTORY OF THE BRAZILIAN POPULATION FOR THE NEXT
DECADES - 1990-2020
A projection made by the Brazilian Census Bureau (IBGE, 1997) assumes that at the end of the present
decade, the functions of fertility (TFR = 2.06) and mortality (e 00 = 69) would be reached and it would
produce a net reproduction rate near to 1.0. Next, the Brazilian population would reach negative intrinsic
growth rates (see table 4).
TABLE 4
Brazil, 1995 - 2020
Total Fertility Rate (TFR) and Life Expectancy at Birth (e o) implied
in the Projection - Both Sexes
Period
TFT
eo
1995
2.30
68.2
2000
2.06
69.3
2005
1.93
70.4
2010
1.86
71.3
2015
1.83
72.7
2020
1.81
73.0
FONTE: IBGE/DEPIS. Projeções da População do Brasil para o período 1980-2050, Rio de Janeiro, 1996 (Internal
document). (Projections for the Brazilian population: 1980-2050).
TABLE 5
Brazil, Estimated Population in 1990 and Projected for 2000, 2010 e 2020
and Annual Growth Rate according to Age Groups
Age Group
Population (in thousands)
Annual Growth Rate (%)
1 990
2 000
2 010
2020
1990/2000
2000/2010
2010/2020
0-4
16.043
15.268
14.959
13.821
-0.5
-0.2
-0.8
5-9
17.217
15.829
15.114
14.388
-0.8
-0.5
-0.5
10 - 14
16.886
16.776
15.169
14.878
-0.1
-1.0
-0.2
15 - 19
14.874
17.115
15.732
15.032
1.4
-0.8
-0.5
20 - 24
13.384
16.183
16.585
15.010
1.9
0.2
-1.0
25 - 29
12.471
14.343
16.825
15.489
1.4
1.6
-0.8
30 - 34
10.914
13.715
15.945
16.273
2.3
1.5
0.2
35 - 39
9.327
12.909
13.975
16.438
3.3
0.8
1.6
40 - 44
7.742
10.640
13.263
15.373
3.2
2.2
1.5
45 - 49
6.055
8.951
12.342
13.412
3.9
3.2
0.8
50 - 54
5.093
6.802
9.987
12.514
2.9
3.8
2.3
55 - 59
4.193
5.491
8.093
11.360
2.7
3.9
3.4
60 - 64
3.588
4.489
5.973
8.869
2.2
2.9
4.0
65 - 69
2.746
3.490
4.552
6.808
2.4
2.7
4.0
70 and more
4.261
5.547
7.745
10.773
2.6
3.3
3.3
Total
144.794
167.548
186.258
200.437
1.5
1.1
0.7
Broad Age Groups:
0-14
50.146
47.873
45.242
43.087
-0.5
-0.6
-0.5
15-64
84.053
106.149
122.746
130.900
2.3
1.5
0.6
65 and more
7.007
9.037
12.297
17.581
2.5
3.1
3.6
SOURCE: Population Projections (IBGE, 1997)
IBGE. Projeção da população do Brasil para o período 1980-2050 (Projections for the Brazilian population:1980-2050). Rio de Janeiro :
IBGE/Departamento de População e Indicadores Sociais,1997. (Unpublished).
The adjusted population for 1990 and the projected ones for the years 2000, 2010, and 2020 as well as the
average growth rates for each age group are shown in Table 5. This suggests that the Brazilian population
should pass from 145 million people in 1990 to 200.4 million in 2020. It should reach 167.4 million in the
year 2000. The official Brazilian projections made in the beginning of the 1970s indicated a total
population of 201 million for the year 2000 (IBGE, 1974). Obviously, the 33.6 million people that would
probably be "missing" in 2000 would be almost entirely a result of the "unexpected" fertility decline
between 1970 and 2000 and would be then under 30 years of age.8
The population under age 15 should not be expected to increase between 1990 and 2020 and their
constituent age groups should even show negative growth rates in some quinquenia of the period. The
population between ages 15 - 65 should grow above global average, however, at a rapidly decreasing rate.
Such a decrease will occur because generations born after the beginning of the fertility decline process will
increasingly take part in this population. It should be noted that during the years 2000 to 2020 the youngest
quinquennial age groups in the age interval between 15 and 65 should present very low or even negative
growth rates. The elderly population (over 65) should also grow above the general average, though at
increasing rates. Only the generations born before fertility decline will take part in the year 2020.
Table 6 shows the estimated age distribution for the year 2020 as well as that of the stable population,
corresponding to the fertility and mortality functions hypothesised for 2020. Figure 2 presents the same
data as well as the observed age distribution for 1991.
8
Furthermore, in the 1980s, occurred for the first time in this century a significant net loss of population in Brazil through
international migratory flows which would oscillate around 1.2 million people, i.e., 0.7% of the registered population in 1991
(Carvalho, 1996).
TABLE 6
Brazil, 1991 - 2020 - Relative age distribution (%)
Age Group
0 - 4 (*)
5-9
10 - 14
15 - 19
20 - 24
25 - 29
30 - 34
35 - 39
40 - 44
45 - 49
50 - 54
55 - 59
60 - 64
65 - 69
70 and more
Total
1991
2020
11.60
11.80
11.60
10.20
9.20
8.60
7.50
6.40
5.30
4.20
3.50
2.90
2.50
1.90
2.90
100.10
Projected
6.90
7.20
7.40
7.50
7.80
7.70
8.10
8.20
7.70
6.70
6.20
5.70
4.40
3.40
5.40
100.30
Stable
5.40
5.54
5.70
5.85
5.99
6.12
6.24
6.35
6.43
6.48
6.46
6.34
6.10
5.70
15.29
100.00
21.50
70.00
8.80
16.64
62.36
20.99
Broad age groups:
0 - 14
15 - 64
65 and more
35.00
60.30
4.80
(Projections of the Brazilian Populations 1980 - 2050)
SOURCE:1991: Brazilian Demographic Census
2020:'Projection (IBGE, 1997)
IBGE. Projeção da população do Brasil para o período 1980-2050. Rio de Janeiro : IBGE/Departamento de
População e Indicadores Sociais, 1997. (Unpublished).
(*) Adjusted by increasing 5% in the observed population
1991
2020 - Projected
2020 - Stable
70 and more
65 - 69
60 - 64
55 - 59
50 - 54
45 - 49
40 - 44
35 - 39
30 - 34
25 - 29
20 - 24
15 - 19
10 - 14
5-9
0 - 4 (*)
Gráfico 2
Brazil, 1991 - 2020
Relative age distribution (%)
16
14
12
10
8
6
4
2
0
A significant decrease in relative terms of young population under age 15 should occur between 1991 and
2020, with a decline in its participation from 35.0% to 21.5% (a fall of 39%). On the other hand, the
relative size of the adult population or working age population should increase from 60.0% to 70.0% and
that of the elderly population from 4.8% to 8.8%.
Despite the ageing process of the Brazilian population between 1991 and 2020, the age distribution of the
stable population defined by the expected mortality and fertility functions corresponding to 2020 points to
an even more intensive ageing process after 2020. In fact, people aged 65 or more will tend to represent
21% of the total population (Table 6). At the beginning of the fertility decline process this proportion was
about 3%.
Finally, the different timing of the Brazilian ageing process as compared to that observed in the past in
developed countries should be considered. Brazil, similarly to most Latin American countries is
undergoing a fast ageing process. In the European populations it has taken longer, to pass from high to low
fertility levels and their process started from levels lower than those observed in Brazil at the beginning of
its fertility decline.
4. SOME ISSUES FOR A NEW BRAZILIAN DEMOGRAPHIC AGENDA
Figure 3 shows the evolution of the Brazilian population over six decades: the observed age structure for
the years 1960 and 1990 and those projected for 2020. The dramatic change in the Brazilian demographic
pattern over the last 30 years corresponds to one of the country’s most important structural changes of this
century. The foreseen behaviour for the next decades shows that the population is facing an irreversible
process that must be considered in the short, medium and long terms. This process modifies the boundaries
of the research agenda, from which some points are outlined.
Gráfico 3
Among the expected consequences of the demographic change, variations in social and economic demands
are outstanding. As a young population varies at a significantly lower rate than that of an elderly
population, the present moment, demographically speaking, is potentially favourable to work out some
social problems afflicting the country. Relating to children and the young population, the possibility of
expanding investments in education (coverage and teaching quality) is made easier by the lower relative
growth of the school age population, while the growth rate of the elderly dependency ratio and thus the
needs for funds for retirement and health assistance are still relatively slower. Investment in childhood now
might represent a double bonus, since they will go into the labour force in 10 or 15 years’ time, when the
elderly dependency ratio will have greatly increased. (Carvalho and Wong, 1995).
Issues such as population ageing and social security reform from the demographic viewpoint ought to be
carefully considered. It is necessary to encourage research aimed at quantifying and qualifying their
welfare perspectives, similar to those developed by, among others, Saad (1996) and Yasaki (1992). These
studies privileged demographic aspects of old age and its relationships to the family, the community and
the rest of society. As for social security, studies strictly concerned with the demographic dynamics,
evaluating the intergenerational transference and alternative to the pay-as-you-go system, as are being
developed by (Rios Neto, 1995; Médici et al, 1995; Oliveira et al, 1993) should be further encouraged.
Analyses of population aged 15-64 bring new challenges, among them, two deserve special consideration.
First this group is experiencing higher growth rates than the total population, and, at the same time its
internal age structure is enduring deep changes that will produce a rapidly increasing labour force mean
age. Secondly, employment demands will tend to increase, proportionately more than the active age
population due to the clearly increasing trend of the female participation rate in the economically active
population (EAP). Thus, research considering the current situation of demographic variables in prospective
estimates of labour market and design of employment policies in Brazil are of major relevance. Studies
analysing the evolution of female participation in the economy and forecasting the female labour force
along the line developed by, e.g., Bruschini and Lombardi (1996), and Wajnman and Rios Neto (1994) will
provide powerful inputs for economic planning particularly in the employment area.
New possibilities open to Brazilian women lead to another aspect which demographic research should not
ignore, i.e., the gender relationship and its role in demographic dynamics. This was a priority subject in the
Brazilian agenda discussed in the preparatory meetings for the International Conference on Population and
Development in Cairo (1994) and demographic contributions in this direction should constitute a primary
research objective. It is already known that gender relationships contribute to define the reproductive
behaviour. Goldani (1994) and Moreira (1994), for example, show how gender relations may determine the
ideal family size.
Gender and ideal family size necessarily lead to subjects such as reproductive rights and women's health,
the study of which Brazilian demography should advance. Desired fertility, for example, was reported in
the DHS-96 as being 1.8 children; this value, compared to the TFR of 2.5 would indicate an important
difference of, say, a third. Such a difference, according to Wong and Badiani (1997), would be better
explained , among others, through research lines on the depth of knowledge of contraceptive methods,
availability and future demand.
Although virtually all concerned people know or have heard something about at least one contraceptive
method (BEMFAM/DHS, 1997), it is also true that only a very restricted number of methods are known.
About one fourth of women and half of men do not know about the existence of IUDs or male sterilisation
procedures. Vaginal methods are unknown by half of women and almost two thirds of men. This quite
restricted knowledge may explain the peculiar composition of the future demand for contraception. In fact,
non-user women expecting to adopt contraception at some time in the future, declare that they will choose
practically the two most prevalent current methods: pill and sterilization.
An adequate interpretation of present and future of contraception demand is crucial since it should serve
as a basis for the formulation of plans on reproductive health. Such data should be very carefully
evaluated: on the one hand, women showed in 1986 a profile of future prevalence that proved to be true in
1996 on the other hand, the ethics of offering the couples only those few alternatives mentioned by them
should be discussed. The design of such plans is even more hampered as suggested above, if declared
knowledge of contraceptive practices is nearly fallacious (Wong and Badiani, 1997).
Fertility among adolescents has recently called the researchers’ attention (Melo, 1996), since their rates
were increasing, even in absolute terms, until very recently.9 Even if the trend to convergence to low levels
now includes youths exposed to reproductive risk, a series of questions should be analysed. Such aspects
as nuptiality and fertility patterns in this age group should be considered, since it is important to know
whether or not reproduction precedes the status of ‘being in union’ and if in any case these young women
are assisted by their reproductive health and programs.
Relating to mortality analysis, Brazil does not have reliable vital statistics yet for most of its regions, and
at the same time, there are strong indications of impressive changes in the age structure of the risk of
death. There have been dramatic improvements in infant mortality (Simões, 1997) but quite reduced
advances related to adult mortality. Some important regions would have experienced increases in male
adult mortality, particularly in the age interval 15-29 (Ferreira and Castiñeiras, 1996; Paes, 1996;
Alburquerque and Oliveira, 1996). This fact, in turn, would provoke an unexpected increase in the life
expectancy sex differentials. This behaviour makes the use of the available current life table models
inadequate, even the Brazilian Model (IBGE, 1981), which was constructed considering the country’s past
mortality experience in urban areas. Therefore, there is a great demand for deep research about the age
structure of mortality in Brazil. A life table model representing the different regional settings of the country
is still indispensable for analysis of mortality in most of the regions.
With the clear trend of regional fertility and mortality levels in Brazil, internal migration will increasingly
become a key variable to explain the regional population distribution. Undoubtedly, there will be a
9
Specific fertility rates for ages 15-19 showed increased trend until around 1990. During the 90's, however, these rates started
to decrease (BEMFAM, DHS, 1997; Albuquerque and Casares, 1996).
significant change in the migratory flow patterns, since the country (with its history of internal labour
migration) now counts on a reasonable urban network, has been increasingly inserted into the global
international economy and its most dynamic industrialised regions are losing their labour force absorption
capacity .
Return migration to traditionally out-migration places can be cited as one of these changes. It increased
significantly during the 1980s and will probably tend to increase with strong impact on the sending and
receiving regions. Therefore, direct and indirect demographic effects of return migration need to be
considered; hence, measurement methodologies, as those proposed by Ribeiro (1997), should be further
developed and applied.
International migration whose balance was tentatively estimated through indirect techniques (Carvalho,
1996) and incomplete data sources (Oliveira et al., 1996) should also become important in the near future.
The design and implementation of statistic systems of national coverage and the development of indirect
techniques for measurement of international migration flows, as well as the implementation of research
projects aimed at studying their determinants 10 are therefore equally necessary.
10
A complex research project on the international migration in Brazil was recently developed in the University of Campinas.
The main findings are published in Patarra (1995, 1996).
REFERENCES
ALBUQUERQUE, F.R.P.C. , CASARES, M.E.O. Níveis e padrões de fecundidade com base nos
nascidos vivos provenientes do registro civil : Brasil, Grandes Regiões e Unidades da Federação ;
1980-1995 (Levels and Patterns of Fertility Based on Registered Live Births: Brazil, Great Regions and
Units of the Federations; 1980-1995). Rio de Janeiro : IBGE, 1996. (Texts for discussion; 85) pp 47-80
.
ALBUQUERQUE, F.R.P.C. , OLIVEIRA, J. C. Aspectos gerais de evolução dos óbitos por causas
externas no Brasil (General Aspects of Evolution of Death Certificates by External Causes in Brazil). In
: IBGE. Componentes da dinâmica demográfica brasileira : textos selecionados (Components of the
Brazilian Demographic Dynamics: selected texts). Rio de Janeiro : IBGE, 1996. pp 81-90. (Text for
discussion; 85)
ARRUDA, J.M., MORRIS, L. FERRAZ E.,A. , GOLDBERG H. Tendências recentes da fecundidade e do
planejamento familiar na região nordeste : 1980-1986 (Recent Fertility and Family Planning Trends in
the Northeast Region: 1980-1986). In: ENCONTRO NACIONAL DE ESTUDOS POPULACIONAIS,
6, 1988, Olinda. Anais .. .Belo Horizonte : ABEP, 1988. v. 4 pp 111-36
ARRUDA, J.M., RUTEMBERG N., MORRIS, L. , FERRAZ, E.,A. Pesquisa nacional sobre saúde
materno-infantil e planejamento familiar, PNSMIPF : Brasil, 1986 (National Demographic and Health
Survey). Rio de Janeiro : BEMFAM ; IDR, 1987. 234p.
BEMFAM , DHS. Brasil : pesquisa nacional sobre saúde e demografia; 1996 (National Demographic
Health Survey). Rio de Janeiro : BEMFAM; Macro International, 1997. 180p.
BERQUÓ, E, OLIVEIRA, M.C.A.F. de, CAMRGO,C.P.F. de. (eds.) A fecundidade em São Paulo:
características demográficas, biológicas e sócio-econômicas (Fertility in São Paulo: Demographic,
Biological and Socio-Economic Characteristics). São Paulo : CEBRAP, 1977. 476p.
BRUSCHINI, C., LOMBARDI, M. R. O trabalho da mulher brasileira nos primeiros anos da década de
noventa (The Work of Brazilian Women in the Beginning of the 1990s). In: ENCONTRO NACIONAL DE
ESTUDOS POPULACIONAIS, 10, 1996, Caxambu, Anais...Belo Horizonte : ABEP, 1996. v.1, pp 483516.
CAMARANO, A. A. Fertility Transition in Brazil in the twentieth century: a comparative study of the
three areas . London. London School of Economics and Political Science - University of London. 1996
(Ph. D. Theses).
CAMARANO, A. A. Os determinantes próximos da fecundidade nordestina: uma análise agregada
(Proximate Determinants of Northeastern Fertility: An Aggregate Analysis). In: BEMFAM, DHS:
Fecundidade, anticoncepção e mortalidade infantil: pesquisa sobre saúde familiar no nordeste, 1991
(Fertility, Contraception and Infant Mortality: Research on Family Health in the Northeast, 1991). Rio
de Janeiro : BENFAM; DHS, 1994. pp 37-56
CAMPANARIO, P. E MORELL, M.G.G. de Hipótese da homogenização de fecundidade: cotejo com
dados de São Paulo (Fertility Convergence Hypothesis: Study Using São Paulo Data). In :
ENCONTRO NACIONAL DE ESTUDOS POPULACIONAIS, 9, 1994, Caxambu. Anais.... Belo
Horizonte : ABEP, 1994. v.2, pp.77-88.
CARVALHO, J. .A. M de. Regional trends in fertility and mortality in Brazil. . Population Studies,
London, v. 28, n.3, pp 01-21, Nov. 1974.
CARVALHO, J..A. M. de. Evolução demográfica recente no Brasil (Recent Demographic Evolution in
Brazil). Pesquisa e Planejamento Econômico, Rio de Janeiro, v. 10, n. 2, ago.1980, p.527-553
CARVALHO, J. A. M. de. O saldo dos fluxos migratórios internacionais no Brasil da década de 80: uma
tentativa de estimação (The Result of International Migratory Flow in Brazil in the 1980s: An Attempt
at estimating). In: PATARRA N. (coord.) Migrações internacionais herança XX agenda XXI
(International Migrations - XX Heritage XXI Agenda). Campinas : FNUAP, 1996. v.2, p.227-38.
CARVALHO, J. A. M. de, WONG, L. R. Causes and consequences of the fertility decline in Brazil. In :
GUZMAN, J. M. et al (eds.). The fertility transition in Latin America. Oxford : Oxford University
Press, 1996. pp 373-96.
CARVALHO, J. A .M. de, WONG, L .R. A window of opportunity : some demographic and socioeconomic implications of the rapid fertility decline in Brazil. Belo Horizonte : UFMG/CEDEPLAR,
1995. 36p. (Text for discussion; 91)
CARVALHO, J. A. M. de. Crescimento populacional e estrutura demográfica no Brasil, Belo Horizonte:
CEDEPLAR/UFMG. 1993. 20p. (Paper presented at the Seminar: Crescimento Populacional e
Estrutura Demográfica, Rio de Janeiro, 1993).
CARVALHO, J. A. .M. de, PAIVA, P. T. A. , SAWYER, D. R.A recente queda da fecundidade no Brasil
: evidências e interpretação (The Recent Fertility Decline in Brazil: Evidence and Interpretation). Belo
Horizonte : UFMG/CEDEPLAR, 1983. 65p. (Monografia ;.12)
FARIA, V. E. Políticas de governo e regulação da fecundidade : consequências não antecipadas e efeitos
perversos (Government Policy and Fertility Regulation: Unexpected Consequences and Peverse
Effects). In : CIENCIAS SOCIAIS HOJE. São Paulo : ANPOCS ; Vértice, 1989. pp 62-99.
FERNÁNDEZ, R. E., CARVALHO, J. A. M. de. A evolução da fecundidade no Brasil : período de 19571979 (The Evolution of Fertility in Brazil: 1957-1979 period). Revista Brasileira de Estudos de
População (Brazilian Journal and Population Studies), Campinas, v. 3, n. 3, p. 67-86, Jul./dec. 1986.
FERREIRA, C. E. C. , CASTIÑEIRAS, L. L. O rápido aumento da mortalidade dos jovens adultos em São
Paulo : uma tendência trágica (The Rapid Increase of Young Adult Mortality in São Paulo: A Tragic
Trend). São Paulo em Perspectiva, São Paulo, v.10, n.2, 1996. p.34-41.
FONSECA SOBRINHO, D. Estado e população : uma história do planejamento familiar no Brasil (The
State and the Population: A History of Family Planning in Brazil). Rio de Janeiro : FNUAP ; Rosa dos
Tempos. 1993. 203p.
FRIAS, L. A. , CARVALHO, J. A. M. de. Fecundidade nas regiões brasileiras a partir de 1903: uma
tentativa de reconstrução do passado através das gerações (A regional view of Brazilian fertility from
1903 on: An Attempt to Make History from cohorts). In: ENCONTRO NACIONAL DE ESTUDOS
POPULACIONAIS, 9 (National Meeting of Population Studies), 1994, Caxambu. Anais ... Belo Horizonte
: ABEP, 1994. v. 2, pp 23-46.
GOLDANI A. M. Família, relações de gênero e fecundidade no Nordeste do Brasil. Family, gender and
fertility In: BEMFAM, DHS: op. cit: BEMFAM ; DHS. 1994. pp 57-80
IBGE Projeção da população brasileira por idade e sexo, 1975-2000 (Projection of the Brazilian
Population Age and Sex Composition), 1975-2000. Revista Brasileira de Estatística, Rio de Janeiro v.
35, n.139, p.357-370. 1974.
IBGE. Estatísticas históricas (Historical Statistics). Rio de Janeiro : IBGE, 1987. part I.
IBGE. Projeção da população do Brasil para o período 1980-2050 (Projection of the Brazilian
Population for the 1980 - 2050 period). Rio de Janeiro : IBGE/Departamento de População e
Indicadores Sociais, 1997. (Unpublished).
IBGE. Brasil : tábuas modelo de mortalidade e populações estáveis (Brazil: Model Tables on Mortality
and Stable Populations). Rio de Janeiro : IBGE, 1981.
MARTINE, G. A Redistribuição espacial da população brasileira durante a década de 80 (Spatial
Redistribution of the Brazilian Population during the 1980s). Brasília : IPEA,
1994a. (Text for discussion; 329).
MARTINE G. (coord.) Mudanças recentes no padrão demográfico e implicações para a agenda social
(Recent Changes in the Demographic Pattern and Implications for the Social Agenda). Rio de Janeiro
: IPEA, 1994b (Text for discussion; 345).
MÉDICI, A. C., OLIVEIRA, F. B. E., BELTRÃO, K. I. Brazilian social security, past, present and future.
Rio de Janeiro: IBGE/Secretaria de Planejamento, Orçamento e Coordenação, 1995. (Technical
Reports).
MELO, A. V. Gravidez na adolescência: uma nova tendência na transição da fecundidade no Brasil
(Pregnancy in Adolescence: A New Trend in the Fertility Trasition in Brazil). In: ENCONTRO DE
NACIONAL DE ESTUDOS POPULACIONAIS, 10, 1996, Caxambu. Anais... Belo Horizonte : ABEP,
1996, v. 3, p.1439-54.
MERRICK, T., BERQUÓ, E. The determinants of Brazil’s rapid decline in fertility. Washington,
D.C.National Academy of Science Press, 1983. 241p.
MOREIRA, M.M. Relações de gênero e fecundidade: Nordeste, (Gender and Fertility in the Northeast)
1991. In: BEMFAM, DHS: op. cit, 1991. Rio de Janeiro : BEMFAM ; DHS. 1994. p.81-92.
NAKAMURA, M. S., FONSECA, J. P. B. São Paulo state contraceptive prevalence survey. Campinas :
UNICAMP, 1978. (Final report)
OLIVEIRA F. B. E, BELTRÃO K. I., MANIERO, L. V. F. Aposentadoria por tempo de serviço :
diagnóstico e alternativas (Retirement by Time of Service: Diagnostic and Alternatives). Rio de Janeiro :
IBGE/Secretaria de Planejamento, Orçamento e Coordenação, 1993. (Technical Reports).
OLIVEIRA, A. T. R.. et al. Notas sobre a migração internacional no Brasil na década de 80 (Notes on
International Migration in Brazil in the 1980s). In: PATARRA, N. (coord.) Migrações internacionais
herança XX agenda XXI (International Migration - XX Heritage XXI Agenda). Campinas: FNUAP,
1996. v. 2, p. 239-58.
PAES, N. A. A mortalidade por causas no Brasil : qualidade e comportamento dos dados (Mortality by
Causes in Brazil: Data Evoluation). In: ENCONTRO NACIONAL DE ESTUDOS POPULACIONAIS,
10, 1996, Caxambu. Anais ... Belo Horizonte : UFMG/CEDEPLAR, 1996. v.4, p.1945-1970.
PATARRA, N. L. (Coord.) Emigração e imigração internacionais no Brasil contemporâneo (International
Emigration and Immigration in Contemporary Brazil). São Paulo : FNUAP, 1995. 207 p. (Programa
interinstitucional de avaliação e comportamento das migrações internacionais no Brasil; 1)
PATARRA, N.L. (Coord.) Migrações internacionais : Herança XX, agenda XXI (International Migrations:
XX Heritage, XXI Agenda). São Paulo : FNUAP, 1996. 207p. (Programa interinstitucional das
migrações internacionais no Brasil; 2)
RELATÓRIO do Brasil para a Conferência Internacional sobre População e Desenvolvimento (Report on
Brazil in the International Conference on Population and Development), Cairo 1994. Brasília : [s.n.],
1994. 118p.
RELATÓRIO sobre o desenvolvimento humano no Brasil (Report on Human Development in Brazil):
1996. Rio de Janeiro : IPEA ; Brasília : PNUD, 1996. 185p.
RIBEIRO, J. L.T. Estimativa da migração de retorno e alguns dos seus efeitos demográficos no nordeste
brasileiro: censos de 1980 e 1991 (Estimate of Return on Migration and Some of its Demographic
Effects on the Brazilian Northeast: 1980 and 1991 Censuses). Belo Horizonte. : UFMG/CEDEPLAR,
1997. (Ph. D. Theses)
RIOS NETO, E. G. Transferências intergeneracionais e previdência social brasileira (Inter
Generational Transference and Brazilian Social Security). 1996. (Paper presented at the International
Seminar Transição Demográfica e a Reforma da Previdência Social, Brasilia, 1995)
ROCHA, M. I. B. Política demográfica e parlamento : debates e decisões sobre o controle da natalidade
(Demographic Policy and Parlament: Debates and Decisions on Birth Control). Campinas :
UNICAMP/Instituto de Filosofia e Ciências Humanas, Departamento de Ciências Sociais, 1992.
SAAD, P. M. Living Arrangements of the elderly in the Northeast and Southeast - Brazil- 1980. In :
ENCONTRO NACIONAL DE ESTUDOS POPULACIONAIS (National Conference on Population
Studies), 10, 1996, Caxambu.. Anais ... Belo Horizonte : ABEP, 1996. v. 4, p.2383-2411.
SAWYER, D.O., FREIRE, F. H. A fecundidade e mortalidade no Brasil (Fertility and Mortality in
Brazil). Belo Horizonte :
UFMG/CEDEPLAR, 1997 (Projeto POP-MUM Ongoing Research)
SILVA, N. do V., HENRIQUES, M. A., SOUZA, A. An analysis of the reproductive behaviour in Brazil.
Calverton : Macro International, 1990. (DHS further analysis series ; 6)
SIMÕES, C. C. Transição da mortatlidade infantil no Brasil e as mudanças nos padrões de mortalidade
por causas e idade (Infant Mortality Transition in Brazil and the Changes in Mortality Patterns by
Causes and Age). Belo Horizonte: UFMG/CEDEPLAR, 1997. (Ph. D. Theses)
WAJNMAN, S., RIOS-NETO, E.G. Female labour force participation in Brazil : alternatives for
projecting levels and patterns. Belo Horizonte : UFMG/ CEDEPLAR, 1994. 39p. (Text for discussion;.
77)
WONG, L. R. ; BADIANI R. Achados e perdidos sobre reprodução humana na PNDS-Brasil-96 (Lost
and Found on Human Reproduction in PNDS-Brazil-1996). 1997. (Research note - Unpublished).
WONG, L. R. A queda da fecundidade no nordeste : uma aproximação aos determinantes (The Fall of
Fertility in the Northeast: An Approximation to the Determinants) - In: BEMFAM, DHS: Fecundidade,
anticoncepção e mortalidade infantil : pesquisa sobre saúde familiar no nordeste, 1991 (Fertility,
Contraception and Mortality: Research on Family Health in the Northeast, 1991). Rio de Janeiro :
BENFAM ; DHS, 1994. p.9 -36.
WOOD, C.H. , CARVALHO, J. A. M. de. The demography of inequality in Brazil, Cambridge :
Cambridge University Press, 1988 . 303p.
YASAKI L.M. (1992): Arranjos familiares e a presença da mulher no apoio aos idosos (Family
Arrangements and the Presence of Female Support to the Aged). In : (National Meeting of Population
Studies), 8, 1992, Brasilia. Anais... São Paulo : ABEP 1992, v. 2, p.253-95.
Baixar