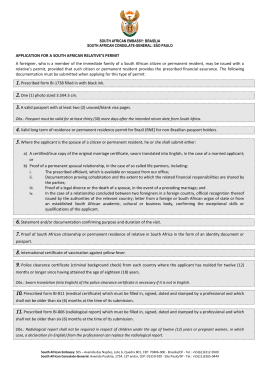
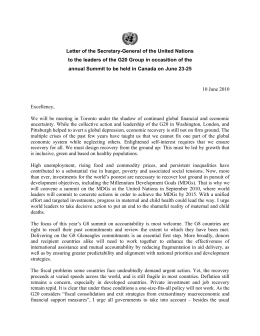
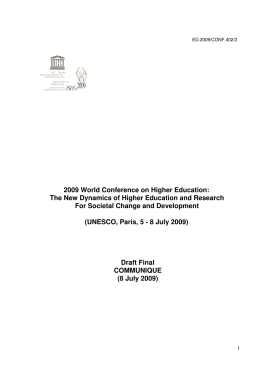
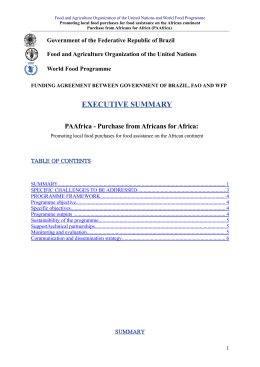
Linking Taxation to the Realisation of the Millenium Development Goals in Africa
Author:
Institution:
Attiya Waris and Matti Kohonen
University of Nairobi Law School
Address:
P O Box 30197, Nairobi 0100 Kenya
E-mail:
[email protected]
Telephone:
00254771891571
Table of Contents
Abstract.................................................................................................................................................2
1. Introduction...................................................................................................................................... 3
1.1. Delineating International Human Rights............................................................................. 3
1.2. The Obstacle to Realisation: Allocation of Limited Resources...........................................6
1.3. The Domestic Realisation of Human Rights........................................................................7
2. Tax and Human Rights..................................................................................................................... 8
2.1. The Right to Development, Taxation and State Responsibility...........................................8
2.2. The African Context .......................................................................................................... 10
3. Taxation in Africa and the MDGs...................................................................................................11
3.1. Data Analysis......................................................................................................................11
3.2. Data .................................................................................................................................. 12
3.3. Tax and Millennium Development Goals in Africa........................................................... 15
MDG 1: Eradicate Extreme Poverty and Hunger............................................................ 17
MDG 2: Achieve Universal Primary Education.............................................................. 17
MDG 3: Promote Gender Equality and Empower Women.............................................17
MDG 4: Reduce Child Mortality.....................................................................................18
MDG 5: Improve Maternal Health.................................................................................. 18
MDG 6: Combat HIV / AIDS, Malaria, and Other Diseases...........................................19
MDG 7: Ensure Environmental Sustainability ............................................................... 19
MDG 8: Develop a Global Partnership for Development............................................... 20
4. Conclusions.................................................................................................................................... 21
Bibliography....................................................................................................................................... 22
Annexes.............................................................................................................................................. 24
Annex 1: Low-Income Countries in Africa...............................................................................24
Annex 2: Countries according to their Tax per GDP ratio in 2003........................................... 24
Annex 3: Tax per GDP ratios for 2003 and MDG Achievement 2005-2008 in Africa.............25
Abstract
The Millennium Development Goals (MDGs) are a critical step towards the progressive
achievement of the most crucial human, social and economic rights. Many countries have made
progress towards their achievement, but generally low-income countries in Africa are lagging
behind. This paper will discuss how taxation could be added as a factor in both progress towards the
MDGs, and their achievement in both progressive and absolute terms. The MDGs will be thus
discussed in the context of all human, social and cultural rights.
In discussing tax or the MDGs there are many indices available. However although the still remains
some challenge to prove whether there is a statistical correlation between tax and the MDGs, the
debate is now beginning to move into the practicalities of the connections. The Centre for Global
Development MDG Progress Indicator Index has ranked countries with points in terms of the
progress they have made in achieving their MDGs. The Human Poverty Index for developing
countries (HPI-1), and the Human Development Index (HDI) combine the aspects of a long and
healthy life, knowledge, and a decent standard of living 1. Using these sets of indices at a
preliminary level this paper will explore the link between the indices to see if an additional
connection can be built between tax collection and the achievement of the MDGs. Data will be used
from the OECD/ADB African Economic Outlook 2010 database, in order to make statistical work
towards this paper.
1
UNDP 2009 "Human Development Report 2009" New York: UNDP, p. 208
1.
Introduction
You cannot have a right unless it can be claimed or demanded or insisted upon, indeed claimed effectively or
enforceably. …rights thus are performative-dependent, their operative reality being their claimability; a right
one could not merely be ‘imperfect’ – it would be a vacuous attribute. 2
This statement is what funds and fuels the distinction that remains and that which is maintained by
some social welfare scholars to keep human rights in a separate category. They argue that what
society claims as a right may be contradicted by its substance or administration. Thus the issue of
equality of right is used to exclude social welfare benefits from the ‘rights’ category by some human
rights scholars.3
The current global financial and economic crisis presents significant short-term risks to Africa’s
progress toward achieving the MDGs by 2015. The major contraction in the global demand for
Africa’s exports has led to a fall in commodity prices, with a significant adverse impact on African
economies. Foreign exchange revenues have fallen, along with corporate tax revenue rates and
collections. As a result, it has become much more difficult for countries to finance imports and
critical infrastructure development. 4
Low-income countries are too poor to benefit fully from multilateral trade liberalization without aid.
To take advantage of market access, they require hefty investments in trade-creating infrastructure,
transportation, and telecommunications, as well as investments in trade-related government
institutions, such as better customs and tax administration, and overall management of public
investment. These in turn require development assistance or “aid for trade”. In short, even though it
will undoubtedly benefit developing countries by stimulating growth and reducing global poverty,
reducing trade barriers is not sufficient to eliminate the need for aid in those countries with the
largest income-poverty MDG gap.5
1.1. Delineating International Human Rights
There are three main core texts that are the source of all discourse on human rights: the UDHR,
ICCPR and ICESCR. All these texts do not specifically contain a definition of human rights;
however they state that the purpose of human rights is to enhance human dignity. 6 Broadly
speaking, as a result, human rights are the concrete expression of values that are designed to
enhance human dignity. Contemporary thought is what gives these values the form of rights
bestowed on individuals and groups.
Some scholars regard the absence of a definition of human rights as an impediment to its
realisation. However, Donnelly regarded it as a sign of its continually evolving content which
reflects the relationship of society within itself and with the state. 7 This approach will be adopted in
this thesis as it allows one to draw into human rights the existing concepts of welfare and wellbeing. Human rights and human dignity can thus be perceived as the modern day interpretation of
social welfare as espoused by Schumpeter and economic and welfare scholars. This then allows the
Stoljar (1984) 3-4
See generally Sampford and Galligan (1986)1-19
4
Assessing Progress in Africa toward the Millennium Development Goals (MDG Report 2009) at 57
5
Shantayanan Devarajan, Margaret J. Miller, and Eric V. Swanson, The Costs of Attaining the Millennium
Development Goals: This paper summarizes the results of a World Bank Policy Research Working Paper, “Development
Goals: History, Prospects and Costs,” 5
6
United Nations General Assembly. Universal Declaration of Human Rights (1948) article 1
7
Donnelly (2003) 1
2
3
discussion of welfare and human rights to proceed as one with the improvement of human rights of
people part of the ultimate expenditure aim of the development of a state into a fiscal state.
From the initial broad starting point in the UDHR, ICCPR and ICESCR the content of human rights
obligations have developed very significantly. The content of the these texts list out human rights to
include: the right to life, liberty and security of the person; freedom from slavery and servitude;
freedom from torture or cruel, inhuman and degrading treatment; to recognition everywhere as a
person before the law; equality before the law and without any discrimination to equal protection of
the law; effective remedy by the competent national tribunals; arbitrary arrest, detention or exile;
full equality to a fair and public hearing by an independent and impartial tribunal; right to be
presumed innocent until proved guilty; protection of the law against such interference or attacks;
right to freedom of movement and residence; right to seek and to enjoy in other countries asylum;
right to a nationality; right to marry and to found a family; right to own property; right to freedom
of thought, conscience and religion; freedom of opinion and expression; right to freedom of
peaceful assembly and association; right to take part in the government; 8 right of equal access to
public service in his country; right to social security; right to work, right to rest and leisure, right to
a standard of living adequate for the health and well-being right to education; right freely to
participate in the cultural life of the community. 9
Regionally African states formed the African Union and have negotiated and created a regional
human rights treaty, the African Charter of Human and People’s Rights (ACHPR). 10 This treaty
includes all of the rights listed above except for the right to social welfare and additionally
recognises both individual and peoples’ rights, family protection by the state, 11 grantees peoples’
the right to equality,12 the right to self-determination,13 to freely dispose of their wealth and national
resources,14 the right to development,15 the right to peace and security 16 and the right to a generally
satisfactory environment.17
8
9
10
11
12
13
14
15
16
17
Whereas all these rights are in the UDHR those listed thus far are only in the ICCPR and not the ICESCR.
Although the entire set of listed rights are found in the United Nations General Assembly. Universal Declaration of
Human Rights (1948) articles 1-27, the latter half from the right of equal access to public services are the content of
the ICESCR
A Charter is not legally binding, but it is worthwhile referring to as it constitutes the expression, at the highest level,
of a democratically established consensus on what is considered as the catalogue of fundamental rights for all. The
recognition of the African Charter is based on its application, use and the weight of its recommendations which are
mere recommendations and not enforceable.
Organisation of the African Union. African Charter of Human and Peoples Rights (1982) article 18
Ibid. article 19
Ibid. article 20
Ibid. article 21
Ibid. article 22
Ibid. article 23
Organisation of the African Union. African Charter of Human and Peoples Rights (1982) article 24
Over the years the content, purpose, applicability, realisation and enforcement of human rights
continues to be questioned, evolve and grow. Today additional international instruments have been
developed with the recognition of more states internationally that have added their voices to the
discourse of international human rights law. The framework for international human rights law
allows for additions to the list of rights to be included in the content of human rights through
additional treaties, covenants, declarations and resolutions. These newer rights added onto the
continually evolving list of rights include the right to development, peace and a healthy
environment.18 It also makes provision for states to deviate from these rights through a system of
reservations to the international treaties. 19
Domestically a state chooses what will form the list of human rights of its citizens by signing and
ratifying a treaty or refusing to do so. Today, most states of the world have signed and ratified these
treaties.20 Some states have either not signed or ratified both these treaties, 21 while certain states like
the US and South Africa have abstained from ratifying the ICESCR. 22
The closest quantification of human rights in terms of resources the world has ever managed to
codify are the Millennium Development Goals (1990-2015) and that they should be achievable by
2015. They have been clearly set out as:
1. Eradicate extreme poverty and hunger
•
Halve the proportion of people with less than one dollar a day.
•
Halve the proportion of people who suffer from hunger.
2. Achieve universal primary education
•
Ensure that boys and girls alike complete primary schooling.
3. Promote gender equality and empower women
•
Eliminate gender disparity at all levels of education.
4. Reduce child mortality
•
Reduce by two thirds the under-five mortality rate.
5. Improve maternal health
•
Reduce by three quarters the maternal mortality ratio.
6. Combat HIV/AIDS, malaria and other diseases
•
Reverse the spread of HIV/AIDS.
7. Ensure environmental sustainability
•
Integrate sustainable development into country policies and reverse loss of environmental
resources.
•
Halve the proportion of people without access to potable water.
Henkin (1987) 198
In addition, in practice, national deviations are not really permitted. The UN Committees don’t allow differences in
interpretation between states, and from the HRC’s general comment 24 it would seem that most of the reservations that
try to change the content of the obligations are actually not valid.
20
United Nations (2004) The ICCPR was concluded in 1966 and has been ratified by 152 states, 45 states however
are not yet party to this treaty and 8 states have signed it but have not as yet ratified it. The ICESCR has been
ratified by 146 states, 51 states are not yet party to the treaty, and 8 states have signed it but have not as yet ratified it
21
The following states have signed but not ratified both treaties and include China, Comoros, Cuba, Guinea-Bissau,
Laos, Nauru, Pakistan and São Tomé and Príncipe. States that have neither signed nor ratified it include Antigua and
Barbuda, Bahamas, Bhutan, Brunei, Burma (Myanmar), Fiji, Kiribati, Malaysia, Marshall Islands, Micronesia, Oman,
Palau, Qatar, Saint Kitts and Nevis, Saint Lucia, Saudi Arabia, Singapore, Solomon Islands, Tonga, United Arab
Emirates, Vanuatu and Vatican City (through the Holy See).
22
States that have neither signed nor ratified only the ICESCR but have signed and ratified the ICCPR include Andorra,
Haiti, Mozambique, Nauru, South Africa, United States of America.
18
19
•
Significantly improve the lives of at least 100 million slum dwellers.
8.Develop a global partnership for development
•
Raise official development assistance.
•
Expand market access.
•
Encourage debt sustainability.
1.2. The Obstacle to Realisation: Allocation of Limited Resources
All rights cost some money, although some may cost more than others. Holmes and Sustein state
that
rights cannot be protected or enforced without public funding and support…all rights make claims on the
public treasury.23
However, rights can practically become more than mere declarations only if they confer power on
bodies whose decisions are legally binding. A legal right exists in fiscal reality, only when and if it
has budgeted costs.24
In dealing with economic and social right that require progressive realisation the UN and its
constituent bodies continue to recognise the resource limitations of states. The earliest reference to
resources that the UN has made was in the discussion on the right to life and nuclear weapons when
the HRCom stated that
While remaining deeply concerned by the toll of human life taken by conventional weapons in armed conflicts,
the Committee has noted that, during successive sessions of the General Assembly, representatives from all
geographical regions have expressed their growing concern at the development and proliferation of
increasingly awesome weapons of mass destruction, which not only threaten human life but also absorb
resources that could otherwise be used for vital economic and social purposes, particularly for the benefit of
developing countries, and thereby for promoting and securing the enjoyment of human rights for all. 25
Political will when targeted as the reason for the failure to realise a right is quickly countered with
the fiscal limitations argument. In 1993, the Committee on Economic, Social and Cultural Rights,
noted in the case of Kenya, that any reform measures must be accompanied by the adoption of
targeted programmes designed to protect specifically the vulnerable groups and members of society,
and that the Government of Kenya had demonstrated very little awareness or willingness in this
regard. However, the Kenyan government cited a lack of financial resources as justification for the
comprehensive neglect of such protective measures. 26 State sovereignty over its limited resources
has been cited not only by Kenya but by many developing and developed states to justify the
inability to realise human rights. For example, in 2004, Bosnia and Herzegovina also reported that
lack of resources was an obstacle to the realisation of the right to health and the Committee has
accepted this from both states as a justification. 27
Using the argument of the aspirational nature of rights justifies its open ended formulation to all an
infinite possibilities of protections, and with it an infinite cost implication. 28 However, within the
state citizens assume that public officials whether at national, municipal or local level, will routinely
locate public resources and use them to salvage or boost the value of the society’s rights. These
rights will only have a budgetary allocation if their precise nature and scope are legally stipulated,
interpreted and recognised by law. For example, despite the continual existence of crime, citizens
feel relatively secure that they will receive personal or physical security and that police will be paid
23
24
25
26
27
28
Holmes and Sunstein (1999) 18-20
Ibid. 19
Human Rights Committee. General Comment No. 14: Nuclear weapons and the right to life (Article. 6) (1984)
Committee on Economic Social and Cultural Rights. Concluding observations of the Committee on Economic,
Social and Cultural Rights: Kenya (1993)
United Nations. Core Document Forming Part of the Reports of States Parties: Bosnia and Herzegovina (2004)
Holmes and Sunstein (1999) 120
salaries to maintain security.29 Pogge adds that although reference commences in the national level
with the constitution and the laws, the vigilance of citizens and their participation is required. 30
In 2005, Bolivia stated that ‘poverty and economic adjustment limit resources’31 in their discussion
on the limitations to the implementation of the rights of the child and the argument was accepted to
allow for progressive realisation and simply, urged to allocate more resources. 32 In 2006, Hungary
was asked by the committee on torture to provide in its next periodic report information about the
allocation of adequate resources to ensure the effective functioning of programmes. 33
Even in the case of the immediately realisable civil and political rights, the UN and its constituent
bodies recognise resource limitations. For example, in 2003, Mexico, in reference to the freedom
from torture, stated that great efforts had been made to eradicate torture, but that cases continued to
occur due to a lack of training for police officers, a problem that was more acute in public
attorneys’ offices where resources were scarce.34
However, the international community does recognise that the term ‘progressive realisation’ is used
as an escape clause, and as a result there is a movement towards a system of indicators to measure
progress in realisation.35 Many Africans argue that, economic rights should take preference over
civil and political rights in their poverty stricken, underdeveloped countries. 36 Today, the World
Bank is also approaching development from the angle of basic needs. 37
Thus, one can see clearly, that civil and political rights need resources just as much as other rights.
The HRCom is making statements more and more towards realisation of not only civil and political
but also economic, social and cultural right. They recognised that civil and political rights can never
be attained unless all basic necessities of life are available to everyone. 38
1.3. The Domestic Realisation of Human Rights
At the domestic level there remains a balance of power between the state and the judiciary in the
decision on how to distribute resources. The political intent of the state is the only impetus that can
lead to the realisation of human rights domestically. Although in developing states this includes
foreign development aid, the purpose of this paper is to discuss how the fiscal legitimacy of the
state can be improved using human rights. The only way this can take place is if the state itself is
actually using its fiscal resources to improve the human rights of the society.
29
30
31
32
33
34
35
36
37
38
Ibid. 14
Pogge (2008) 68
United Nations. Core Document Forming Part of the Reports of States Parties: Bolivia (2005)
Committee on the Rights of the Child. Consideration of Reports Submitted by States Parties Under Article 44 of
The Convention : Concluding observations: Bolivia (2005)
Committee Against Torture. Consideration of Reports Submitted by States Parties Under Article 19 of the
Convention: Conclusions and Recommendations of the Committee Against Torture: Hungary (2006) 17
Human Rights Committee (2003) 48
World Conference on Human Rights. Vienna Declaration and Programme of Action (1993)
See generally Nyerere (1969)
See generally Streeten (1980);Javed Burki and Ul Haq (1981)
Commission on Human Rights. The Right to Development (1977)
The Committee on Economic, Social and Cultural Rights has stated that one argument used by
states is that matters involving the allocation of resources should be left to the political authorities
rather than the courts.39 Thus, only if a government has adequate funding can provision be made for
the right to be maintained. The South African Constitutional Court has heard cases on the right to
housing40 and medical care.41 However, in all 3 cases the decision was that the resources allocated
for these issues were limited to the government budget and the court could not rule on how
government policy distributes government revenue annually, a direct reflection of the HRC
approach.42 The arguments presented in these cases are critical to this thesis as the link between
state resources was again left to the political will and the limited resources available to the state.
The difference between what was being requested in these cases and the proposal of this thesis, is
that the accountability function in human rights that allocates resources for development if
progressive and clearly shown to the society would perhaps increase the understanding of the
people whether in the TAC on the limited availability of certain medicines. In the other two cases
that referred to the right to housing policy considerations that showed how future allocations of
state resources were to take place and a tabling of housing as a future expenditure would also go
along way in relieving the pressure on the state to provide housing as long as it shows that others
are benefitting.
The US Supreme Court has stated on several occasions that the government’s interest, and therefore
the public’s interest, in conserving scarce resources is a factor that must be weighed in the
budgetary allocation of fiscal resources. An individual’s safeguard may be outweighed by cost over
the specific action. Thus the cost of protection may also come out of the available resources for a
social welfare programme. The court held that there must be a hearing before the ending of any
welfare benefits.43
2. Tax and Human Rights
The declaration of human rights itself does not suffice for their realisation, and state building
through the development of equitable tax systems is a necessary perquisite for achieving these very
rights. The universality of social and economic rights have been analysed in the context of the
Millennium Development Goals, and other poverty reduction papers, but none of these have so far
explicitly discussed tax systems. Although this emanated from the Doha Financing for Development
process, and the associated initiatives. In seeking domestic resources to finance development it has
been and is being argued that it would be more important to increase tax than to increase aid. It is
also argued that this is greater in importance than planned debt relief, and less prone to dependency
on other states and resource sources.
2.1. The Right to Development, Taxation and State Responsibility
In order to understand the theoretical link between rights and resources or perhaps the absence of
the link between them, one must take a brief look at the history and development of human rights.
In article 55 of the 1945 United Nations Charter states that
With a view to the creation of conditions of stability and well-being which are necessary for peaceful and
friendly relations among nations based on respect for the principle of equal rights and self-determination of
39
Human Rights Committee (1990) Committee on Economic Social and Cultural Rights. General comment No. 9 The
domestic application of the Covenant: Substantive Issues Arising In the Implementation of the International Covenant
on Economic, Social and Cultural Rights (1998) 58 paragraph 10
40
South Africa v. Grootboom (2000) (Grootboom case)
41
Treatment Action Campaign v. Minister of Health (2002) (TAC case) See also Soobramoney v. Minister of Health
(KwaZulu-Natal) (1997) (Soobramoney case)
42
See generally Soobramoney v. Minister of Health (KwaZulu-Natal) (1997) ;South Africa v. Grootboom (2000)
;Treatment Action Campaign v. Minister of Health (2002)
43
Mathews v Eldridge (1976) ; Goldberg v Kelly (1970) and Goss v Lopez (1975)
peoples, the United Nations shall promote:
a. higher standards of living, full employment, and conditions of economic and social progress and
development;
In 1977, the United Nations Commission on Human Rights proclaimed the existence of the right to
development. The right itself was eventually formulated in 1986 in the Declaration on the Right to
Development (DRD). The DRD sets out critical obligations in its articles including state right and
duty. It states at article 3 that
States have the right and the duty to formulate appropriate national development policies that aim at the
constant improvement of the well-being of the entire population and of all individuals, on the basis of their
active, free and meaningful participation in development and in the fair distribution of the benefits resulting
therefrom.
This entails three important basic principles. Firstly, that it is the primary responsibility of states to
apply policies aimed at improving the well-being of the population, secondly, that the human person
is the central subject and should be the active participant and finally that there should be distribution
of benefits.
In addition the DRD went one step further and placed the responsibility of the realisation of the
right to development not only on individual states in consideration of their populations but also on
states collectively for all peoples. Article 4 states that
States have the duty to take steps, individually and collectively, to formulate international development policies
with a view to facilitating the full realization of the right to development.
An important development that is marked by these two provisions was that the DRD through these
articles clearly articulates that it is the state’s obligation to implement the right. Thus, the realisation
of the right to development requires states to link resource allocation to human rights.
2.2. The African Context
The only international treaty that expressly recognises the right to development and is the African
Charter of Human and Peoples Rights, which came into effect in 1984, binds it member states. 44
This has resulted in the inclusion of this right in more recently drafted constitutions like that of
Benin including it in their bill of right.
In 1995 the world embraced significance of well-being and development for all, however, states
have neither absorbed this right into their constitutions nor have they with a few exceptions,
declared this as a human right. 45 From the perspective of the Schumpeter’s typology of fiscal states,
the fiscal state’s levels of development achieved include provision of a diverse array of social
welfare benefits to their citizens and as a result the state perceives no additional rational in adding a
constitutional provision for an issue already well settled in state-society relations. However for the
post-colonial fiscal state this need for the recognition of the developmental needs of their citizens is
necessary in order to provide better guidelines for the resource uses of the state.
Despite these criticisms, the need for international co-operation was recognised and the existence of
state obligations to co-operate in order to realise the right to development, there developed various
instruments allowing for co-operation. These included international economic co-operation in the
form of overseas development assistance or foreign aid; 46 access to markets through trade
liberalisation;47 incentives to increase investment flows and technology transfer; bilateral and
multilateral assistance to implement structural adjustments and economic reforms; debt forgiveness
48
and assisting countries to meet financial crises. 49 However, these strategies have come under
heavy criticism as being oriented towards economic growth and financial considerations which
usually indirectly results in human rights violations. 50
44
45
46
47
48
49
50
Committee on Economic Social and Cultural Rights. General comment No. 9 The domestic application of the
Covenant: Substantive Issues Arising In the Implementation of the International Covenant on Economic, Social and
Cultural Rights (1998)
United Nations (1995) introduction
Foreign aid remains the most important instrument of international co-operation, because it can be used at the
discretion of authorities to pursue certain policies. In addition, there is on record, a voluntary commitment by
industrialised countries to provide at minimum 0.7% of GDP as foreign aid. This proportion has however never been
reached but instead has hovered around 0.32/0.33% for over 15 years. Sengupta (2000) 571, Committee on the
Convention on the Rights of the Child. General Comment No 5: General Measures of Implementation for the
Convention on the Rights of the Child (2003) paragraph 61.
The need to spur development is not new and although the move towards the creation of the right to development is
seen as a relatively new human right, the need to alleviate poverty, raise standards of living ensure full employment
and allow the use of the world’s resources for sustainable development are all fairly well settled parts of human
rights. All these terms are found not only in human rights documents but also the preamble World Trade
Organisation. Marrakesh Agreement Establishing the World Trade Organization (1994) preamble. The mixed impact
of trade and globalisation is a continuing area of discourse to date, see generally Payne (2009)
Sengupta has argued that states should cooperate with each other in ensuring development and eliminating the
obstacles to development. That progress towards realisation of the right to development requires effective national
development policies and a favourable international economic environment. Finally that the international
community should make all efforts to alleviate problems such as the external debt burden of states in order to
supplement efforts of the governments of developing states. See generally Sengupta (2003a)
Sengupta (2000) 570-571
United Nations. Global Consultation on the Right to Development as a Human Right (1990)
There has also been the development of measures with which states can analyse their realisation of
human rights these include the use of approached like Amartya Sen’s capability approach, 51
development indicators52 and the Millennium Development Goals53 which set benchmarks that
allow for the realisation of human rights while taking into consideration the resource constraints
that states face. In addition, global organizations that are formally or informally linked to other
organizations, agencies, and governments around the world, such as the United Nations and the
World Bank, view citizens' participation in claiming their rights and budgetary design practices as a
crucial part of their responsibility to improve their well-being.54 In addition, more recent endeavours
have begun within the United Nations to analysing how fiscal policies and budgets can be converted
in order to realise human rights.
3. Taxation in Africa and the MDGs
This study empirically analysed the statistical possibilities of the relations between tax and human
rights. It utilises data collected by the African Development Bank (ADB), and it goes as far back as
1996 and up to 2008, data for 2009. It has been analysed in order to bring light to the manner in
which the tax per GDP as well as total government revenues (including non-tax revenue from oil
and gas) influence MDG attainment. The data collected has been compiled below into the 2 maps
below. The first (figure 2) shows the GDP per capita while the second, (figure 3) shows Total
Government Revenue per GDP on the African continent. Additional data involved comparing
specific MDG indicators with the tax to GDP ratio.
3.1. Data Analysis
Figure 3 plots the taxes (direct, indirect, trade, source: OECD&ADB) against GDP (in current US
dollars), by country and year.55 Tax groups were created on the basis of this variable for 2003 mainly
because we assumed a five-year lag before the effects of taxes are realised. Also, 2003 had the best
availability of tax data.
Table 1: Table of States Grouped on the Basis of Tax/GDP Ratio
Tax group number
Taxes/GDP
Number of countries
1
0-10%
16
2
10-15%
19
3
15-20%
9
4
20%+
7
This is currently being extrapolated and re-interpreted to apply to all human rights see generally Carpenter (2009)
This is a measure of progress of nations developed allowing for cross-country comparative context. However,
despite a large amount of growing literature on this issue, it has been focussed mainly on the distributional or equity
aspect of development without recognition of changes at the source base. However, equity without efficiency is not
sustainable over time. There is thus the need to look into the optimal use not only of distribution but also collection
of resources. The need to integrate efficiency into the index is a case of attempting to integrate welfare and
production economics. See generally Arcelus, Sharma and Srinivasan (2005)
53
The Millennium Development Goals are the current global and quantified targets for addressing extreme poverty in
its many dimensions—income poverty, hunger, disease, lack of adequate shelter and exclusion—while promoting
gender equality, education, and environmental sustainability. They are also basic human rights—the rights of each
person on the planet to health, education, shelter, and security as pledged in the Universal Declaration of Human
Rights and expounded by the UN Millennium Declaration Project (2005) 1. See generally Schmidt-Traub (2009) for
the most recent discussion on how to achieve the MDGs.
54
There is now an entire World Bank department dedicated to participation and citizen engagement Basok and Ilcan
(2006);World Bank (2009)
55
See the the MDGs as set out in http://data.worldbank.org/about/millennium-development-goals and
http://data.worldbank.org/data-catalog (both accessed on 9/9/2010)
51
52
Source: ADB/OECD
Figure 1 plots total government revenue excluding grants against GDP by country and year. The
figures 4 to 12 show the values of MDG indicators by tax group and year. There is a legend
explaining the variables with each table. For each indicator we have the average value by tax group
and year in the first table as well as availability, i.e. number of countries with available data, by tax
group and year in the second table.
3.2. Data
Based upon AEO Country survey data and the African Development Bank's Statistical department
this dataset includes 53 African countries. However, there is no data for Somalia and only a very
limited coverage and low-quality data for Zimbabwe. We therefore exclude these two countries
from the analysis and consider 51 countries for which we have most tax data for the period 1996 to
2008. We have some estimates for 2009 and some predictions for 2010 and 2011, but we have
restrained from using them because of their presumed quality as was suggested by the ADB and the
OECD who had compiled the tax data
Map 2: GDP per capita
Source: Tax Justice Network
Map 3: Taxes per GDP
Source: Tax Justice Network
In both situations above the bluer the are the more the tax collection.
The Millennium Development Goals (MDGs) are a critical step towards the progressive
achievement of the most crucial human, social and economic rights. Many countries have made
progress towards their achievement, but generally low-income countries in Africa are lagging
behind. This paper will discuss how taxation could be studied as a factor in both progress towards
the MDGs, and their achievement in both progressive and absolute terms.
In discussing tax or the MDGs there are many indices available however the challenge remains to
prove whether there is a correlation between tax and the MDGs.56 The Centre for Global
Development MDG Progress Indicator Index has ranked countries with points in terms of the
progress they have made in achieving their MDGs.57 In figure 2 we study the relationship for lowincome countries in Africa58 in relation to the most up-to-data tax per GDP data, 59 which includes
the components of direct, indirect and trade taxes. 60
The Human Poverty Index for developing countries (HPI-1), and the Human Development Index
See Annex 3
Leo, B and Barmier, J 2010 'Who are the MDG Trailblazers? A New MDG Progress Index' CGD: Washington
D.C. http://www.cgdev.org/content/publications/detail/1424377
56
57
58
World Bank 2010 'Country and Lending Groups' Washington D.C.: World Bank.
http://data.worldbank.org/about/country-classifications/country-and-lending-groups#Low_income
59
See Annex 1
60
ADB / OECD 2010 ‘African Economic Survey’ Abidjan; Paris: ADB; OECD.
(HDI) combine the aspects of a long and healthy life, knowledge, and a decent standard of living 61.
Using these sets of indices at a preliminary level we linked the indices to see if there can be a link to
be built between tax collection and the achievement of the MDGs. We find that there is indeed a
relationship. However, while for the entire group of African countries the relationship was weaker,
notably due to some outliers,62 for low-income countries the relationship is strong.
The relationship became clearer when we divided African countries into four groups according to
their tax per GDP ratio.63 Placing the base year for the tax per GDP at 2003, and assuming a time
lag of 3-5 years from levying taxes to results in specific targets. The latest statistics of MDG
achievement64 used are from 2005-2008.65 The result was clear: most indicators show a positive
relationship, with the notable exception of diseases. 66
Total government revenues per GDP have increased 31%, from 18.7% in 1996 to 24.5% in 2008.
The tax per GDP share, which includes direct, indirect and trade taxation, has risen 16% over from
12.8% in 1996 to 14.9% in 2008.
3.3. Tax and Millennium Development Goals in Africa
The Millennium Development Goals (MDGs) are a critical towards the progressive achievement of
the most crucial human, social and economic rights . 67 Many countries have made progress towards
their achievement, but generally low-income countries in Africa are lagging behind. Here we look at
how taxation should be studied as a factor in both progress towards the goals, and achievement in
absolute terms.
61
UNDP 2009 "Human Development Report 2009" New York: UNDP, p. 208
62
These outliers are Lesotho and Swaziland, with tax per GDP 37.2% and 43.4% respectively, due to high
trade tax receipts under the Southern African Customs Union (SACU). Excluding them: Figure 2 (0.07587);
Figure 3 (0.34695); Figure 4 (0.07981) and Figure 5 (0.29024).
63
See Annex 2
64
World Bank 2010 'Databank' Washington D.C: World Bank. http://data.worldbank.org/
65
With the exception of the Figure 10, source: UN Food and Agricultural Organisation (FAO), FAO 2010
'Food Security Statistics' Rome: Food and Agricultural Organisation.
http://www.fao.org/fileadmin/templates/ess/documents/food_security_statistics/PrevalenceUndernouris
hment_en.xls
66
67
See Annex 3
ibid
Source: Tax Justice Network
The Centre for Global Development MDG Progress Indicator Index has ranked countries with
points in terms of the progress they have made in achieving their MDGs. 68 In Figure 1 we study the
relationship for low-income countries in Africa 69 (See Annex 1) in relation to the most up-to-data
tax per GDP data, which includes the components of direct, indirect and trade taxes. 70
The Human Poverty Index for developing countries (HPI-1), and the Human Development Index
(HDI) combine the aspects of a long and healthy life, knowledge, and a decent standard of living 71.
While for the entire group of African countries the relationship was weaker, notably due to some
outliers,72 for low-income countries the relationship is strong.
68
69
70
71
72
Leo, B and Barmier, J 2010 'Who are the MDG Trailblazers? A New MDG Progress Index' CGD:
Washington D.C. http://www.cgdev.org/content/publications/detail/1424377
World Bank 2010 'Country and Lending Groups' Washington D.C.: World Bank.
http://data.worldbank.org/about/country-classifications/country-and-lending-groups#Low_income
ADB / OECD 2010 ‘African Economic Survey’ Abidjan; Paris: ADB; OECD.
UNDP 2009 "Human Development Report 2009" New York: UNDP, p. 208
These outliers are Lesotho and Swaziland, with tax per GDP 37.2% and 43.4% respectively, due to high
trade tax receipts under the Southern African Customs Union (SACU). Excluding them: Figure 2
(0.07587); Figure 3 (0.34695); Figure 4 (0.07981) and Figure 5 (0.29024).
MDG 1: Eradicate Extreme Poverty and Hunger
Source: Tax Justice Network
In terms of employment, the only significant drop is seen in the over 20% group. This means that
in countries with a lower tax per GDP, adolescent employment is more prevalent and schooling
tends to be of shorter in duration.
MDG 2: Achieve Universal Primary Education
Source: Tax Justice Network
Also a higher tax per GDP ratio also allows for the provision of free primary education. It was once
again only in the countries with a tax per GDP ratio higher than 20% that a significant jump is being
seen in youth literacy rates. Literacy has an impact in all categories of achieving MDGs.
MDG 3: Promote Gender Equality and Empower Women
Source: Tax Justice Network
The proportion of women holding parliamentary seats has risen in Sub-Saharan Africa from an
average of 8 to 18 between 1990 and 2008; and from 2 to 9 in North Africa, countries with a high
tax per GDP ratio perform the best, equally well as developed nations in 2010 73.
MDG 4: Reduce Child Mortality
Source: Tax Justice Network
One of the targets where sub-Saharan Africa has lagged behind is under-5 mortality ratios. The subSaharan target was 70, while the Northern African target was 28. The Sub-Saharan African target is
achieved by over 20%, all of which are sub-Saharan African countries 74
MDG 5: Improve Maternal Health
73
74
UN 2010 'Millennium Development Goals 2010' New York: United Nations, p. 25.
Ibid. p.
Source: Tax Justice Network
Adolescent fertility rate in both sub-Saharan Africa and North Africa hasn’t changed much since
1990, but breaking down groups according to their tax effort we see significant variations, even for
the over 20% group it is still three times higher than in developed nations in 2010 75
MDG 6: Combat HIV / AIDS, Malaria, and Other Diseases
Source: Tax Justice Network
The incidence of tuberculosis has no apparent relationship with the tax effort, tuberculosis is highly
related to the prevalence of HIV / AIDS, which is highest in the countries of Southern Africa which
are predominantly in the over 20% group of countries. However this is possibly explained by the
HIV, Malaria and TB Fund set up at the WHO which receives a lot of attention in Africa.
MDG 7: Ensure Environmental Sustainability
75
Ibid.
Source: Tax Justice Network
Environmental production also tends to increase with the tax effort in Africa, but it seems to peak
with countries in the above 15% group, reducing dramatically in the over 20% group possibly due
to commercial agriculture, and population pressures on land
MDG 8: Develop a Global Partnership for Development
Source: Tax Justice Network
The amount a country receives in Overseas Development Assistance is in no way related to the tax
effort. While one would expect aid receipts per capita to decrease as tax effort increases, aid instead
is allocated according to other factors.
In addition, the relationship is also clear when African countries are divided in four groups
according to their tax per GDP ratio (See Annex 2). The basis year for the tax per GDP at 2003,
assuming a time lag of 3-5 years from levying taxes to results in specific targets. The latest statistics
of MDG achievement76 are from 2005-2008.77 Most indicators show a positive relationship, with
the notable exception of diseases (see Annex 3). However since there exists a global fund on HIV,
malaria and tuberculosis the massive input of resources into this field shows that there is an effect
through donor aid in that situation however, this skews the results as regards the tax revenue to
distribution ratios. Total government revenues per GDP have on average increased to 31%, from
18.7% in 1996 to 24.5% in 2008. The tax per GDP share, which includes direct, indirect and trade
taxation, has risen 16% over from 12.8% in 1996 to 14.9% in 2008.
76
77
World Bank 2010 'Databank' Washington D.C: World Bank. http://data.worldbank.org/
With the exception of the Figure 10, source: UN Food and Agricultural Organisation (FAO), FAO 2010
'Food Security Statistics' Rome: Food and Agricultural Organisation.
http://www.fao.org/fileadmin/templates/ess/documents/food_security_statistics/PrevalenceUnderno
urishment_en.xls
Source: Tax Justice Network
4. Conclusions
Tax systems in Africa are key to the achievement of Millennium Development Goals by the year
2015. Accelerating domestic resource mobilisation to finance the MDGs is the seventh agenda point
of the 2000- 2015 MDG Action Agenda78, but it is also the least discussed in terms of solutions. The
MDG monitoring framework should consider taxation, for instance, knowing the share of aid that is
spent on tax co-operation.
78
UNDP 2010 “What will it take the achieve the Millennium Development Goals: An International
Assessment” New York: UNDP, p. 40
Bibliography
ADB / OECD 2010 ‘African Economic Survey’ Abidjan; Paris: ADB; OECD.
Arcelus, F. J., B. Sharma, et al. (2005) "The Human Development Index Adjusted for
Efficient Resource Utilization." WIDER Research Paper No 2005/08, 12.
Basok, T. and S. Ilcan (2006). "In the Name of Human Rights: Global Organizations
and Participating Citizens." Citizenship Studies 10(3): 309-327.
Carpenter, M. (2009). "The capabilities approach and critical social policy: Lessons
from the majority world?" Critical Social Policy 29: 351.
Leo, B and Barmier, J 2010 'Who are the MDG Trailblazers? A New MDG Progress
Index' CGD: Washington D.C.
http://www.cgdev.org/content/publications/detail/1424377
Committee Against Torture. Consideration of Reports Submitted by States Parties
Under Article 19 of the Convention: Conclusions and Recommendations of the
Committee Against Torture: Hungary (2006)
Commission on Human Rights. The Right to Development (1977)
Committee on the Convention on the Rights of the Child. General Comment No 5:
General Measures of Implementation for the Convention on the Rights of the Child
(2003)
Committee on Economic Social and Cultural Rights. General comment No. 9 The
domestic application of the Covenant: Substantive Issues Arising In the
Implementation of the International Covenant on Economic, Social and Cultural
Rights (1998)
Committee on Economic Social and Cultural Rights. Concluding observations of the
Committee on Economic, Social and Cultural Rights: Kenya (1993)
Committee on the Rights of the Child. Consideration of Reports Submitted by States
Parties Under Article 44 of The Convention : Concluding observations: Bolivia
(2005)
Donnelly, J. (2003). Universal human rights in theory and practice. Ithaca, Cornell
University Press.
Henkin, L. (1987). International Law, Martinus Nijjhof.
Holmes, S. and C. R. Sunstein (1999). The cost of rights : why liberty depends on
taxes. New York ; London, W.W. Norton.
Human Rights Committee (2003). Report on Mexico Produced by the Committee
under Article 20 of the Convention, and Reply from the Government of Mexico,
United Nations.
Human Rights Committee. General Comment No. 14: Nuclear weapons and the right
to life (Article. 6) (1984)
Human Rights Committee (1990) Committee on Economic Social and Cultural
Rights. General comment No. 9 The domestic application of the Covenant:
Substantive Issues Arising In the Implementation of the International Covenant on
Economic, Social and Cultural Rights (1998)
Mathews v Eldridge (1976) ; Goldberg v Kelly (1970) and Goss v Lopez (1975)
Assessing Progress in Africa toward the Millennium Development Goals (MDG
Report 2009)
Nyerere, J. (1969). Stability and Change in Africa. Africa Contemporary Record.
Annual survey and documents, 1968-1969. C. Legum. London, Rex Collings. 2: C 3031.
Organisation of the African Union. African Charter of Human and Peoples Rights
(1982) article 24
Payne, C. (2009). "Bringing Home the Bacon or Not? Globalization and Government
Respect for Economic and Social Rights." Human Rights Review 10(3): 413-429.
Pogge, T. W. M. (2008). World poverty and human rights, Polity.
Sampford, C. J. G. and D. J. Galligan (1986). Law, rights, and the welfare state.
London ; Wolfeboro, N.H., Croom Helm.
SengSengupta, A. (2000). "Realizing the right to development." Development and
Change 31(3): 553-578 at 570-571.upta (2000) 570-571
Sengupta, A. (2003). The Right to Development as a Human Right. Boston: FrancoisXavier Bagnoud Center, Harvard University., Francois-Xavier Bagnoud Center,
Harvard University. 31: 4.
Shantayanan Devarajan, Margaret J. Miller, and Eric V. Swanson, The Costs of
Attaining the Millennium Development Goals: This paper summarizes the results of a
World Bank Policy Research Working Paper, “Development Goals: History, Prospects
and Costs,”
Soobramoney v. Minister of Health (KwaZulu-Natal) (1997) ;South Africa v.
Grootboom (2000) ;Treatment Action Campaign v. Minister of Health (2002)
Stoljar, S. (1984). An analysis of rights. London, Macmillan.
Streeten, P. (1980). "Basic Needs and Human-Rights." World Development 8(2): 107111.
Javed Burki and Ul Haq (1981)
UN 2010 'Millennium Development Goals 2010' New York: United Nations
UN Food and Agricultural Organisation (FAO), FAO 2010 'Food Security Statistics'
Rome: Food and Agricultural Organisation.
http://www.fao.org/fileadmin/templates/ess/documents/food_security_statistics/Preval
enceUndernourishment_en.xls
UNDP 2009 "Human Development Report 2009" New York: UNDP
United Nations. Core Document Forming Part of the Reports of States Parties: Bolivia
(2005)
UNDP 2010 “What will it take the achieve the Millennium Development Goals: An
International Assessment” New York: UNDP
United Nations. Global Consultation on the Right to Development as a Human Right
(1990)
United Nations (1995). Copenhagen Declaration on Social Development. World
Summit for Social Development Copenhagen 1995 Copenhagen.
United Nations General Assembly. Universal Declaration of Human Rights (1948)
World Bank. (2009). "Participation and Civic Engagement." Retrieved 24/9/09,
2009, from
http://web.worldbank.org/WBSITE/EXTERNAL/TOPICS/EXTSOCIALDEVELOP
MENT/EXTPCENG/0,,menuPK:410312~pagePK:149018~piPK:149093~theSitePK:
410306,00.html.
World Bank 2010 'Country and Lending Groups' Washington D.C.: World Bank.
http://data.worldbank.org/about/country-classifications/country-and-lendinggroups#Low_income
World Conference on Human Rights. Vienna Declaration and Programme of Action
(1993)
World Trade Organisation. Marrakesh Agreement Establishing the World Trade Organization
(1994)
Annexes
Annex 1: Low-Income Countries in Africa
Benin, Burkina Faso, Burundi, Central African Republic, Chad
Comoros, Congo, Dem. Rep. of, Eritrea, Ethiopia, Gambia, Ghana, Guinea, GuineaBissau, Kenya, Liberia, Madagascar, Malawi, Mali, Mauritania, Mozambique, Niger,
Rwanda, Sierra Leone, Tanzania, Togo, Uganda, Zambia
Annex 2: Countries according to their Tax per GDP ratio in
2003
(Somalia and Zimbabwe were excluded due to data access regarding taxation)
Tax per GDP
Country
<10%
(n=16)
Algeria,
Angola,
Central African
Republic,
Chad,
Comoros,
Democratic
Republic of
Congo,
Republic of
Congo,
Equatorial
Guinea,
Guinea-Bissau,
Liberia, Libya,
Madagascar,
Niger, Nigeria,
Sudan,
Sao Tome and
Principe
10%-15%
(n=19)
Botswana,
Burkina Faso,
Cameroon,
Côte d’Ivoire,
Egypt, Eritrea,
Ethiopia,
Gabon,
Gambia,
Guinea,
Malawi,
Mali,
Mozambique,
Rwanda, Sierra
Leone,
Tanzania,
Togo, Tunisia,
Uganda
15%-20%
(n=9)
Benin,
Burundi, Cape
Verde, Ghana,
Kenya,
Mauritius,
Morocco,
Senegal,
Zambia
>20%
(n=7)
Djibouti,
Lesotho,
Mauritania,
Namibia,
Seychelles,
South Africa,
Swaziland
Annex 3: Tax per GDP ratios for 2003 and MDG Achievement 2005-2008 in Africa
Group / Year 2005
2006
2007
Goal 1: Eradicate Extreme Poverty and Hunger
Prevalence of undernourishment (% of population)
<10%
31,58
10%-15%
27,68
15%-20%
23,11
>20%
15,50
Employment to population ratio, ages 15-24, female (%)
<10%
41,2
43,5
42,5
10%-15%
47,2
47,3
47,3
15%-20%
42,3
42,4
42,5
>20%
20,8
21,8
21,2
Employment to population ratio, ages 15-24, male (%)
<10%
58,7
59,6
59,7
10%-15%
55
54,7
54,7
15%-20%
56,6
56
56
>20%
26,4
27,2
26,6
Employment to population ratio, ages 15-24, total (%)
<10%
49,9
51,5
51
10%-15%
51,1
51,1
51
15%-20%
49,5
49,2
49,2
>20%
23,6
24,4
23,9
Employment to population ratio, 15+, female (%)
<10%
49,2
51,7
50,1
10%-15%
57,4
57,8
57,8
15%-20%
53,4
53,6
53,8
2008
2005
2006
2007
2008
Average
N
-
-
12
15
8
6
-
-
31,58
27,68
23,11
15,50
12
15
8
6
41,2
47,3
42,5
20,9
13
19
9
5
14
19
9
5
13
19
9
5
15
19
9
5
42,1
47,3
42,4
21,2
55
76
36
20
57,8
54,4
55,6
26
13
19
9
5
14
19
9
5
13
19
9
5
15
19
9
5
59,0
54,7
56,1
26,6
55
76
36
20
49,5
50,9
49,1
23,5
13
19
9
5
14
19
9
5
13
19
9
5
15
19
9
5
50,5
51,0
49,3
23,9
55
76
36
20
49,8
57,9
54
13
19
9
14
19
9
13
19
9
15
19
9
50,2
57,7
53,7
55
76
36
>20%
40,6
42,2
41,9
Employment to population ratio, 15+, male (%)
<10%
77,6
78,3
78,6
10%-15%
74,3
74,4
74,6
15%-20%
74,9
74,7
74,8
>20%
52,4
53,6
53,5
Employment to population ratio, 15+, total (%)
<10%
63,1
64,8
64,2
10%-15%
65,8
66
66,1
15%-20%
63,8
63,9
64
>20%
46,2
47,6
47,4
Goal 2: Achieve Universal Primary Education
Literacy rate, youth total (% of people ages 15-24)
<10%
36,5
91,8
10%-15%
58,9
61,8
39,3
15%-20%
50,9
>20%
Primary completion rate, total (% of relevant age group)
<10%
51,4
48,7
49
10%-15%
61,3
59,5
62,5
15%-20%
74,1
73,2
75,1
>20%
70,9
65,3
81
School enrolment, primary (% net)
<10%
63,1
68,6
65,4
10%-15%
75,1
76,2
77,8
15%-20%
79,8
82,1
85
>20%
72,9
74
75,4
Goal 3: Promote Gender Equality and Empower Women
Ratio of female to male primary enrolment (%)
41,8
5
5
5
5
41,6
20
77,8
74,5
74,7
53
13
19
9
5
14
19
9
5
13
19
9
5
15
19
9
5
78,1
74,5
74,8
53,1
55
76
36
20
63,7
66,2
64,1
47,1
13
19
9
5
14
19
9
5
13
19
9
5
15
19
9
5
64,0
66,0
64,0
47,1
55
76
36
20
77,2
80,6
80,8
88,4
1
2
0
0
1
2
1
0
0
1
0
0
12
14
8
5
68,5
42,1
65,9
88,4
14
19
9
5
62,8
56,1
75,7
62
8
15
8
7
6
14
8
6
8
16
8
6
9
11
9
3
42,1
59,9
74,5
69,8
31
56
33
22
75,1
78,3
87
67,1
4
14
9
6
6
13
9
6
4
12
8
6
4
12
9
2
68,1
76,9
83,5
72,4
18
51
35
20
<10%
83,2
83,6
83,7
86,3
10%-15%
90,7
91
91,2
91,5
15%-20%
92,7
94,5
96,5
95,8
>20%
96,8
95,8
96,8
98,1
Proportion of seats held by women in national parliaments (%)
<10%
10,8
10,2
11,2
10,4
10%-15%
17,1
18
18,3
19,1
15%-20%
12,8
14,8
15,2
16
>20%
20,4
20,4
20,9
24,1
Goal 4: Reduce Child Mortality
Mortality rate, under-5 (per 1,000)
<10%
160,9
155,8
155,7
140,2
10%-15%
119
114,9
111,2
107,8
15%-20%
97,8
95,8
93,9
92,3
>20%
78,7
75
72,7
70,8
Mortality rate, infant (per 1,000 live births)
<10%
98,1
95,2
94
86,5
10%-15%
76,2
73,8
71,7
69,7
15%-20%
62
60,9
59,8
58,9
>20%
56,6
54,4
53
51,8
Goal 5: Improve Maternal Health
Maternal mortality ratio (modelled estimate, per 100,000 live births)
<10%
971,5
10%-15%
758,4
15%-20%
592,8
>20%
571,7
Adolescent fertility rate (births per 1,000 women ages 15-19)
<10%
122,5
120,8
123
104,7
10%-15%
107,9
105,6
103,4
100,9
9
16
9
7
9
17
9
6
9
17
8
7
10
13
9
3
84,2
91,1
94,9
96,9
37
63
35
23
12
19
9
6
14
19
9
6
13
19
9
7
16
19
9
6
10,7
18,1
14,7
21,5
55
76
36
25
13
19
9
7
14
19
9
7
13
19
9
7
16
19
9
7
153,2
113,2
95,0
74,3
56
76
36
28
13
19
9
7
14
19
9
7
13
19
9
7
16
19
9
7
93,5
72,9
60,4
54,0
56
76
36
28
13
19
9
6
0
0
0
0
0
0
0
0
0
0
0
0
971,5
758,4
592,8
571,7
13
19
9
6
13
19
14
19
13
19
16
19
117,8
104,5
56
76
15%-20%
80,6
79,3
78,1
76,5
9
>20%
72,6
70,5
68,4
65,9
6
Goal 6: Combat HIV/AIDS, Malaria and Other Disease
Prevalence of HIV, total (% of population ages 15-49)
<10%
2,4
2,2
2,5
12
10%-15%
5,3
5,2
5,1
18
15%-20%
3,3
3,3
3,3
7
>20%
14,5
14,5
14,4
6
Antiretroviral therapy coverage, (% of people with advanced HIV infection)
<10%
10,2
17,4
0
10%-15%
26,2
32
0
15%-20%
29,3
35
0
>20%
28
37,2
0
Tuberculosis case detection rate (all forms)
<10%
49,6
56,2
63
62,2
12
10%-15%
44,9
44
45,2
45,8
19
15%-20%
47,6
47,8
47,5
49,3
9
>20%
62,4
66,9
56,1
61
7
Incidence of tuberculosis (per 100,000 people)
<10%
248,5
246,1
257,8
212,2
12
10%-15%
321,2
319,8
318,8
318,7
19
15%-20%
247,9
238,5
231,2
223,5
9
>20%
638,7
642,6
645,6
649,2
7
Tuberculosis treatment success rate (% of registered cases)
<10%
73,2
68,2
74,1
11
10%-15%
76,4
76,6
79
19
15%-20%
79,1
82,7
84,5
9
>20%
65,9
62,9
74
6
Tuberculosis death rate (per 100,000 people)
9
6
9
6
9
6
78,6
69,4
36
24
13
18
7
6
11
18
7
6
0
0
0
0
2,4
5,2
3,3
14,5
36
54
21
18
13
19
8
6
12
19
8
6
0
0
0
0
13,8
29,1
32,2
32,6
25
38
16
12
12
19
9
6
9
19
8
6
16
19
9
7
57,8
45,0
48,1
61,6
49
76
35
26
13
19
9
7
12
19
9
7
16
19
9
7
241,2
319,6
235,3
644,0
53
76
36
28
9
19
8
6
11
18
7
7
0
0
0
0
107,8
77,3
82,1
67,6
31
56
24
19
<10%
63,1
59,4
64,6
10%-15%
88,1
87,9
86,7
15%-20%
57
53,8
51,1
>20%
145,8
142,4
164,2
Goal 7: Ensure Environmental Sustainability
Forest area (sq. km)
<10%
260693,5
250044,3
266359,6
10%-15%
90933,9
9029,7
89663,3
15%-20%
74613,1
73853,6
73093,7
>20%
25322,3
25208,7
25095,1
Forest area (% of land area)
<10%
32,9
32
33,9
10%-15%
26,9
26,9
26,8
15%-20%
23,2
22,9
22,7
>20%
19,4
19,5
19,5
Terrestrial protected areas (% of total surface area)
<10%
10%-15%
15%-20%
>20%
Marine protected areas (% of total surface area)
<10%
10%-15%
15%-20%
>20%
Improved water source (% of population with access)
<10%
58,7
10%-15%
70
15%-20%
73,9
-
-
13
19
9
7
14
19
9
7
13
19
9
7
0
0
0
0
62,4
87,6
54,0
150,8
40
57
27
21
-
13
19
9
7
14
19
9
7
13
19
9
7
0
0
0
0
259032,5
63209,0
73853,5
25208,7
40
57
27
21
-
13
19
9
7
14
19
9
7
13
19
9
7
0
0
0
0
32,9
26,9
22,9
19,5
40
57
27
21
10,4
13,3
14,5
11,5
0
0
0
0
0
0
0
0
0
0
0
0
14
19
9
7
10,4
13,3
14,5
11,5
14
19
9
7
4,2
1,7
2,3
5,5
0
0
0
0
0
0
0
0
0
0
0
0
15
19
9
7
4,2
1,7
2,3
5,5
15
19
9
7
-
0
0
0
14
19
8
0
0
0
0
0
0
58,7
70
73,9
14
19
8
>20%
79,3
Improved sanitation facilities (% of population with access)
<10%
33,6
10%-15%
34,6
15%-20%
46,1
>20%
45,2
Population living in slums, (% of urban population)
<10%
78,4
10%-15%
60,5
15%-20%
49,2
>20%
32,6
Annual freshwater withdrawals, total (% of internal resources)
<10%
70,7
10%-15%
218,2
15%-20%
12,6
>20%
84,1
Renewable internal freshwater resources per capita (cubic meters)
<10%
18967,3
15985,8
10%-15%
11054,4
10825,5
15%-20%
1865,2
1824,6
>20%
1539,9
1517,1
CO2 emissions (kt)
<10%
21803,1
18911,7
10%-15%
12479
12152,5
15%-20%
8920,2
8982,9
>20%
69225,2
70180,9
CO2 emissions (metric tons per capita)
<10%
1,1
1
10%-15%
0,6
0,6
-
0
6
0
0
79,3
6
0
0
0
0
14
19
8
6
0
0
0
0
0
0
0
0
33,6
34,6
46,1
45,2
14
19
8
6
11
16
7
3
0
0
0
0
0
0
0
0
0
0
0
0
78,4
60,5
49,2
32,6
11
16
7
3
0
0
0
0
0
0
0
0
13
18
8
6
0
0
0
0
70,7
218,2
12,6
84,1
13
18
8
6
0
0
0
0
0
0
0
0
13
19
9
6
16
19
9
6
17476,6
10940,0
1844,9
1528,5
29
38
18
12
13
19
9
6
14
19
9
6
0
0
0
0
0
0
0
0
20357,4
12315,8
8951,6
69703,1
27
38
18
12
13
19
14
19
0
0
0
0
1,1
0,6
27
38
15%-20%
0,7
0,8
>20%
3,4
3,5
CO2 emissions (kg per PPP $ of GDP)
<10%
0,3
0,2
10%-15%
0,2
0,2
15%-20%
0,3
0,2
>20%
0,4
0,4
-
-
9
6
9
6
0
0
0
0
0,8
3,5
18
12
-
-
13
19
9
6
14
19
9
6
0
0
0
0
0
0
0
0
0,3
0,2
0,3
0,4
27
38
18
12
14
19
9
7
13
19
9
7
16
19
9
6
21,5
11,3
11,8
4,5
56
76
35
27
14
19
9
7
13
19
9
7
16
19
9
7
59,8
50,8
87,9
78,8
56
76
36
28
11
17
9
6
11
17
9
6
12
17
9
4
6,9
5,4
6,8
4,6
44
69
36
22
13
17
9
7
12
19
9
7
15
19
9
7
21,3
24,4
31,5
44,0
52
73
36
28
Goal 8: Develop a Global Partnership for Development
Net ODA received (% of GNI)
<10%
14,70
12,90
17,10
19,90
13
10%-15%
11,80
11,20
11,60
10,40
19
15%-20%
13,20
11,60
11,40
11,10
8
>20%
4,10
4,20
5,20
4,40
7
Net ODA received per capita (current US$)
<10%
68,20
43,80
47,50
79,60
13
10%-15%
39,50
43,30
51,80
68,50
19
15%-20%
79,50
78,00
86,90
107,00
9
>20%
69,00
74,50
82,10
89,40
7
Debt service (PPG and IMF only, % of exports, excluding workers' remittances)
<10%
6,70
11,00
5,00
4,70
10
10%-15%
7,20
6,00
4,50
3,90
18
15%-20%
11,40
7,90
4,20
3,50
9
>20%
4,70
5,60
4,60
3,60
6
Mobile cellular subscriptions (per 100 people)
<10%
10,20
15,80
23,60
35,70
12
10%-15%
13,80
20,10
27,30
36,20
18
15%-20%
18,90
26,00
34,50
46,50
9
>20%
32,40
39,50
46,60
57,40
7
Telephone lines (per 100 people)
<10%
1,50
1,50
10%-15%
2,50
2,80
15%-20%
6,10
6,00
>20%
7,30
7,10
Internet users (per 100 people)
<10%
1,90
2,80
10%-15%
2,60
3,30
15%-20%
5,60
7,50
>20%
6,40
7,90
1,80
2,60
6,40
7,50
2,70
2,70
6,50
7,50
11
19
9
7
12
17
9
7
12
19
9
7
15
19
9
7
1,9
2,7
6,3
7,4
50
74
36
28
2,70
3,90
8,50
8,80
5,20
5,20
11,70
9,60
11
19
9
7
12
18
9
7
12
19
9
7
15
19
9
7
3,2
3,8
8,3
8,2
50
75
36
28
Baixar