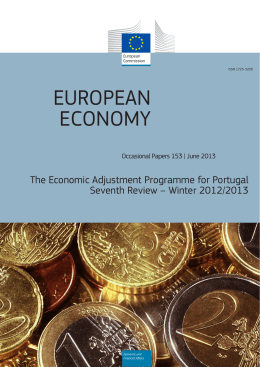
Department of Economics António Afonso, Jorge Caiado, Miguel St. Aubyn The macro impact of the Portuguese Constitutional Court decisions regarding the budgetary proposals of the Portuguese Budget Law (2012, 2013, 2014) WP06/2015/DE/UECE/CEMAPRE _________________________________________________________ WORKING PAPERS ISSN 2183-1815 The macro impact of the Portuguese Constitutional Court decisions regarding the budgetary proposals of the Portuguese Budget Law (2012, 2013, 2014) * António Afonso$, Jorge Caiado #, Miguel St. Aubyn $ Abstract: We review the main budgetary measures not accepted by the Portuguese Constitutional Court in the Budget Laws of 2012, 2013 and 2014. Considering the feedback effect of the fiscal impulse, the impact on the budget balance is -0.42% and of -0.34% of GDP respectively for 2013 and for 2014; in both years the impact of the fiscal expansion could result in rather mitigated reductions in the unemployment rate in the range of 0.1 percent; the impact on the government debt level is around 0.42% of GDP in 2013, declining from then on, in a conservative estimate, and about 2.95% of GDP in 2020 in the worst case scenario. JEL: E62; E65; H62. Keywords: budget balance; fiscal consolidation; debt-to-GDP ratio; Portugal. * The opinions expressed herein are those of the authors and do not necessarily reflect those of the institutions to which the authors are affiliated or of the European Court of Auditors (ECA). This project was supported via funding from the ECA. We also thank Bruno Damásio for research assistance. $ ISEG/UL - University of Lisbon, Department of Economics; UECE – Research Unit on Complexity and Economics. UECE is supported by FCT (Fundação para a Ciência e a Tecnologia, Portugal), emails: [email protected]; [email protected]. # ISEG/UL - University of Lisbon, Department of Mathematics; CEMAPRE – Centre for Applied Mathematics and Economics, email: [email protected]. 1. Introduction In this report we review the main measures proposed by the Portuguese Budget Laws of 2012, 2013 and 2014, which were finally not accepted by the Portuguese Constitutional Court. Such fiscal measures have a macroeconomic impact that can be assessed by taking into account notably: i) a measure of the fiscal multiplier; ii) and measures of fiscal elasticities for either the overall budgetary balance or for the relevant individual budgetary items. For the fiscal multipliers, several sources are available, both from the European Commission and from the OECD, and this is also the case for the budgetary elasticities. Still, we have also estimated tentative elasticities for the relevant budgetary items. Those measures, once accepted or rejected by the Portuguese Constitutional Court, change both the composition, but also the size of the budget balance, and so it is possible to gauge their impact in terms of the public finances sustainability, and, notably, its relevance for the future turning point of the currently still upward looking path of the debt-to-GDP ratio. In this context, a simulation exercise for alternative debt ratio paths will be provided to determine plausible turning points and to illustrate challenges to fiscal sustainability. In section two we review the main measures included in the 2013 and 2014 Budget Laws, which were then replaced, following the assessment of the Portuguese Constitutional Court. In section three we assess the macro impact of those changes. Section four concludes the report. 2. Measures in the 2013 and 2014 Budget Laws 2.1. 2013 Budget, measures that were revised The 2013 budget original version included the holiday allowances suspension (1/14 of the annual wage) paid to public servants and to pensioners. This suspension was formulated as follows: for wages below 600€ per month, the suspension was not to be applied; for wages between 600€ and 1100€, the allowance would be equal to 1320€ 1.2 times the monthly remuneration; for wages above 1100€, the allowance would be completely suspended. Following the Constitutional Court decision number 187/2013, this suspension was ruled as unconstitutional, and the Portuguese government had to pay back holiday allowances to public servants and pensioners. The necessary amendment to the budget was presented in May 2013 (supplementary budget). The forecast budget deficit was then 5.5 percent of GDP for 1 2013 (the earlier estimate was 4.5 percent). This deficit revision was accompanied by a worsening of macroeconomic perspectives. Restoring holiday allowances had an impact of 1274 million euros in the budget deficit, according to official estimates (see the 2013 government supplementary budget report). Some more compensation measures were envisaged, but no precise quantification was provided. These measures were the following: measures of structural spending reduction in all ministries; diminishing charges with public/private partnerships; measures to reduce the levels of tax evasion and of the parallel economy. Regarding the measures in the 2012 Budget Law, later considered not constitutionally acceptable (the reduction of 2/14 of the annual wage), but still allowed to be in place in 2012, one can hypothesise that they were a restriction for the formulation of the 2013 Budget. Therefore, in the absence of such constitutional ruling, the 2013 Budget might have had a lower level of wages. In practice, that would mean, for the sake of our simulations, having less the equivalent of two wages and the corresponding reduction in personal income taxes. We will discuss this additional scenario later in the next section. 2.2. 2014 Budget, measures that were revised The 2014 Budget Law included provisions that aimed at aligning the public sector pension scheme with the general system. On 19 December 2013, the Constitutional Court ruled that these provisions were unconstitutional. Spending with pensions was then to increase by 734.9 million euros. Consequently, the government intended to fill this gap by redesigning two measures: i) an increase in the CES (Extraordinary Solidarity Contribution, Contribuição Extraordinária de Solidariedade), namely through the lowering of both the threshold below which pensions are exempted and of the thresholds above which the highest contribution rates apply (official numbers provided an estimated increase in receipts of 576 million euros). ii) a further increase by one percentage point (from 2.5 percent to 3.5 percent) of the beneficiaries' contribution to the special public sector health insurance 2 schemes (ADSE, SAD, ADM)1 with a view to ensuring the self-financing of these systems (the estimated increase in receipts amounts to 132.7 million euros). The first compensation measure was presented in a supplementary budget in the beginning of 2014. Moreover, the changes to ADSE will be implemented via a Decree Law which does not require parliamentary approval. Both of these measures should apply from the second quarter of 2014 onwards. 3. Assessing the macro effects 3.1. The budgetary elasticities It is important to know how several key budgetary components react to changes in the respective base. For instance, by how much is the budget balance going to change, as a percentage of GDP, for a 1 percent change in GDP, which we can measure via the budget balance semi-elasticity. The main budgetary items, for which such elasticities are usually computed, are: the corporate tax revenues; the personal income tax revenues; the revenues from the social security contributions; current spending; and the total budget balance. For the case of the indirect tax revenues, an elasticity of one is commonly assumed, notably by international organizations (see Girouard and André, 2005, for the OECD approach, and Mourre et al., 2013 for the EC approach). For the specific case of Portugal, both the OECD and the EC report a semi-elasticity of 0.46 for the total budget balance (vis-à-vis a change of 1 percent in GDP). On the other hand, Afonso and Claeys (2008) report for Portugal elasticities of 0.67 and 1.58 respectively for total spending and total revenue (for the period 1970-2004). In the case of 2014, the compensation measures imply an increase in taxes and social security. Although we are going to use the elasticity of the overall budget balance, we have also computed elasticities for the three main items of budgetary revenues for Portugal. In Table A1 in the Appendix we can see that such elasticities range from 1.3 to 1.7 in the period 1978-2013. 3.2. The fiscal multipliers In order to assess the effect on GDP of changes in the fiscal components of the budget balance, and of the budget balance itself, it is important to have an idea of the fiscal multiplier(s).2 Such calculations are rather difficult and quite often they are not 1 ADSE - Direção-Geral de Proteção Social aos Trabalhadores em Funções Públicas; SAD - Serviços de Assistência na Doença;.ADM - Assistência na Doença aos Militares. 2 The fiscal multiplier is the ratio of a change in GDP (ΔY) after an exogenous change in the budget deficit or budgetary spending (ΔG) with respect to the baseline (potential GDP and structural deficit, respectively, although authors use variations of these concepts). 3 consensual in the literature, both in terms of the sign and in terms of the magnitude of the multiplier. Moreover, crisis multipliers also tend to exacerbate more the fiscal effects on GDP. In some studies, a cumulative multiplier of government spending larger than one is sometimes uncovered. Ramey (2011) recently surveyed the government spending multiplier within a bracket of 0.8 and 1.5, while Spilimbergo et al. (2009) report multipliers between 0.5 and 1.0 for medium-sized countries and 0.5 or less for small open economies (see also Illing and Watzka, 2013). For instance, Afonso and Sousa (2012), using a Bayesian Structural Vector Autoregression for the US, the UK, Germany and Italy report that government spending shocks, in general, have a small effect on Gross GDP. For the case of Portugal, Afonso and Sousa (2011a) report the large persistence of government spending, which hampers the actions of the fiscal authorities to act upon the economy in a timely and temporary manner to stabilize the economy, with a downside also in terms of fiscal sustainability.3 In addition, Afonso and St. Aubyn (2009) document the existence of positive effects of public investment on output, for Portugal, therefore a positive multiplier for this budgetary component, in the period 1960-2005. Still for Portugal, Pereira and Wemans (2013) report average one year cumulative fiscal multipliers of 0.2 for public consumption, 1.7 for the compensation of employees, and -1.2 for direct taxes. Finally, according to simulations by the ECB (2014), a fiscal consolidation in small countries, amounting to 1 percent of GDP reduces domestic GDP by 0.45 percent (cumulative effect over a three-year period). 3.3. Fiscal and macro effects In order to assess the macro effects of the changes done in the 2013 and 2014 Budget Laws, we have used a semi-elasticity of 0.46 for the budget balance (notably as in Girouard and André, 2005, and the EC). Regarding the fiscal multiplier, we have used for our benchmark calculations the value of 0.5 (see Box 1). We report in Table 1 the results for the benchmark scenario. From Table 1 we can conclude that the immediate worsening of the budget balance is around 0.54 percent of GDP and 0.44 percent of GDP respectively in 2013 and in 2014. Therefore, such an increase in the budget deficit would have resulted in a more expansionary fiscal policy in both years. Taking into account the feedback effect that 3 Still, for instance Afonso and Sousa (2011b) mention that for Portugal, the effects on GDP are negative and government spending has a “crowding-out” effect on the private sector. More specifically, a 1 percent positive shock in government spending has a maximum impact on GDP of −0.1 percent. 4 such fiscal impulse has in the economy, via the multiplier and the semi-elasticity, we observe an impact on the budget balance of -0.42 percent of GDP and of -0.34 percent of GDP respectively for 2013 and for 2014. Considering the compensation measures proposed by the Government, we see that the effect on the budget balance is almost negligible for the case of 2014, being the expected effect on GDP also residual. Table 1 - Central estimates (% of GDP) 1. Withdrawn measures 1.1 Impact on GDP 1.2 Impact on budget balance, with feedback 2013 0.539 0.270 -0.415 2014 0.437 0.219 -0.337 2. Compensation measures 2.1 Impact on GDP 2.2 Impact on budget balance with feedback n.a. n.a. n.a. -0.421 -0.211 0.325 3. Withdrawn + compensation measures (1+2) 3.1 Impact on GDP 3.2 Impact on budget balance, with feedback 0.539 0.270 -0.415 0.016 0.008 -0.012 In terms of the possible effect on unemployment we can recall Okun’s Law (Okun, 1962), which measures potential output in terms of the unemployment gap, implying a direct relation between increases in unemployment and output growth. We assume here from the literature, as usually accepted, that for each 2-2.5 percent drop in GDP, relatively to potential GDP, the unemployment rate increases by around 1 percent (see Ball, Leigh and Loungani, 2012). Therefore, in the cases of 2013 and 2014, the impact of the fiscal expansion on GDP, could result in rather mitigated reductions in the unemployment of around 0.1 percent. In order to provide some sensitivity analysis notably regarding the use of different magnitudes for the fiscal multiplier and for the budgetary semi-elasticity, we report in Table 2 a summary grid of the effects on the budget balance, considering the respective feedback4. The central result in Table 2 is in the first cell of the table, for each year, and the fiscal multiplier ranges from 0.5 to 1, while the semi-elasticity is in the interval between 0.46 and 1. The results show that the maximum effects on the budget balance are the ones reported as our benchmark hypothesis. Naturally, if one assumes a higher fiscal multiplier, the increased fiscal expansion effect on GDP will counteract by more the initial worsening of the fiscal balance. 4 Note that a positive budget surplus semi-elasticity implicitly assumes that spending is less influenced by GDP than revenues are. Moreover, a given budget surplus semi-elasticity is consistent with different values for the budget items elasticities. The range considered in Table 2 for 2013 is consistent with our elasticities estimated values and the weights on GDP for different revenue items. 5 For instance, and for 2013, one sees that considering a fiscal multiplier of one, instead of 0.5, would result in a change on the budget balance, with feedback, of only around -0.29. The same conclusion is true for the case of 2014 (around -0.34 in this case). Table 2 - Ranges for the change in the budget balance with feedback 2013 Budget balance multiplier Semielasticity 0,46 0,75 1,00 0,50 -0,415 -0,337 -0,270 0,75 -0,353 -0,236 -0,135 2014 Budget balance multiplier Semielasticity -0,337 -0,273 -0,219 1,00 -0,291 -0,135 0,000 0,50 -0,286 -0,191 -0,109 0,75 -0,236 -0,109 0,000 1,00 -0,337 -0,273 -0,219 In terms of the 2013 Budget we can also assess the aforementioned cut of two wages and the ensuing reduction in personal income revenue, stemming from maintaining hypothetically the 2012 situation. One can consider that personal income tax was increased in 2013 to account for the effect of one more salary that was to be paid again in 2013. This means, and in a world where the Constitutional Court would not rule such measure as unconstitutional, that one would have seen, as compared to what effectively happened in 2013: - a reduction in spending by the amount of two wages; - the reduction in personal income tax, equivalent to one wage This is in fact equivalent to a net reduction of one wage in the budget deficit. The results of such scenario for 2013 are in practice symmetrical to the one we report in Table 2 for the same year, as we can easily conclude from the abovementioned explanations. Therefore, in that additional simulation we would have in 2013 a baseline improvement of the budget balance of around 0.42 percent of GDP. 6 Box 1: Some remarks on the adjustment program theoretical underpinnings and on our neutral and technical approach The adjustment program is strongly influenced by the following theoretical underpinnings: (i) A successful fiscal consolidation is to be based on essentially spending reductions (as opposed to tax increases). Spending reduction procedures are better quality measures as they allow for efficiency gains ("more with less"); (ii) Accomplishment chances are increased when the program is front loaded. Spending cuts are to be taken immediately, and this will increase credibility, a necessary condition to get better financing conditions. (iii) Recovery is to be attained as external competitiveness is restored. The economy has necessarily to switch from non-tradable to tradable goods production, and exports must increase to close the external deficit and indebtedness. For this goal will concur labour wage reductions to ensure decreased unit labour costs. (iv) Future growth prospects will be enhanced by structural reforms, which will attract domestic and foreign private investment. These reforms concern a more flexible labour market, a better functioning judicial system, streamlining public administration complex procedures, and generally a decrease in so called context costs. It is clearly beyond the scope of this paper to critically assess the theoretical and empirical foundations of the Portuguese adjustment program. As one could expect, ours was a neutral and technical approach. In order to clarify this, we found it useful to remark the following: (i) We considered a spending multiplier equal to a tax multiplier. In our simulations, a one euro increase in taxes causes the very same GDP contraction as a one euro decrease in spending. As stated by OECD (2012): "Successful fiscal consolidations in the past have been largely driven by spending cuts due to political economy considerations and their positive impacts on efficiency and, when concentrated on transfers and other current spending, their perceived durability". This preference for spending cuts does not derive from empirical evidence on smaller spending multipliers as compared to tax multipliers. In fact, some recent research points towards the opposite, as referred by Boussard, de Castro and Salto (2012): "The review of the literature presented above allows drawing the following conclusions, despite the large variation in estimates and the difficulty in comparing them. Assessing the current size of fiscal multipliers is complex, in that the value taken depends on its composition, its permanent nature, and on the economic environment at large. The large majority of estimates of first-year spending multipliers in normal times are located in the range of 0.4 to 1.2. The values are lower – quite often below 0.7 - for tax multipliers." In what comes to a conservative approach, and taken into account the large variation found in the literature, we did not consider a smaller tax multiplier than a spending one. (ii) We remained neutral in what concerns the frontloading/back loading debate. In our simulations, multipliers do not depend on the timing a decision is taken or implemented. The interested reader may refer to the writings of Blanchard and Leigh (2013) where some arguments favouring back loading are mentioned. (iii) We have also considered that replacing some unconstitutional measures (essentially public sector pension and wage cuts) by other measures (including tax increases) would not imply that structural reforms with a possible impact on potential GDP were not to be pursued. Namely, we implicitly considered that pursuing efficiency in public administration does not depend on across the board wage cuts. References Blanchard, O. and D. Leigh (2013), "Fiscal consolidation: At what speed?", http://www.voxeu.org/article/fiscal-consolidation-what-speed, 3 May. Boussard, J., F. de Castro and M. Salto (2012), "Fiscal Multipliers and Public Debt Dynamics in Consolidations", European Economy Economic Papers 460, European Commission, July. OECD (2012), “What are the Best Policy Instruments for Fiscal Consolidation?”, OECD Economics Department Policy Notes, No. 12, April. 7 3.4. Effects on the path of the debt ratio In Table 3 we report the effect on the debt ratio of the aforementioned Constitutional Court decisions. The results reported in Table 3 are based on the following assumptions and procedures: from 2013 to 2017, the "actual surplus" and the "actual government debt" correspond to observed figures and forecasts taken from the EC (2014). the figures from 2018 onwards were projected by us assuming the maintenance of nominal GDP growth rates. budget deficits were assumed to stabilize at 0.5 percent of GDP from 2020 onwards. These figures take into account the fact that the 2013 measures (the 13th month wage cuts) were actually not taken. had those measures not been taken, the budget deficit in 2013 would have been smaller (less 0.415 percent of GDP). However, and by our assumption, budget surpluses (or deficits) in 2014 and in following years would not have been different. Comparing the government debt paths, one concludes that the difference is of about 0.41 percent of GDP and declines smoothly to about 0.16 percent of GDP in 2040. Table 3 – Simulation for the general government debt (% of GDP) 2013 2014 2015 2016 2017 2018 2019 2020 … 2040 Actual surplus (without measures) Surplus with measures Government debt with measures -5.48 -4.04 -2.53 -2.00 -1.70 -1.40 -1.00 -0.50 Actual government debt (without measures) 129.38 126.59 125.79 123.40 119.90 117.02 113.85 110.28 -5.89 -4.04 -2.53 -2.00 -1.70 -1.40 -1.00 -0.50 -0.50 -0.50 60.56 60.40 8 128.97 126.18 125.39 123.01 119.53 116.66 113.50 109.95 Figure 1 – Alternative paths for the general government debt (% of GDP) 130 with measures 128 with quick compensation 126 with gradual compensation 124 without compensation 122 120 118 116 114 112 110 2013 2014 2015 2016 2017 2018 2019 2020 The two government debt time paths presented in Table 3 are depicted in Figure 1 (black and green lines). The solid black line is our estimate of a world where the 2013 measures would not have been considered unconstitutional. The green line with the circles represents the state of the world where measures were withdrawn but quickly compensated. By "quickly compensated" we mean that the 2014 budget deficit was not affected by the Constitutional Court decisions about the 2013 budget. Implicitly, those withdrawn measures were then compensated in the following year. Two other hypotheses are also reported in Figure 1 (see Appendix 2 for a table with values): - in a "gradual compensation" scenario, it is assumed that budget deficits would have been higher not only in 2013, but also from 2014 to 2017 (line with squares). - in a more extreme "without compensation" scenario, the budget deficit would have remained higher for ever (dotted line), with the 0.415 worsening effect in the deficit from 2013 (in Table 2) staying uncompensated throughout the period of analysis. 9 The gradual compensation scenario implies that government debt is about 0.85 percent of GDP higher than the baseline in 2020. This difference amounts to approximately 2.95 percent when there is no compensation at all. 4. Conclusion In this report we have assessed the macroeconomic impact of the main measures proposed by the Portuguese Budget Laws of 2012, 2013 and 2014 that were not accepted by the Portuguese Constitutional Court. Our main conclusions, regarding the budget deficit, the path for the debt-to-GDP ratio, GDP and unemployment are as follows: 1) the worsening of the budget balance is around 0.54 percent of GDP and 0.44 percent of GDP respectively in 2013 and in 2014; 2) considering the feedback effect of such fiscal impulse, the impact on the budget balance is -0.42 percent and of -0.34 percent of GDP respectively for 2013 and for 2014; 3) maintaining hypothetically the 2012 situation, a cut of two wages, and the ensuing reduction in personal income revenue, would have in 2013 a baseline improvement of the budget balance of around +0.42 percent of GDP. 4) with the compensation measures proposed by the Government, the effect on the budget balance and on GDP is negligible in 2014; 5) in 2013 and in 2014, the impact of the fiscal expansion on GDP, following the withdrawn of the measures, could result in rather mitigated reductions in the unemployment rate of around 0.1 percent. 6) the impact on the government debt level is around 0.42 percent of GDP in 2013 and declining from then on, in a conservative estimate, and about 2.95 percent of GDP in 2020 in the worst case scenario. 10 References Afonso, A., Sousa, R. (2011a). “Assessing Long-Term Fiscal Developments: Evidence from Portugal”, Applied Economics Letters, 18 (1), 1-5. Afonso, A., Sousa, R. (2011b). “The Macroeconomic Effects of Fiscal Policy in Portugal: a Bayesian SVAR Analysis”, Portuguese Economic Journal, 10 (1), 61-82. Afonso, A., Sousa, R. (2012). “The Macroeconomic Effects of Fiscal Policy”, Applied Economics, 44 (34), 4439-4454. Afonso, A., Claeys, P. (2008). “The dynamic behaviour of budget components and output”. Economic Modelling, 25 (1), 93-117. Afonso, A., St. Aubyn, M. (2009). “Macroeconomic Rates of Return of Public and Private Investment: Crowding-in and Crowding-out Effects”, Manchester School, 77 (S1), 21-39. Ball, L., Leigh, D., Loungani, P. (2012). "Okun’s Law: Fit at 50?" Paper presented at the 13th Jacques Polak Annual Research Conference, IMF, Washington. ECB (2014). “Fiscal multipliers and the timing of consolidation”, ECB Monthly Bulletin, 75-89.. EC (2014). “The Economic Adjustment Programme for Portugal Tenth Review”, European Economy, Occasional Papers 171. Girouard, N., André, C. (2005). “Measuring cyclically-adjusted budget balances for OECD countries”, WP 434, OECD. Illing, G., Watzka, S. (2013). “Fiscal Multipliers and Their Relevance in a Currency Union – A Survey”, German Economic Review, DOI: 10.1111/geer.12027. Mourre, G., Isbasoiu, G.-M., Paternoster, D., Salto, M. (2013). “The cyclically-adjusted bbudget balance used in the EU fiscal framework: an update”, European Economy, Economic Papers 478, European Commission. Okun, A. (1962). "Potential GNP: its measurement and significance". American Statistical Association, Proceedings of the Business and Economic Statistics Section, pp.98103. Pereira, M., Wemans, L. (2013). “Output effects of fiscal policy in Portugal: a structural VAR approach”. Economic Bulletin, Banco de Portugal, Spring 2013, 7-30. Ramey, V. (2011). “Can Government Purchases Stimulate the Economy?”, Journal of Economic Literature 49, 673–685. Spilimbergo, A., Symansky, S., Schindler, M. (2009). “Fiscal Multipliers”, IMF Position Staff Note, SPN/09/11, IMF. 11 Appendix 1 We report in Table A1 the budgetary elasticities, for the period 1978-2013, resulting from three simple regressions. The dependent variables, from the revenue side, are the logarithm of direct taxes received, the logarithm of indirect taxes received and the logarithm of social contributions received by general government. Coefficients were calculated regression the dependent variables on an intercept and on the logarithm of the GDP using heteroskedasticity and autocorrelation robust (HAC) standard errors. We considered three different samples: the first one, unrestricted, from 1978 up to 2013; the second one from 1978 up to 1997; and the last one from 1998 up to 2013. The results are rather in line with existing previous analysis. Table A1 – Budgetary elasticities, Portugal Direct Taxes Indirect Taxes Social Security Contributions 1978-2013 1.6578 1.3103 1.6767 1978-1997 1.7670 1.2971 1.6764 1998-2013 1.1681 1.4769 2.1958 In addition, fiscal multipliers of six simple regressions are displayed in Table A2. The covariates are the logarithm of direct taxes, the logarithm of indirect taxes and the logarithm of social security contributions received by general government. The coefficients were calculated regressing the dependent variables, logarithm of GDP and unemployment rate, on an intercept and on the regressors using heteroskedasticity and autocorrelation robust (HAC) standard errors. We considered three samples: the first one, unrestricted, from 1978 up to 2013 (second and fifth columns); the second from 1978 up to 1997 (third and sixth columns); and the last one from 1998 up to 2013 (fourth and last columns). The fact that the analysis was made with simple regressions, without control for other factors, might explain the large values of the last column. Table A2 – Fiscal multipliers, Portugal Log(GDP) Unemployment Direct Taxes 19782013 0.5801 19781997 0.5242 19982013 0.2437 19782013 1.3546 19781997 -2.2208 19982013 24.6997 Indirect Taxes 0.7512 0.7425 0.4753 1.5703 -3.1503 11.4992 Social Security Contributions 0.5907 0.5845 0.3863 1.4512 -2.6140 22.7197 12 Appendix 2 In all cases the government debt path was computed from the dynamic debt equation, with all variables as ratio of GDP: Dt Dt 1 S t sfa t (1) where D is nominal debt, S is budget balance surplus, sfa is the stock-flow adjustment (the stock/flow adjustments and nominal GDP changes were taken from EC, 2014). Table A3 contains values that correspond to the "gradual compensation" and the "without compensation" scenarios described in the main text and depicted in Figure 1 (Table 3 in the main text contains the other scenarios figures). In the gradual compensation hypothesis, the budget surplus converges progressively to the quick compensation figure. The complete convergence is achieved in 2018 only. In the without compensation scenario, the budget deficit is always 0.415 percentage points of GDP above the quick compensation baseline. Table A3 - The gradual compensation and the without compensation scenarios (% of GDP) Year 2013 2014 2015 2016 2017 2018 2019 2020 GDP nominal growth (%) 0.1 Gradual compensation scenario Budget surplus Debt 129.38 -5.89 -5.89 129.38 1.7 -4.35 126.90 -4.45 127.00 -2.75 126.31 -2.95 126.61 -2.12 124.02 -2.42 124.61 -1.72 120.51 -2.12 121.48 -1.40 117.61 -1.82 118.96 -1.00 114.42 -1.42 116.13 -0.50 110.83 -0.92 112.90 2.5 3.4 3.7 3.7 3.7 3.7 Without compensation scenario Budget surplus Debt Note: 2013 - 2018 GDP nominal growth rates were taken from EC (2014). 13
Baixar