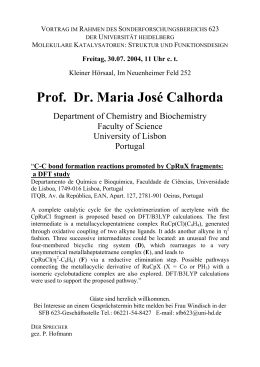
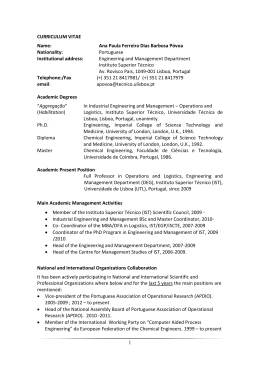
Social Changes and Better Health
Conditions of the Portuguese
Population 1974–2000
Teresa Rodrigues Veiga, Maria João Guardado Moreira,
and Ana Alexandre Fernandes
T
he main purpose of this chapter is to illustrate the most significant changes
in mortality rates and health status and their impact on Portuguese society.
For practical purposes, we have taken into consideration two major
problems, and we have approached them following different methodologies. Firstly
we detect changes in Portuguese mortality rates using some demographic indicators
and correlate this to the broader socio-economic changes that have occurred.
Secondly we focus on the role of the National Health Care System as well as
alternative institutional support at all levels.
The methodological approach followed varies according to the available statistical
data on health and death. Official statistical data on population movements became
of scientific interest at the beginning of the modern era, by the end of the 19th
century. The records on population movements became reliable by the second half
of the 19th century, although it was not until the late 1880s that the publication of
demographic statistics began. This data provides information on basic mortality
rates, fertility rates and migratory movements during the last 150 years. After 1864,
a reliable general census of the population is made. Nevertheless, major changes in
the global quality of data will not be introduced until the 1930s.
General Demographic Trends
th
th
During the 19 and 20 centuries, the processes of urban growth, industrialization
and migration were the main explanatory factors of national demographic
movements. After 1974, migratory movements within the country became more
relevant, and population density increased in the coast. In recent years, the
importance of such movements has been partly replaced by immigration.
th
Figure 1. Number of births and deaths during the 20 century.
300000
Births
Deaths
250000
200000
150000
100000
50000
0
1900
1910
1920
1930
1940
1950
1960
1970
1980
1990
2000
Source: Estatísticas Demográficas, INE, Lisboa, 1910–2001.
Today, Portuguese society presents an almost inexistent level of demographic
growth, a high rate of life expectancy, low levels of fertility rates and an increasingly
elderly population. All these demographic trends converge and create a model with
slight regional variations.
In the diachronic axis, Portugal has presented moderate growth rates for the last
two centuries, with variations and asymmetries between the mainland and the
islands – Azores and Madeira –, the northern and southern parts of the country, the
coast and the countryside. However, it is possible to distinguish clear-cut phases
and sub-periods, which differ with regards to total annual average growth rates and
variation rates (table 1 in appendix).
In the contemporary era, industrialization has had an obvious effect on migration
and regional differences within the country. At the same time, political stability and
the improvement of life conditions helped to change mortality rates, compensating
for the negative tendency of the migratory flow and enhancing the general growth
of the population. In 1918, the “Spanish flu” brought such tendency to a halt, but
after that period population experienced a new growth (figure 1). An analysis of the
total annual growth rates and of net migratory rates from 1900 up to 2001 (table 2
in appendix) shows that in the last 100 years the population increase in Portugal has
always depended on the intensity of the migratory flow, and more in particular
256
th
from the third quarter of the 19 century onwards.1 Migration within the country
increased after the 1870s, reinforcing a new pattern vis-à-vis fertility and mortality
ratios.2 The crack of 1929 and the Second World War slowed emigration rates.
During that period, war refugees influenced the increase of population rates. In the
1940s emigration started out again and, as a consequence, population growth
slowed down and actually decreased between 1960 and 1974. However, after the
th
25 of April, Portuguese and African citizens from previous colonies provoked a
population growth of 7%. In the last thirty years, it is necessary to consider stability
as the keyword to describe demographic reality.3
Between 1855 and 1930, more than 2 million people left the country and 2 more
millions followed them between 1930 and 1970, 40% of them during the 1960s.
After 1975, emigration rates dropped. Between 1974 and 1976, almost half million
Portuguese citizens returned to Portugal from former African colonies.
Nevertheless, in the 1980s, emigration increased again, with an annual flow of 26
thousand persons per year, but with new destinations and most of them on a
4
temporary basis. Immigration patterns change too. European immigration has
5
increased in the last five years. One third of the immigrants come from the EU and
other European countries (31.9%); some others come from Africa (45.6%), mainly
from Cabo Verde (14.6%). Brazilians represent a 14.6% of the total.
According to the last two censuses of 1991 and 2001, Portugal population shows
an average annual increase of 0.45%, significantly higher than that of the previous
decade, almost entirely due to immigration. Yet, this average value does not reflect
the whole story, as some regions, since the mid-80s, show significant reductions in
th
population figures. Population has grown old. At the beginning of the 20 century,
the ratio of old and young people was of one to six. By the middle of the century
the ratio was one to four, but from the 1960s onwards, swift changes have taken
place. The last census counted 1.7 million people over 65, which represents an
increase of 44% vis-à-vis 1981. In the same period, young population decreased by
37%.6 Today, only 16.0% of the population is below 15, 16.4% is over 65. Portugal
1 Maria Ioannis Baganha, “A emigração atlântica e as migrações internas em Portugal”,
in Los 98 Ibericos y el mar, IV, (Lisboa, 1998), 215-228.
2 On this subject see Manuel Nazareth, Portugal. Os próximos 20 anos, III – Unidade e
diversidade da demografia portuguesa no final do século XX, (Lisboa, 1988).
3 Teresa Rodrigues, “A população portuguesa no século XX – Permanências e
mudanças”, Ler História, 53, (Lisboa, 2003).
4 In the last five years of the 20th century, temporary emigration has always represented
more than half of the total of legal exits (maximum value of 86% in 1999). In 2000 and 2001,
21,333 and 20,589 declarations of temporary exit represented a 78% and a 72%, respectively.
5 In 2001, 27.5% of all the European immigrants came from other EU countries (the
United Kingdom, Spain and Germany being the most representative ones).
6 Data taken from the census of 2001 show that Portugal has 1,656,602 young
inhabitants (from 0 to 14 years) and 1,693,493 elderly inhabitants (65+ years old). 36,891 young
257
is one of the five countries of the European Union with fewer younger than elderly
people.
In the coast, population is younger, but in the south and in the countryside
population is older. As migrants are young, their settlement implies the
rejuvenation of the regions they move to and the ageing of those where they came
from. This trend has benefited the Portuguese coast, whose population increased
th
7
during the second half of the 20 century, at the expense of the countryside.
Regions with a higher percentage of elderly inhabitants are in the south and in the
interior of the country. There are, however, local variations that must be registered,
since villages and small towns are more affected than cities, and isolated places with
bad accessibility are also noticeably affected. As migrants are mostly individuals in
their fertile age, their movement from one place to the other has also negative and
positive consequences on fertility rates in the places they leave and they arrive to,
th
respectively. Still, ever since the mid-20 century, and mostly during the last thirty
years, the decline of the average number of children per woman has led to the
narrowing of the base of the population pyramid of Portuguese population age rate.
Migration towards new economic, more attractive areas has led to the
8
abandonment of the countryside, to the creation and, sometimes, to the chaotic
9
growth of suburbs around big cities and to the formation of metropolitan areas. A
study about the recent evolution of the Portuguese urban system shows that in
almost all regions the nucleus with urban functions has augmented in size, or at
least, has experienced lower demographic losses vis-à-vis towns of smaller
10
dimensions.
people less. All regions have contributed to this inferiority, except the regions of the north and the
islands. In the Alentejo, the proportion is of 174 old persons to 100 young ones; in the central
region of the country of 131; in the Algarve of 128; and in Lisbon and Vale do Tejo of 110. In the
north this ratio is of 80 elderly people to 100 young people. The Autonomous Regions of Madeira
and the Azores have the youngest population in the country, with only 72 and 61 aged people to
100 young people, respectively.
7 Cf Maria João Guardado Moreira, A Dinâmica demográfica na região do INTERREG
Ibérico no Final do Século XX, FCSH-UNL (Lisboa, 2001); Maria José Carrilho, “Evolução
Demográfica no período intercensitário 1991-2001”, Seminário Censos 2001 – Resultados
Definitivos, INE, (Lisboa, 2002).
8 Several studies indicate that 80% of migrants moved from rural areas to urban centres.
Only 29% moved from one urban centre to the other (Teresa Rodrigues and Maria Luís Rocha
Pinto, “Migrações internas”, Dicionário de História do Estado Novo, II, Círculo de Leitores, (
Lisboa, 1996), 561-565).
9 Teresa Rodrigues and Luís Baptista, “Population and Urban Density: Lisbon in the
19th and 20th centuries”, Urban dominance and labour market differentiation of a European capital
city. Lisbon, 1890-1990, Kluwer Academic Publishers, (London, 1996), 75-122.
10 The methodological presupposition based on Portuguese reality is that all settlements
with two thousand or more residents have infrastructures that allow us to consider them urban
258
Coastal cities and villages have continued to attract people from the interior, but
the great beneficiaries have been the surrounding areas of Lisbon and Porto. In the
case of Porto, the regions of Braga and Aveiro are to be mentioned, while in the
11
case of Lisbon, it is Setubal that must be referred to. These are, together with Faro,
the preferred settlement by immigrants, and they present the highest demographic
dynamics. Today more than three quarters of the country show negative natural
rates. In fact, during the 1990s, 82% of Portuguese population total growth is due
to positive migratory rates.
Fertility Changes
The first phase of demographic transition extended up to 1925 and it was
characterised by a decrease in mortality, while fertility rates continued to be high.
th
This would lead to high rates of population growth between the late 19 century
th
and the first quarter of the 20 century, if it were not for the unfavourable
migratory balance. However, after 1930 the situation was much the reverse with a
slight decrease in birth rates. Between 1940 and 1960, the average Portuguese
fertility rate remained stable. It was only in the 1970s that the fecundity of
Portuguese women decreased by 25% from 3 to 2.2 children per woman. In 1982,
the country ceased to guarantee generational continuity. Still, in the last five years
the fertility rate has stabilised around 1.5, with a slight rising tendency.
The traditional family model based on asymmetric conjugal roles followed its
course until the late 1960s, as guarantee of social harmony zealously promoted by
the political and religious institutions of Salazar’s regime (the so-called “Estado
Novo”). Portugal began to enjoy new social and political conditions from the
revolution of 1974 onwards, and this seems to have had a strong influence on
parental and familiar behaviour. The cohabitation rate (mixed couples) increased, as
well as divorce frequency and the amount of one-parent families, which are both
signs of the deep-rooted modifications that characterize Portugal nowadays, with
12
slight regional differences.
Portugal has traditionally low proportions of newborns outside marriage, and its
decline is steady between 1930 and 1970. At that time, it represented a 7.2% of the
total birth rate, a 9.5% in 1981 and a 15.6% in 1991, and it has reached 23.8%
centres. (Teresa Rodrigues and Maria Luís Rocha Pinto, “1981-1991: as tendências recentes da
evolução populacional portuguesa”, História, 26, (Lisboa, 1996), 44-53).
11 Luís Baptista, “Dominação demográfica no contexto do século XX português: Lisboa, a
capital”, Sociologia – problemas e práticas, 15, (Lisboa, 1994), 53-77.
12 In the past, divorces and one-parent families were more usual in the south and in
urban areas. (Ana Fernandes, Velhice e Sociedade, Celta Editora, (Lisboa, 1997)).
259
presently. The average age of women who give birth for the first time has increased
13
since the beginning of the 1980s. At the same time, the proportion of people living
14
alone has risen to 45%, particularly in the case of people over 65. Families with
children under 15 represented 46.9% in 1981, 39.9% in 1991 and only 29.9% in
15
2001. All these changes have led to a decrease of the average family size.
The Mortality Model and the Epidemic Transition
By the end of the 19th century, Portugal seemed to be facing a slow demographic
transition. In spite of all the sudden transformations occurred during that century
in the economic and social fields, this variable remained stable with regards to
annual volumes. Within the country, the battle against death took place in two
fronts chronologically separated in time. At first, it was based on progress carried
out at a preventive level. Health authorities managed to halt dissemination of
various epidemics at bay by several means, of which isolation barriers are a case in
16
th
17
point. “At the beginning of the 19 century, epidemics became a real state affair.”
In fact, it was the central government that played a central role during the several
crises that took place throughout the country. In this regard, Portugal took
18
advantage over neighbouring Spain. Hygienists’ campaigns came in the second
place, as well as the vaccination campaigns that followed Jenner and Pasteur’s
discoveries. These were to produce specific positive results for the improvement of
th
general health conditions, though this was not yet clear at the turn to the 20
century. Several factors interfered and caused localised alterations in these
indicators: differences between life in rural and in urban areas, greater female
participation in the labour market, percentages of young or elderly people in some
19
parts of the country, political and/or economic instability.
13 From 23.6 years in 1981 to 26.8 years in 2001(EUROSTAT (2000); Indicadores
Estatísticos Gerais (www.ine.pt)).
14 From 10.8% in 1960 to 17.3% in 2001. According to the 1991 census, they represent
55.5%. Ten years later, the number rose to 50,8%.
15 They were 69,7% in 1981, 60,8% in 1991 and 54,3% in 2001.
16 Teresa Rodrigues and Piedade Braga Santos, “Poder central e poder local, um caso de
conflito”, Ler História, 34, (Lisboa, 1998).
17 Jorge Crespo, A Economia do Corpo em Portugal nos finais do Antigo Regime, I,
UTL, (Lisboa, 1984), 192.
18 See Teresa Rodrigues and Piedade Braga Santos“Poder central e poder local, um caso
de conflito”, Ler História, 34, (Lisboa, 1998), 71-77.
19 Teresa Rodrigues, Crises de Mortalidade em Lisboa. Séculos XVI e XVII, Livros
Horizonte, (Lisboa, 1991), 76ff.
260
The tragedy of death became dramatically noticeable in places with higher
population densities, leading to the common idea that mortality rates were higher
in urban centres, and mainly in big cities, which was not always true. On the one
hand, in some of those cases it was foreigners who died in cities. The existence of
hospital institutions, charities, asylums and hospices attracted the poorer and sicker,
some of which used to live outside the city. On the other hand, as cities were the
abode of important and public figures, there was a link between social notability
20
and the importance of death when it happened during a period of high mortality.
Individual socio-economic conditions and place of residence determine the
survival probabilities too. In urban centres, people would die more and very young,
but there were differences between social groups. Lisbon and Porto’s quarters
enjoyed very different sanitary conditions. The noble areas would be occupied by
the richest, whose diet and health would be better. In such quarters, the conditions
to isolate and treat people affected by contagious diseases would be more adequate.
As cities grew, the relation between immigration, poverty and mortality became
closer, while the main epidemic diseases started to affect mainly the poor quarters,
where the poor environmental conditions predominated. In rural areas, social
differences were less apparent, and inequalities more likely to be due to differences
21
in staple diets or exposure to environmental inclemency.
Death would follow cyclic patterns. Each year, certain repeated circumstances
would kill people belonging to certain age and social groups, usually in the same
months as the year before. In rural areas, there were always two critical periods. The
first one occurred during the winter, when cold and food shortage contributed to
the rise of bronco-pulmonary infections. The second one went from July to
September when victims were the younger. However, disease and the high prices of
food spread the sudden rise of mortality rates at all ages. In urban centres, the
relation between men and the environment was more complex. A great number of
aspects contributed to change death’s trends. The smaller proportion of children, as
compared with the total number of inhabitants, was enough to diminish seasonal
variations in death rates.
In 1800, the crude mortality rate (henceforth CMR) was higher in the south and
in the interior regions of the country, although the higher fertility rates in these
22
areas would make up for this disadvantage. But internal differences diminished as
20 Those responsible for the report on Lisbon’s yellow fever epidemic published in 1857
takes up this question. The report confirms that the most amazing fact was the death of some
relevant persons of political, social and artistic scenes. (Teresa Rodrigues, “O quotidiano da morte
no Portugal Moderno (séculos XVI-XVIII)”, conference held in Lisbon in 1996, at the
Universidade Lusófona).
21 Cf. Jorge Crespo, A História do Corpo, Difel, (Lisboa, 1990).
22 Fernando de Sousa, A população portuguesa nos inícios do século XIX. Dissertação de
Doutoramento. Faculdade de Letras da UP, (Porto, 1979), 356.
261
th
the century progressed. At the beginning of the 20 century, such differences were
of no consequence. What we cannot forget is that, until the end of the Second
World War, infant mortality rates underwent cyclic fluctuations, due to the evil
effects of some well-known contagious diseases that affected Portugal for much
longer than any other European country.
It is impossible to ascertain the exact moment or place in which the decline of
crude mortality rates took place for the first time, although it must have happened
th
around the 1890s (table 3 in appendix). At the beginning of the 20 century, rates
23
were moderate and stable, in spite of some conjuncture oscillations. The decline
was progressive, anticipating the fall in fertility rates, a fact that partly explains the
positive population growth rates during the following decades. At first, the negative
trend evolved slowly, and then it faster, leading to a substantial growth in life
expectancy at birth. This last indicator increased from 38 years to 58 years between
1920 and 1950. The most relevant periods were already seen during the 1920s, and
later, during the 1940s, in spite of the Second World War. From 1950 onwards, the
crude mortality rate continued to fall and the advantages were significant, although
the general process became progressively slower, as it approached the highest levels
possible within an accelerated ageing structure. During the second half of the
century, it raised from 58 to 77 years of age (table 4 in appendix).
The general advances towards survival in the case of Portuguese population are
directly connected with the general rise of children’s survival probabilities during
the last hundred years. By 1900, approximately half of the children died before
reaching the age of 15 and infant mortality rates hit 200‰, remaining very high up
to the 1940s. Only by the middle of the century did mortality rates fall below
100‰, with a delay of 40 or 50 years in relation to more developed countries. The
decline was significant after 1960, decreasing a 94% between then and 2001. 2001
shows the lowest rates of infant mortality, with only 5 cases of death as against 1000
births. The relative contribution of infant mortality to crude mortality rates
changed during the last century. Around 1900, it represented 25.1% of total death
24
rates; in 1995, no it just represented 0.8%. Most of this decline can be explained
by massive decrease in infectious diseases (table 5 in appendix).
As to children, the most lethal diseases were epidemics: smallpox, scarlet fever,
whooping cough and measles, in particular. In some other cases, death was due to
croups, diptheria, scrofula and cerebral hydrous. After the hazardous first years of
life, the most usual death causes were typhoid fever, chest pains and inflammations
of various organs, as well as pregnancy in the case of young women. The ageing
process increased the danger of dying due to hydropxies, apoplexies, cancers and
23 Among which, reference should be made to the great epidemic crisis of 1918, which is
the last proof of the old demographic regime. See Figure 1.
24 Idem, 84.
262
various kinds of unspecified inflammations. At the beginning and at the end of life,
most death circumstances were linked to complications in the respiratory and
nervous systems. By the end of the 1800s, precarious life conditions, economic
working structures, public and private lack of hygiene account for the appearance of
25
tuberculosis as a widespread, main death cause in high-density places.
The decline in infant mortality can be attributed to the improvements in general
health conditions, which is enhanced by systematic public health policies, which
proved to be efficient; but also to changes in the social and economic conditions of
th
Portuguese population that became clear in the last decades of the 20 century. The
improvement of life standards for individuals over 70 is a later process, due both to
better preservation of good health through economic, social and cultural factors,
but also to medical progress in fighting certain pathologies, namely infections.
Advances in life expectancy were moderate during the first half of last century, and
very sudden in the last thirty years. While in 1900, Portuguese women lived less
st
than 40 years; by the beginning of the 21 century they may live an average of 81
years, while men may live 74 years (table 4 in appendix). As these figures mounted
up, the difference between sexes increased. In 1900, Portuguese women lived about
three years more than men. In 1950, the advantage was five years and today it
reaches seven years, although women from the south and urban women enjoy a
smaller advantage. The augment in female average life expectancy is due to male
high mortality in all the different age groups.
In the last decades Portugal has faced a process at the level of sanitarian and
epidemic transition. This has contributed to reduce the importance of infectious
pathologies, such as those affecting the respiratory and digestive systems. However,
it has also led to the increase of degenerative pathologies, such as tumours and other
problems linked to the circulatory system. The highest figures pertain to vascular
failure. In 1960, circulatory system diseases and malignant tumours were
responsible for 35% of all identified death causes, though in 2001, they came to
represent 59.8%.
The relative importance of external factors (such as accidents, poisoning and
injury) has increased (table 6 in appendix).26 Road accidents deserve to be
25 In Porto, by 1900 and 1901, 17% of the deaths were attributed to tuberculosis, and this
figure did not diminish until the end of the Second World War (João José Maduro Maia,
“Padrões de mortalidade e transição sanitária no Porto”, População e Sociedade, 1, (Porto, 1995),
237).
26 Maria da Graça Morais, A transição da mortalidade e estruturas de causas de morte em
Portugal continental durante o século XX, Dissertação de Doutoramento em Sociologia,
Universidade de Évora , I, (Évora, 1999), 263-300.
263
mentioned within this category, since they are responsible for one sixth of the
deaths among men every year, which affect, specifically, men between 20 and 44.27
The slow conquest of survival is a result of the improved efficiency of primary
medical care and of a wider and more efficient hospital network. It should be noted
that the National Health Service (Portuguese Sistema Nacional de Saúde) was
implemented between 1970 and 1981, period during which the most significant
increase in life expectancy – up to 65 – took place (table 7 in appendix). The central
tenets of change at the level of general life standards and health conditions that
impact on the epidemic profile of the country and on life expectancy at all ages are
connected to aspects of Portugal’s recent history. These include the adoption of the
democratic system that followed the revolution of 1974, which is linked to
decolonisation of African territories and to the European integration (in 1986).28
Therefore, we can conclude that, in the last hundred years, Portuguese
population’s crude mortality rate has unequivocally receded, in spite of regional
differences and evolution pace. Still, infant mortality, which is the indicator that is
traditionally a more accurate reflection of socio-economic conditions, remains high
by European standards. Only by the 1960s was there a significant improvement of
these rates. By 1995 they reached their lowest level, very close to northern and
western European average. In recent years, statistics have registered a decrease in
yearly casualties due to respiratory, infectious and parasitic diseases, accidents,
cirrhosis and liver pathologies, although figures continue to be high for European
standards.
Another delicate issue is that of the high percentage of deaths that continue to be
classified “signs, symptoms and badly defined morbid states”. These were the main
death cause for the age groups ranging 1 to 4 and 45 to 54, and still occupying the
third place in the table of mortality causes, in 2000. The analysis of the epidemic
transition process in Portugal has to take into account the importance that
infectious and parasitic diseases still have in the country and the inability to identify
some of the death causes. Should these became known, would Portuguese mortality
patterns be understood differently?
27 Paula Santana, Helena Nogueira, “A esperança de vida em Portugal”, Cadernos de
Geografia, 20, (Coimbra, 2001), 11.
28 A study about social and economical variations of mortality, between 1980 and 1990,
justifies the decrease of mortality among manual and factory workers during that decade by
improving their life standards after the revolution of April 1974. They had better salaries, better
working conditions and occupational health care. (Mª do Rosário Giraldes, Ana Cristina Ribeiro,
“Desiguladades socio-económicas na mortalidade em Portugal, no período 1980/82-1990/92”,
Documento de Trabalho 3/95, Associação Portuguesa de Economia da Saúde, (Lisboa, 1995).
264
Gender Differences in Life Expectancy
Figure 2. Life expectancy at birth for men and women in Portugal 1890–2001.
90
Life exp (years)
80
70
60
50
Males
40
Females
30
1890 1900 1910 1920 1930 1940 1950 1960 1970 1981 1991 2001
Source: Estatísticas Demográficas, INE, Lisboa, 1890–2001; IVº–XIVº Recenseamentos Gerais da
População Portuguesa, INE, Lisboa, 1890–2001.
The Portuguese mortality model fits in the South–European mortality model,
despite showing some particularities connected to the country’s recent political and
social history. One of these relates to the variation of life expectancy between
Portuguese men and women, despite the considerable gains of the last three
decades. Within the European Union, Portugal has the lowest life expectancy at
birth. It is also the EU country whose life span has extended the most in the last 45
years. Between 1950/55 and 1990/95, in Portugal, the increase was of 13,9 years for
men and 16,2 for women (figure 2).Between 1970 and 1995, there was an increase
rise in the difference of life expectancy between men and women.29 Thus, if men
who were born in 1970 could expect to live 64.2 years and women 70.8 years, in
1995, those values rose up to 71.6 and 78.6, respectively (table 4 in appendix).
These differences between sexes are not exclusive to Portugal and can be explained
by the higher mortality rates for men at all ages. Portuguese men die prematurely
and lose more years of life due to vehicle accidents,30 liver cirrhosis, brain damage,
cardio-vascular disease and infectious and parasitic diseases (table 8 in appendix) .
HIV/AIDS was the second death cause in the case of men between 25 and 34 and
29 Ana Fernandes, Velhice e Sociedade, Celta Editora, (Lisboa, 1997), 49.
30 Between 1981 and 2000, approximately 78% of these death causes affectted men
(Maria José Carrilho, “Situação demográfica recente em Portugal”, Revista de Estudos
Demográficos, INE, (Lisboa, 2002), 164.)
265
the third for the 35 to 44 year-olds during the 1990s,31 rating among the highest
figures in the EU.32 If we consider the total amount of ‘avoidable’ deaths (between
1989 and 1993), i.e. those that happen before 64, for a sample of one hundred and
thousand inhabitants, 77.4 women died, as against 170.2 men.33
Improvements in Health Services
An important explanatory factor for the remarkable improvements in life
expectancy has been the improved access to good quality health services. The last 30
years have witnessed a sustained effort to improve medical care and the health of
the Portuguese. Specific measures included a rise in health care funding, the
expansion of health care services – at the level of institutions and at the level of
acquisition of new information and medical technologies, wider access to
medication and continual efforts to optimise the organization and management of
the National Health Service.
th
During the first half on the 20 century, health care was restricted, fee-paying,
and hospital institutions were few and most of them had many deficiencies. After
the Second World War, in 1946, a federation of Pensioner’s Funds (Portuguese
Federação das Caixas de Previdência) was created, offering a complete system of
medical and health care to its associate members. In time, other measures followed,
which led to the creation of several subsystems, increasing the different access
modalities to health care.
By the beginning of the 70s, during the so-called marcelista spring,34 under
Marcelo Caetanos’ rule and under the motto “health as everyone’s right”, a network
of Medical Centres was proposed. Primary health care in medical centres began in
1971 striving to respond to public health needs: vaccination, antenatal care and
childcare, as well as campaigns connected with sanitation and environment.35
These services were meant to prevent and give professional support to some groups
at risk. This was undoubtedly a big step forward in Portuguese health care
assistance, with direct consequences on general demographic mortality indicators.
31 De que se morre mais em Portugal. As principais causas de morte em Portugal de 19901990, Observatório Nacional de Saúde, (Lisboa, 2003).
32 Paula Santana, Helena Nogueira , “A esperança de vida em Portugal”, Cadernos de
Geografia, 20, (Coimbra, 2001), 10.
33 Paula Santana, “A mortalidade evitável em Portugal Continental, 1989 a 1993”, Revista
de Estudos Demográficos, INE, (Lisboa, 2002), 112.
34 “Primavera marcelista” is the political name given to Marcelo Caetano’s first years in
the government.
35 A. G Branco e Vítor Ramos Branco, “Cuidados de saúde primários em Portugal”,
Revista Portuguesa de Saúde Pública, (Lisboa, 2001)
266
Unfortunately, the implementation of the network system was slow, never
achieving more than half of the intended goals. In the field of hospital care and
global management, the Misericórdias, private charity institutions, continued to
play an important role since they owned all local and regional hospitals, a central
hospital, and a few specialized places for the treatment of specific diseases.36
Thus, the Portuguese health care system was fragmented. It consisted of state
hospitals, Misericórdia hospitals, medical centres, social and medical care centres for
subscribers (Portuguese Serviços médico-socias da Previdência), municipal doctors,
maternal and infant care support services against tuberculosis, among others. Till
the mid-1970s, actions were directed against specific diseases (such as tuberculosis
and those that could be prevented through vaccination) among population groups
at risk (such as children and mothers).
The Revolution of 1974 propitiated the necessary political conditions for the
creation of a thorough Health National System (NHS), 37 to which all citizens had a
right, which was state funded and covered the whole country, and which was
enacted as law and included in Portugal’s Constitution of 1976. The main
implications of this new right to health care was clearly emphasized by the transfer
of all the Misericordia hospitals to the public domain, as well as by the integration
of all the already existing health sub-systems into the NHS.
The National Health Service Bill (1979) guaranteed the access of all citizens,
regardless of their social or economic situation, to medical and health care. A later
revision of the constitution in 1989 changed ‘free’ medical care to ‘tendentially free’.
The new bill signalled that funding for health care was to be obtained from the
government’s general budget instead of from social funds.38
From 1983 on, a new branch of medical studies was created, that of General
Practitioner, and, at the same time, new medical centres were opened as a result of
the fusion of several social care institutions with a view to using available resources
in a more efficient way. By the mid-1980s, the NHS inability to suitably respond to
the increasing demands, and the financial problems that the system was facing, gave
rise to the conditions for the development of a prosperous private health care
market that would expand very quickly during the following years. However,
universal access to health care, supposedly free of charge, was still guaranteed to all
36 Paula Cristina Almeida Remoalda, A morbilidade e a mortalidade infntil em
territórios. Amostra do distrito de Braga – desigualdades territoriais e sociais, Tese de
Doutoramento na Universidade do Minho, (Braga, 1998),98
37 The phases of implementation and expansion of the Health System in Portugal were
the following: before 1970, from the beginning of the 70s to 1985 – implementation and
expansion of the health care system -, from 1985 to 1995 – rationalization and assignment of new
roles to the private sector - and from 1995 to 2002 – a new public management for the Health
system.
38 Observatório Português dos Sistemas de Saúde (OPSS), www.observaport.org
267
Portuguese citizens. The hospital network system expanded through the whole of
the national territory and several new hospital institutions were built in order to
guarantee reasonable access to all people.
However, the well-meant reforms were frequently left incomplete due to
management problems, resistance to change or policy discontinuity. Throughout
this period, substantial changes took place, even though the same political party and
the same Prime Minister continued in charge. Despite the huge progress, Portugal
still illustrates insufficient and unequal access to health care.39
Conclusion
The national public health system aims to accomplish two main goals or challenges,
which will end with all internal differences and increase life expectancy. As to the
first goal, public health policies have to keep geographic diversity in mind, taking
into account factors such as place of residence and distance from the health care
institutions or specialized personnel. Social and/or economical differentiation is
another aspect to consider, as it involves better and quicker treatment as well the
economic capability to search for better assistance abroad. The goal must be to
guarantee equal access to health care, the increasing efficiency of the sanitary system
as well as uniform information levels, based on more active preventive attitudes,
premature deceases, healthier life habits (towards consumption of alcohol, smoking,
and physical activity) and healthier staple diets (mainly at the informative level,
telling people what is best to keep in good health and what should be avoided,
changing their mentality).
The second goal is to increase the life expectancy of the whole of Portuguese
population. Three aspects should be taken into account to achieve it. The first is
related to biological boundaries, i.e. the maximum age up to which we can expect
to live with quality; the second is linked to the reduction of endogenous causes of
persisting diseases and death. The third seeks to guarantee life quality among the
elderly. All this requires adequate equipment strategies: health centres, schools/
professional schools, and pensioners’ homes/home assistance. It also requires the
existence of groups with specialized qualification in this area, such as
physiotherapists, professional instructors, educators for children with special needs
and geriatric specialists. Flexibility between the labour market and the social
security system is still the hottest point of discussion between government, unions
and employers (superannuation, proposing new age limits to stop active life, and a
39 Miguel Pereira, M., J, Bugalho, “Economia da Saúde: novos modelos”, Análise Social,
166, XXXVIII, (Lisboa, 2003).
268
second professional life, which implies the reinforcement of new strategies
(occupations related to community support activities: taking care of children or
gardens, transmitting the cultural heritage).
Teresa Veiga is Professor at the Department of Political Studies, Universidade Nova
de Lisboa, 1069–051, Lisboa, Portugal. Ana Fernandes is Professor at the
Department of Sociology at Universidade Nova de Lisboa, 1069–051, Lisboa,
Portugal. Maria João Moreira is Senior Lecturer at the Department of Social
Sciences, Instituto Politécnico de Castelo Branco, 6000–084 Castelo Branco,
Portugal.
269
References
Baganha, Maria Ioannis, “A emigração atlântica e as migrações internas em
Portugal”, Los 98 Ibericos y el Mar, IV, (Lisboa, 1998), 215–228.
Baganha, Maria Ioannis,“Emigração”, Dicionário de História do Estado Novo, I,
Círculo de Leitores, (Lisboa, 1996), 294–297.
Branco, António Gomes, Ramos, Vítor, “Cuidados de saúde primários em
Portugal”, Revista Portuguesa de Saúde Pública, (Lisboa, 2001).
Crespo, Jorge, A Economia do Corpo em Portugal nos finais do Antigo Regime,
UTL, (Lisboa, 1984).
Crespo, Jorge, A História do Corpo, Difel, (Lisboa, 1990).
De que se morre mais em Portugal. As principais causas de morte em Portugal de
1990–1990, Observatório Nacional de Saúde, (Lisboa, 2003).
Carrilho, Maria José, “Evolução Demográfica no período intercensitário 1991–
2001”, Seminário Censos 2001 – Resultados Definitivos, INE, (Lisboa, 2002).
Carrilho, Maria José, “Situação demográfica recente em Portugal”, Revista de
Estudos Demográficos, INE, (Lisboa, 2002), 147–184.
Desesquelles, Aline, “Le vieillissement démographique dans les pays dévéloppés,
Actes des 1éres Rencontres Sauvy, INED (www.ined.fr).
Fernandes, Ana Alexandre, Velhice e Sociedade, Celta Editora, (Lisboa, 1997).
Fernandes, Ana Alexandre,"Envelhecimento demográfico e transformações da
modernidade”, Cidade Solidária, Revista da Santa Casa da Misericórdia, 3,
(Lisboa, 1999).
Fernandes, Ana Alexandre, “População Mundial, Globalização e Modernidade:
Digressão e confronto de sistemas demográficos”, Fórum Sociológico, 1/2,
(Lisboa, 1999).
Fernandes, Ana Alexandre, “Velhice, Solidariedades Familiares e Política Social.
Breve itinerário de pesquisa em torno das consequências do aumento da
esperança de vida”, Sociologia, Problemas e Práticas, 36, (Lisboa, 2001).
Giraldes, Maria do Rosário, Ana Cristina Ribeiro, “Desiguladades socio-económicas
na mortalidade em Portugal, no período 1980/82–1990/92”, Documento de
Trabalho 3/95, Associação Portuguesa de Economia da Saúde, (Lisboa, 1995).
Gomes, Maria Cristina Sousa, Prospectiva do Envelhecimento Demográfico na
Região de Viseu. O caso particular dos equipamentos sociais para idosos,
Dissertação de Doutoramento em Sociologia, FCSH-UNL, (Lisboa, 2000).
Maia João José Maduro,”Padrôes de mortalidade e transição sanitaria no Porto
(1880–1929), População e Sociedade, 1, (Porto, 1995), 233–244.
Moreira, Maria João Guardado, A Dinâmica demográfica na região do INTERREG
270
Ibérico no Final do Século XX, Dissertação de Doutoramento em Sociologia,
FCSH-UNL, (Lisboa, 2001).
Moreira, Maria João Guardado, “A Beira Interior no contexto da fronteira lusoespanhola”, População e Sociedade, 4, (Porto, 1998), 107–122.
Morais, Maria da Graça, A transição da mortalidade e estruturas de causas de morte
em Portugal continental durante o século XX, Dissertação de Doutoramentoem
Demografia, Universidade de Évora, (Évora, 1999).
Nazareth, J.Manuel, Portugal. Os próximos 20 anos, III – Unidade e diversidade da
demografia portuguesa no final do século XX, (Lisboa, 1988).
Nazareth, J.Manuel,“A demografia portuguesa do século XX: principais linhas de
evolução e transformação”, Análise Social, XXI (87–88–89), (Lisboa, 1985),
963–980.
Nazareth, J.Manuel,“A situação demográfica portuguesa no contexto da União
Europeia no início dos anos noventa”, População e Sociedade, 1, (Porto, 1995),
9–26.
Nazareth, J.Manuel,“Conjuntura demográfica da população portuguesa no período
de 1970–80: aspectos globais”, Análise Social, XX (81–82), (Lisboa, 1984),
237–262.
Nazareth, J.Manuel,“Prospectiva do Envelhecimento Demográfico na União
Europeia”, População e Sociedade, 2, (Porto, 1996), 77–96.
Observatório Português dos Sistemas de Saúde (OPSS), www.observaport.org
Observatório Nacional de Saúde (ONSA), INE, Esperança de vida sem incapacidade
física de longa duração, (Lisboa, 2000), (www.ine.pt)
Peixoto, João,“A Emigração Portuguesa a partir de 1980: Factos estatísticos e
modalidades de evolução”, Estudos Demográficos, 31, (Lisboa, 1996), 35–74.
Pereira, Miguel, J, Bugalho, M., “Economia da Saúde: novos modelos”, Análise
Social, 166, XXXVIII, (Lisboa, 2003).
Remoaldo, Paula Cristina Almeida, A morbilidade e a mortalidade infantil em
territórios. Amostra do distrito de Braga – desigualdades territoriais e sociais,
Dissertação de Doutoramento na Universidade do Minho, (Braga, 1998).
Rocha Pinto, Maria Luís e Teresa Rodrigues, “1981–1991: As tendências recentes da
evolução populacional portuguesa”, História, Ano XVIII (Nova Série), 26,
(Lisboa, 1996), 44–53.
Rocha Pinto, Maria Luís e Teresa Rodrigues, “Migrações internas”, Dicionário de
História do Estado Novo, II, Círculo de Leitores, (Lisboa, 1996), 561–565.
Rocha Pinto, Maria Luís e Teresa Rodrigues, “Natalidade e Fecundidade”,
Dicionário de História do Estado Novo, II, Círculo de Leitores, (Lisboa, 1996),
657–658.
Rocha Pinto, Maria Luís e Teresa Rodrigues, “Migrações no Portugal do século
XX”, Ler História, 43, (Lisboa, 2002), 179–202.
Rocha Pinto, Maria Luís, “As tendências demográficas”, Portugal – 20 Anos de
271
Democracia, Círculo de Leitores, (Lisboa, 1994), 296–306.
Rodrigues, Teresa, Crises de Mortalidade em Lisboa. Séculos XVI e XVII, Livros
Horizonte, (Lisboa 1991).
Rodrigues, Teresa, “A demografia em Espanha e Portugal. Portugal nos dois
últimos séculos: as assimetrias de crescimento regional, Los 98 Ibericos y el Mar,
IV, (Lisboa, 1998), 139–162.
Rodrigues, Teresa, “As grandes linhas de evolução da população portuguesa no
último século”, Seminário Censos 2001, INE, (Lisboa, 2001), 26–35.
Rodrigues, Teresa, “Os factores de mudança no Portugal das regiões (séculos XIX e
XX)”, População e Sociedade, 7, (Porto, 2001), 173–193.
Rodrigues, Teresa, Lisboa no século XIX. Dinâmica populacional e Crises de
Mortalidade.Dissertação de Doutoramento em História Económica e Social,
FCSH-UNL, (Lisboa, 1993).
Rodrigues, Teresa, “A população portuguesa nos séculos XIX e XX: o acentuar das
assimetrias de crescimento regional”, População e Sociedade, 1, (Porto, 1995),
57–72.
Rodrigues, Teresa, “A população portuguesa no século XX – Permanências e
mudanças”, Ler História, 53, (Lisboa, 2003).
Rodrigues, Teresa, “Os portugueses do Século XX: a perspectiva demográfica”,
História, Ano XVII, 11/12, (Lisboa, 1995), 64–75.
Rodrigues, Teresa, Luís Baptista, “Population and Urban Density: Lisbon in the
19th and 20th centuries”, Urban dominance and labour market differentiation of
a European capital city, Kluwer Ac.Publ., (London, 1996), 72–122.
Rosa, Maria João Valente, “O envelhecimento da População Portuguesa”, Cadernos
do Público, 3, Lisboa, (Lisboa, 1996).
Santana, Paula, Helena Nogueira, “A esperança de vida em Portugal”, Cadernos de
Geografia, 20, (Coimbra, 2001).
Santana, Paula, “A mortalidade evitável em Portugal Continental, 1989 a 1993”,
Revista de Estudos Demográficos, INE, (Lisboa, 2002), 107–145.
Sousa, Fernando de Sousa, A população portuguesa nos inícios do século XIX
Dissertação de Doutoramento. Faculdade de Letras da UP, (Porto, 1979).
272
Tables
Table 1. Phases of differential growth.
Inter-census periods*
Population
Annual average growth rate
Beginning of End of period
period
3115330
3844119
0.42
1801–1851
3844119
6164018
0.72
1851–1917
6164018
6080135
-0.46
1917–1920
6080135
8200913
1.20
1920–1945
8200913
8373508
0.07
1945–1974
8373508
9010160
3.73
1974–1976
9010160
9803869
0.50
1976–1993
9803869
10355824
0.69
1993–2001
Source: Iº to XIVº Recenseamentos Gerais da População Portuguesa, 1867–2002.
Commentary: 1801–1851 – period of social and political instability, civil war and three French
invasions; 1851–1917 – economic (industrial and urban) development, decline in mortality levels;
1917–1920 – critical period (war, emigration, Spanish flu); 1920–1945 – population growth is due
to differences between mortality and fertility levels, this last one still high; 1945–1974 –
emigration stands as the most important variable and influences global population growth; 1974–
1975 – democratic revolution brings 500 thousand people from African colonies and Europe;
1976–1993 – major changes in demographic behaviours; 1993–2001 – Portugal became an
positive migratory country.
* Estimated population 1917 = Census population.1911 + annual average growth rate.0.78 (1912,
1913) + annual average growth rate 0.39 (1914, 1915, 1916) = 6164018.
Est. pop. 1945 = Census population 1940+1950/2+ correction of null migratory balance (+68081) = 8200913.
Est. pop. 1974 and 1976 = Census population.1970+ annual average growth rate 1970/81(this
procedure leads to an over-evaluation error, due to a lower trend of physiological balances) + 500
thousand ex-colony inhabitants = 8 373 508. The decade’s median growth rate was levelled in
order to obtain the probable population in 1976 = 9 010 160.
Est. pop. 1993 = Census population 1991 + physiological balances (1991/92) + migratory balances
(1991/92) = 9803869.
Table 2. Annual natural population growth rate (NR),
total population growth rate
th
(TR) and net migration (NM) in Portugal in the 20 century (%).
Inter-census periods
NR
TR
NM
1.20
0.86
-0.34
1900–1911
0.79
0.14
-0.65
1911–1920
1.26
1.24
-0.02
1920–1930
1.15
1.24
0.09
1930–1940
1.05
0.89
-0.16
1940–1950
1.22
0.48
-0.74
1950–1960
1.15
-0.21
-1.36
1960–1970
0.85
1.29
0.44
1970–1981
0.34
0.03
-0.31
1981–1991
0.08
0.45
0.37
1991–2001
Source: Estatísticas Demográficas, 1968, p.LXX e XIº to XIVº Recenseamento Geral da
População Portuguesa, 1970,1981,1991 e 2001.
273
th
Table 3. Crude death rates in Portugal in the 19 century (‰).
Years
1801
1838
1843
1849
1850
1862
1975
1890
1895
1900
Crude mortality rate
30.3
20.8
20.8
25.0
22.7
23.5
24.1
25.5
20.8
20.5
Source: IVº Recenseamento Geral da População.
th
Table 4. Main indicators of mortality levels in the 20 century.
Years
CMR
IMR
EoM
EoF
AVR(M)
AVR(F) E0 (M-F)
25.5
> 200
35.4
38.2
–
–
2.8
1890
20.5
36.2
39.8
2.21%
4.02%
3.6
> 200
1900
23.7
161.0
35.8
40.0
-1.12%
0.50%
4.2
1920
17.1
143.6
44.8
49.2
20.09%
18.70%
4.4
1930
15.9
126.1
48.6
52.8
7.82%
6.82%
4.2
1940
12.2
98.0
55.5
60.5
12.43%
12.73%
5.0
1950
11.0
83.5
60.7
66.8
8.57%
9.43%
6.1
1960
10.9
51.3
64.2
70.8
5.45%
5.65%
6.6
1970
9.7
24.3
69.1
76.7
7.09%
7.69%
7.6
1981
10.6
10.8
70.4
77.4
1.85%
0.90%
7.0
1991
10.8
6.9
71.6
78.6
1.68%
1.53%
7.0
1995
10.2
5.0
73.5
80.3
2.59%
2.12%
6.8
2001
10.2
4.9
73.7
80.6
0.27%
0.37%
6.9
2002
Source: IIIº a XIVº Recenseamentos Gerais da População Portuguesa, 1893–2002; Estatísticas
Demográficas, 1891–2002.
Commentary: CMR (crude mortality rate): deaths/1000 pop; IMR (infant mortality rate): deaths
at 0 years/1000 births; EoM and EoF (expectancy at birth for Male and Female): number of years;
AVR(M) and AVR(F) (variations between periods for Male and Female): EoM (1890–1900)/100
and EoF(1890–1900)/100; Eo(M-F) (differences in life expectancy at birth between Male and
Female): number of years.
Table 5. Infant mortality rate (‰).
Years
Endogenous IMR
Exogenous IMR
1960/61
15.7
67.5
1970/71
17.1
36.6
1980/81
13.1
10.0
1990/91
6.1
4.8
2000/01
2.7
2.6
Source: Anuários Demográficos (1960,1961) and Estatísticas Demográficas (1970 to 2002).
Commentary: Exogenous IMR=death caused by infectious diseases and external causes; Endogenous
IMR= death caused by non-communicable diseases and physical problems in the first 27 days of
life.
274
Table 6. Main Death Causes (%) in Portugal 1930–2000.
Causes of death
1930
1950
1990
Circulatory system
Tumours
Respiratory system
External causes
Digestive system
Endocrinal and metabolic dis.
Infectious diseases/AIDS
Non specified in official
statistics
2000
15.5
2.7
9.4
2.4
14.2
0.0
23.6
21.9
4.9
15.9
2.7
9.2
0.0
18.8
44.2
18.0
7.2
6.5
4.5
3.1
0.9
38.9
20.9
9.8
5.4
3.9
4.5
2.7
32.2
26.6
15.6
13.9
Source: Maria da Graça Morais, A transição da mortalidade e estruturas de causas de morte em
Portugal continental durante o século XX, Dissertação de Doutoramentoem Demografia,
Universidade de Évora , Évora, 1999; António Barreto (org.) A situação social em Portuga, 1960–
1995, Lisboa, ICS, 1996; Elementos Estatísticos Informação Geral. Saúde/2003, Lisboa, DirecçãoGeral de Saúde, 2003
Table 7. Life Expectancy at 65, for men and women in Portugal 1930–2001.
Years
Males
Females
Differences AVR(M)% AVR(F)%
1930
1950
1970
1981
1991
2001
11.47
12.35
12.20
14.36
14.83
15.55
13.09
14.35
14.65
17.95
18.39
19.01
1.62
2.00
2.45
3.60
3.56
3.46
–
0.384
-0.061
1.762
0.334
0.485
–
0.481
0.105
2.253
0.245
0.337
Commentary: AVR(M) and AVR(F)= variations between periods for Male and Female: EoM
(1930–1950)/100 and EoF(1930–1950)/100.
275
Table 8. Loss of years of life, by sex and specific causes of death, in Portugal (per
100,000).
1990
1995
2000
Causes of Death
Males Females Males Females Males Females
All causes
9143
4436
8397
3692
7072
3141
Tumours
1250
953
1203
872
1191
824
Endocrine and
metabolic diseases
222
112
655
196
547
187
Diseases of the
circulatory system
1182
553
1028
442
855
366
Diseases of the
digestive system
518
189
460
156
363
134
Diseases of the
respiratory system
407
206
306
113
252
104
HIV/AIDS
85
14
552
105
451
108
External Causes
2774
779
2280
628
1560
390
Road accidents
1390
340
1210
309
654
141
Suicide
257
78
202
76
115
27
Source: Elementos Estatísticos Informação Geral. Saúde/2003, Lisboa, Direcção-Geral de Saúde,
2003.
Commentary: Loss of years is used as an indicator that tries to estimate how many years in total
life expectancy are lost by all Portuguese population due to the impact of these specific diseases.
276
Baixar