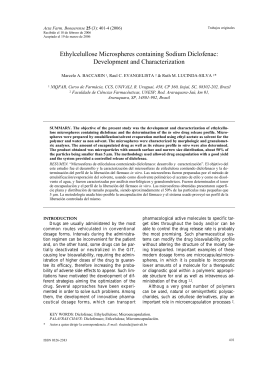
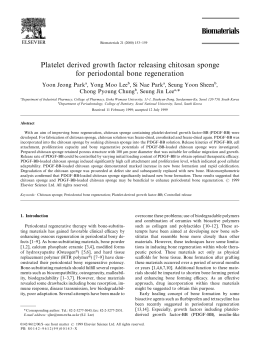
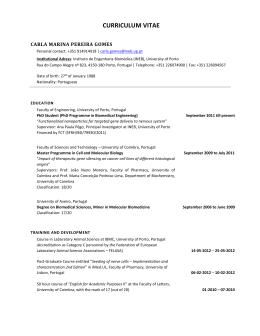
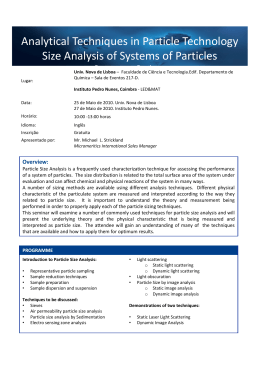
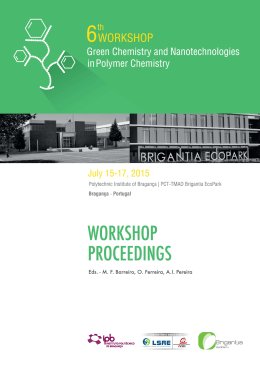
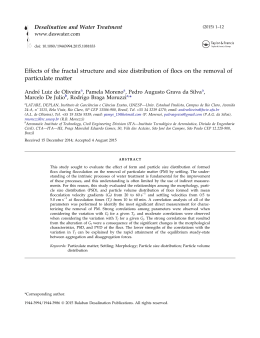
Materials Research, Vol. 10, No. 4, 347-352, 2007 © 2007 Production of Chemically Modified Chitosan Microspheres by a Spraying and Coagulation Method Marco Antonio Torres*, Rodrigo Silveira Vieira, Marisa Masumi Beppu, Eduardo José Arruda, Cesar Costapinto Santana School of Chemical Engineering, Universidade Estadual de Campinas – UNICAMP, CP 6066, 13083-970 Campinas - SP, Brazil Received: February 12, 2007; Revised: September 3, 2007 Chitosan microspheres can be used in several applications, as biomaterials, in biotechnology processes and as adsorbents. The control of particle size in microsphere production is important to make these applications viable. This study focuses on the production and morphological characterization of chitosan microspheres. Microspheres were prepared by a spraying and coagulation process. Particles underwent chemical modifications with glutaraldehyde, epichlorohydrin or acetic anhydride treatments. The microspheres presented a fairly good sphericity (0.74) but an irregular micro-surface morphology. The mean particle size (MPS) ranged from 140 to 281 µm and the mean standard deviation (MSD) from 119 to 238 µm. The conditions were modelled to provide desired MPS and MSD by using the response surface methodology (RSM). Keywords: chitosan, microspheres 1. Introduction Chitosan is a biodegradable, hydrophilic, non-toxic and biocompatible polysaccharide that presents a remarkable economic interest due to its functional versatility, with potential applications in medical and pharmaceutical fields1-6. Yamaguchi observed chitosan composites and their application in nerve regeneration7. Mi studied chitosan microspheres as a coating material for the controlled release of vaccines8. Furthermore, small chitosan microspheres (<10 µm) prepared by a spray drying process, have been developed for the specific release of drug agents9. Large chitosan microspheres (>50 µm) prepared by the emulsion method have been used in delivery systems10 or as adsorbents to remove acid pollutants or heavy metals. Recently, a number of articles have been published describing the preparation of microspheres by spray drying and emulsion process methods. Microspheres obtained from these methods present a relatively narrow distribution of particles. Most chitosan particle applications are greatly influenced by their size distribution11. In the present study, chitosan porous microspheres were prepared by a spraying and coagulation method. This new method is rapid, reproducible, easy-to-scale-up and economic and can represent an alternative to previously known techniques. It also presents the advantage of not using high temperatures (as in the spray drying process) and there is no need to use other solvents in the emulsification steps. The sphericity, internal morphology and internal cross-section of particles were also characterized after performing chemical modifications that may improve their chemical and mechanical stability. Chitosan is usually produced by deacetylation of chitin to different degrees. It is formed by β-(1 → 4)-linked 2-amino-2-deoxyD-glucopyranose (GlcN, D-unit) and 2-acetamido-2-deoxy-Dglucopyranose (GlcAc, A-unit) units12. The presence of free amino groups in chitosan is responsible for its polycationic nature in acidic solutions. An important advantage of chitosan is the possibility of agents that perform chemical modifications on its structure by binding to amino and hydroxyl groups13. Crosslinking with epichlorohydrin maintains the cationic amino function and improves the mechanical properties of *e-mail: [email protected] the material14. On the other hand, Muzzarelli studied the crosslinking mechanism of chitosan with the bifunctional glutaraldehyde agent. This crosslinking reaction occurs between primary amino groups and aldehyde groups, resulting in the formation of schiff bases15. As another way to modify chitosan, acetylation modifies the structure and functionality of chitosan, improving its chemical resistance, producing an IR spectrum similar to that of chitin16. These structures are shown in Figure 1. In the present methods, the three of modifying chitosan were applied on microspheres after their production in order to investigate the induced changes in their morphology and properties. 2. Materials and Methods 2.1. Materials Chitosan (from Sigma), with a minimum of 85% of deacetylation (extracted from crab shells) was used. Glutaraldehyde (25%, v.v–1) aqueous solution was provided by Nuclear. Epichlorohydrin was provided by Merck. Acetic anhydride and methanol were purchased from Vetec and Synth, respectively. The nozzle (Figure 2) was purchased from Spraying Systems of Brazil. Tubing was provided by Masterflex. 2.2. Preparation of chitosan microspheres Chitosan was dissolved in a (3%, v.v–1) acetic acid solution in Milli-Q water. The scheme for the spraying and coagulation process is shown in Figure 3. The solution fed into the nozzle with a peristaltic pump was sprayed using compressed nitrogen. The atomization occurred by the force of the compressed nitrogen, which breaks up the chitosan solution into small droplets. The sprayed particles were kept in contact with NaOH coagulating solution for 12 hours. The particles were then collected and washed with abundant Milli-Q water. Several operating parameters can affect the preparation of the produced microspheres and their characteristics: inlet solution 348 Materials Research Torres et al. CH2OH NH2 PCI O O O Ch OH OH O O O N CH2O NaOH CH2 N2 CHOH Figure 3. Spraying and coagulation process scheme. CH2 CH2O N O O O OH HO O CH2OH NH2 (a) H2C H H O H H N H OH OH H2C H OH C 2.3. Preliminar set-ups (b) OH O at 0.025 g.mL-1 and nozzle aperture at 1 mm. Nitrogen pressure and chitosan solution flow rate were chosen as parameters to be studied by response surface methodology. O O O O H2C H O H H OH O H OH O H H H H N H C CH3 O O H N NH2 CH3 (c) Figure 1. Chemical structures of chitosan modified with: a) epychlorohydrin; b) glutaraldehyde; and c) acetic anhydride. Some parameters, despite being important in the process, had their values fixed for experimental design. The temperature of the chitosan solution had little influence on the results. Temperatures of 15 and 35 °C (room temperature 25 °C ± 10 °C) were tested, not producing significant changes in microsphere size and standard deviation results. These findings are in accordance with studies performed with chitosan solution at the concentration of 0.025 g.mL–1 and molecular mass of 65 kDa17, which showed that variations in the range of ±10 °C did not cause important changes in the viscosity and, hence, in the shear conditions observed during the process studied18. Chitosan solution presents non-newtonian fluid behavior, with polymeric chains that are highly auto-interactive. With regard to the concentration of chitosan solution, a change in solution viscosity could be observed when its concentration changed between 0.03 and 0.02 g.mL–1. Due to the practical limitations of the peristaltic pump (Cole Parmer model 302FM-B), the concentration of 0.025 g.mL–1 was set in the design of experiments. The nozzle opening was set at 1 mm. The height in which the nozzle was positioned, relatively to the surface of the NaOH solution, only had influence on the microspheres morphology. Higher distances produced a less distorted microsphere shape (allowing enough time for a viscous material droplet to acquire spherical shape before reaching NaOH coagulant solution). The height was then set at 30 cm (Tables 1 and 2). 2.4. Crosslinking of chitosan microspheres Figure 2. Nozzle used in microsphere obtention. temperature, chitosan viscosity (i.e. chitosan concentration whilst biopolymer molecular weight distribution was kept constant), nitrogen pressure and chitosan solution flow rate. The following parameters were kept constant for microsphere production (set by preliminar analyses): inlet solution temperature at 25 °C; chitosan concentration Microspheres were heterogeneously crosslinked in (0.75%, w.w–1) aqueous glutaraldehyde solution (5 g of wet chitosan microspheres in 50 mL of glutaraldehyde solution), without agitation, at room temperature for 2 hours. The particles were then rinsed with deionized water to remove the unreacted glutaraldehyde residues. For the epichlorohydrin crosslinking process, 5 g of wet natural chitosan microspheres were immersed in 0.01 M epichlorohydrin solution, which was prepared in 0.067 M NaOH solution, at 40 °C under continuous agitation for 2 hours. The particles were then rinsed with deionized water to remove the unreacted epichlorohydrin. Other microspheres were modified in a (0.6%, v.v–1) methanol acetic anhydride solution, at room temperature under continuous agitation for 3 minutes. Afterwards, the micropaticles were rinsed with methanol to remove the unreacted acetic anhydride. The deacetylation values of microspheres were found to be about 70%, as calculated by potentiometric titration19. All microspheres were stored in Milli-Q water at 7 °C. Vol. 10, No. 4, 2007 2.5. Response surface Response surface methodology (RSM) with two variables, nitrogen pressure (NP) and chitosan solution flow rate (CSFR), at 3 nominal levels (–1, 0, 1) was used to study the response pattern for mean microspheres size and for mean standard deviation. Three replicates at the center of the design were used to estimate the error, assuming system homoscedasticity. The coordinates are given by a 2n factorial design to provide the estimation of the model curvature through the non-linear relationship20. Table 3 depicts the correspondent values for experimental levels of each factor. nitrogen pressure (NP)) in an appropriate regression model fit by a multiple regression program. The response surfaces are shown in Figures 4a and 4b. The effects of these variables on the responses are shown in Table 5. A value of p < 0.05 was considered significant for both first order factors and for their combined effect. The NP quadratic term was not considered significant. The values found for Y1 = 184 – 64.50 x1 – 23.50 x2 – 76.50 x1x2 + 76.50 x12 147.146 164.307 181.468 198.630 215.791 232.953 250.114 267.276 284.437 301.599 Above diameter Microspheres had their mean particle size (MPS) and mean standard deviation (MSD) measured using a Malvern MasterSizer (model S-1000) equipment. Experiments were performed in triplicate and average values were reported. Microsphere sphericity was calculated by taking the ratio between the larger internal diameter and smaller external diameter of circumferences of microspheres, as observed by SEM21. Ten images were used to determine an average sphericity value. The morphology of microspheres was observed using a Jeol scanning electron microscope. The microspheres were prepared after freeze-drying and sputter-coating with a gold layer (SCD 050 -Baltec, Liechenstein). The internal morphology of crosslinked microspheres was observed by imersing them in a polyacryamide resin, which hardened allowing the particles to be freeze-fractured, making the observation of the internal structures and distribution of pores possible. Microspheres 2.6. Characterization of chitosan microspheres Y2 = 145.67 – 50.50 x1 – 35.50 x2 – 68.50 x1x2 + 101.17 x12 Table 1. Influence of parameters. Inlet temperature Values 0.02 g.mL–1 Effect (microns) –20 0.03 g.mL–1 15 °C 35 °C ND 10 –5 320 280 240 200 160 120 ation Table 4 depicts the values equation that correlates to the final particle size with variables (chitosan solution flow rate (CSFR) and 118.488 134.322 150.156 165.990 181.823 197.657 213.491 229.325 245.159 260.993 Above Standard devi 3.1. Size results 340 300 260 220 180 140 5 2.8 5 8.4 2.3 .05 8.6 8 . Pr 2 .75 7 es .2 7 rate su 1 1.45 5 4 8 low re . 1 . 5 1 .85 .8 F 0 4 (a) 3. Results and Discussion Parameters Concentration of chitosan solution 349 Production of Chemically Modified Chitosan Microspheres by a Spraying and Coagulation Method 5 2.8 5 8.4 2.3 05 8.6 8 Pr 2. 5 . es 7 7 te su 1.7 .45 8.2 w ra re 1 .15 4 . 1 85 .8 5 Flo 0. 4 (b) Figure 4. a) Response surface, showing the effects of chitosan solution flow rate (CSFR) (mL/min) and nitrogen pressure (NP) (kgf.cm–2) on microsphere diameter (µm); and b) Response surface, showing the effects of chitosan solution flow rate (CSFR) (mL/min) and nitrogen pressure (NP) (kgf.cm–2) on standard deviation (µm). Table 2. Values of constant parameters used in the study. Parameters Concentration of chitosan solution Values 0.025 g.mL–1 Inlet temperature Nozzle Height (nozzle-NaoH solution) Table 4. Treatment schemes for a two-factor design of experiments and responses: mean particle size (MPS) and mean standard deviation (MSD). 25 °C 1 mm 30 cm Table 3. Factors used in the design of experiments and their levels. Levels Chitosan solution flow rate (mL/min) Nitrogen pressure (kgf.cm–2) –1 5 1 0 1 7 1.75 9 2.5 Experiment number 1 CSFR –1 2 3 4 5 6 7 1 –1 1 0 0 0 NP –1 MPS (µm) 228 MSD (µm) 205 –1 1 1 0 0 0 240 281 140 179 186 187 223 238 119 140 145 152 350 Materials Research Torres et al. 280 260 240 220 200 180 160 140 120 120 140 160 180 200 220 240 260 280 300 240 260 Observed values (a) Observed vs. predicted values for model Y2 260 240 Predicted values 3.2. Optimized production Specific characteristics of particle size and standard deviations are necessary for each microparticle application. When used as a biomaterial or adsorbent, small particle size and standard deviation are required. Particle size can influence the efficiency of drug delivery systems or the manner by which an adsorption column works. In our case, the microspheres are to be used as adsorbents. A 140 µm mean particle size was then set as an acceptable target value. This was reached by using the initial conditions of 9 mL/min for CSFR and 2.5 kgf.cm–2 for NP. By observing the response surfaces, it is possible to visualize the operation point in the minimum areas of the surfaces. The microsphere size distribution in optimum conditions is shown in Figure 6. The corresponding optimized conditions are presented in Table 6. Observed vs. predicted values for model Y1 300 Predicted values mean particle size and mean standard deviation of microsphere sizes were between 140 to 281 µm and 119 to 238 µm, respectively. Results indicate that increased values of CSFR and NP decrease the values of mean particle size and mean standard deviation of microspheres. There are, however, limits in the values to be assigned to these variables. These limits are intrinsic to the system and are related to the equipment and physical constraints of connections. Values of higher than 2.5 kgf.cm–2 to NP cause the reflux of the chitosan solution line. Values of higher than 10 mL/min CSFR cause the dilatation of the silicone line through which the chitosan solution flows (see Figure 3). Conversely, decreasing CSFR and NP values produce high mean particle size and standard deviations values. The R2 correlation coefficient was 0.99 and statistical parameter (F) values suggest that the model fits the experimental data well. The suitability of model equations for predicting the optimum response values was tested. The experimental values were found to be in agreement with the predicted ones (Figures 5a and b). The values of the mean particle size and its standard deviation of particles, obtained by the present method, are higher when compared to the values found for spray dried22 particles, but the necessary investment in equipment is approximately 50 times lower. 220 200 180 160 140 120 100 100 120 140 160 180 200 220 Observed values (b) Figure 5. a) Predicted and observed values for model Y1 = microsphere diameter (µm); and b) Predicted and observed values for model Y2 = standard deviation (µm). Table 5. Effects of chitosan solution flow rate (CSFR) and nitrogen pressure (NP) parameters on mean particle size (MPS) and mean standard deviation (MSD). Factors NP CSFR NP.CSFR CSFR2* Effect MPS (microns) (-)23.50 (-)64.50 (-)76.50 76.50 on MSD (microns) (-)35.50 (-)50.50 (-)68.50 101.17 * NP and CSFR, NP.CSFR, CSFR2 are the linear, cross and quadratic terms respectively. Volume (%) 100 20 90 80 70 60 10 50 40 30 Table 6. The optimized conditions for chitosan microparticle production. Parameters Concentration of chitosan solution Inlet temperature Nozzle Height (nozzle-NaoH solution) Nitrogen pressure NP Chitosan solution flow rate CSFR Values 0.025 g.mL–1 25 °C 1 mm 30 cm 2.5 kgf.cm–2 9 mL/min 20 10 0 0.1 1.0 10.0 100.0 1000.0 0 Particle diameter (Mm) Figure 6. Chitosan microsphere size distribution, produced in optimum conditions for nitrogen pressure, 2.5 kgf.cm–2, and for chitosan solution flow rate, 9 mL/min. Vol. 10, No. 4, 2007 3.3. Morphology The morphology of chitosan microspheres, prepared by the spraying and coagulation method, was examined by scanning electron microscopy (SEM). The sphericity of the microspheres was calculated as 0.74 ± 0.14. Similar morphology was observed for microspheres modified with epichlorohydrin and glutaraldehyde: good sphericity and a slightly wrinkled surface (Figures 7a and 7b), respectively. Improved sphericity was achieved for glutaraldehyde and epichlorohydrin – crosslinked microspheres, because the other structures tend to collapse. However, it is know that longer spray distances could improve the quality of spray dried particles23. For 30 m 20 kV 400x SE1 acetylated chitosan, microspheres presented a collapsed surface, as shown in Figure 7c. The deformation of the acetylated structure may be explained due to the differences of hydrophobicity between internal and external parts of formed microspheres. The heterogeneous acetylation (the reaction occurs from outside to inside) may have intensified the deformation, when compared to the homogeneous acetylation. Chitosan microsphere cross-sections with epichlorohydrin and glutaraldehyde presented pores with irregular shapes and sizes (Figures 8a and 8b), respectively. In acetylated chitosan microspheres, the fracture surface revealed collapsed internal structures (Figure 8c). This finding indicates that the acetylation degree obtained was not 30 m (a) 30 m 20 kV 20 kV 20 kV 500x SE1 500x SE1 500x SE1 (a) 400x SE1 20 m (b) 200 m 351 Production of Chemically Modified Chitosan Microspheres by a Spraying and Coagulation Method 20 kV (b) 100x SE1 20 m 20 kV (c) (c) Figure 7. a) Scanning electron micrograph of chitosan microspheres, modified with epychlorohydrin; b) Scanning electron micrograph of chitosan microspheres, modified with glutaraldehyde; and c) Scanning electron micrograph of chitosan microspheres, modified with acetic anhydride. Figure 8. a) Scanning electron micrograph of epychlorohydrin-treated chitosan microsphere fracture; b) Scanning electron micrograph of glutaraldehyde-treated chitosan microsphere fracture; and c) Scanning electron micrograph of chitosan microspheres cross section morphology modified with acetic anhydride. 352 Torres et al. sufficient to maintain the microsphere structure intact during the SEM sample-preparation process. Chitosan microspheres crosslinked with epychlorohydrin presented better resistance to handling than natural chitosan microspheres. The method presented of chitosan microsphere production proved to be very versatile and demostrated the possibility of associating the material with further chemical modifications, making this technique a very useful and easy route for achieving chitosan porous microparticles suitable for many applications. The chemical differences between the two obtained structures indicate that all interactions between the polymeric matrix and the other species will have an important effect on the final performance and specificity of the adsortion processes. 4. Conclusions The spray and coagulation process, under different operating conditions, can produce chitosan microspheres of different sizes with a relatively narrow particle distribution. The microspheres produced by this method and the optimization results indicate a possibility of controlling particle size and, consequently, standard deviation, according to the application aimed. Chemical modifications to these particles allow the production of microspheres with different mechanical resistance and final morphology. Acknowledgments The authors acknowledge CNPq and FAPESP, Brazil, for financial support. References 1. Roberts GAF. Chitin Chemistry. The Macmillian Press Ltd, London; 1992. 2. Tangpasuthadol V, Pongchaisirikul V, Hoven VP. Surface modification of chitosan films: Effects of hydrophobicity on protein adsorption. Carbohydrate Research. 2003; 338(9):937-942. 3. Lee ST, Mi FL, Shen YJ, Shyu SS. Equilibrium and kinetic studies of copper(II) ion uptake by chitosan-tripolyphosphate chelating resin. Polymer. 2001; 42(5):1879-1892. 4. Huang RYM, Moon GY, Pal R. N-acetylated chitosan membranes for the pervaporation separation of alcohol/toluene mixtures. Journal of Membrane Science. 2000; 176(1):223-231. 5. Chirachanchai S, Lertworasirikul A, Tachaboonyakiat W. Carbaryl insecticide conjugation onto chitosan via iodochitosan and chitosan carbonyl imidazolide precursors. Carbohydrate Polymers. 2001; 46(1):19-27. Materials Research 6. Muslim T, Morimoto M, Saimoto H, Okamoto Y, Minami S, Shigemasa Y. Synthesis and bioactivities of poly(ethylene glycol)–chitosan hybrids. Carbohydrate Polymers. 2001; 46(4):323-330. 7. Yamaguchi I, Itoh S, Suzuki M, Osaka A, Tanaka J. The chitosan prepared from crab tendon: II. The chitosan/apatite composites and their application to nerve regeneratio. Biomaterials. 2003; 24(1):3285-3292. 8. Mi FM, Shyu SS, Chen CT, Schoung JY. Porous chitosan microsphere for controlling the antigen release of Newcastle disease vaccine: preparation of antigen-adsorbed microsphere and in vitro release. Biomaterials. 1999; 20(17):1603-1612. 9. Mi FL, Wong TB, Shyu SS, Chang SF. Journal of Applied Polymer Science. 1999; 71:747. 10. He P, Davis SS, Illum L. Chitosan microspheres prepared by spray drying. International Journal of Pharmaceutics. 1999; 187(1):53-65. 11. Braek S, Anthonsen T, Sandford P. Chitin and Chitosan. London: Elsevier; 1989. 835p. 12. Arruda EJ, Santana CC. Phenylboronate – chitosan resins for adsorption of beta-amylase from soybean extracts. Applied Biochemistry and Biotechnology. 2003; 105(2):829-842. 13. Monteiro OAC, Airoldi C. Some studies of crosslinking glutaraldehyde interaction in a homogeneous system. International Journal of Biological Macromolecules. 1999; 26(2):119-128. 14. Hudson SM, Wei YC, Hudson SM, Mayer JM, Kaplan DL. Journal of Polymer Science. 1992; 30(1):2187-2193. 15. Muzzarelli RAA. Chitin Handbook, Plenum, editors, Italy; 1977. 16. Hirano S, Ohe Y, Ono H. Selective N-acylation of chitosan. Carbohydrate Research. 1976; 47(1):315-320. 17. Beppu MM. Estudo da Calcificação “in vitro” de Quitosana. [Thesis]. State University of Campinas; 1999. 18. Lapasin R, Pricl S. Rheology of Industrial Polysaccharides: Theory and Applications, Blackie, editors, London, 1995. 19. Raymond L, Morin FG, Marchessault RH. Degree of deacetylation of chitosan using conductometric titration and solid-state NMR. Carbohydrate Research. 1993; 246(1):331-336. 20. Barros Neto B, Scarminio IS, Bruns BE. Planning and Optimization of Experiments. Unicamp publisher, Campinas; 1996. 21. Peçanha RP, Massarani, G. Dimensão característica e forma de partículas. Anais XIV ENEMP, Campinas; 1986. 22. Oliveira BF, Santana MHA, Ré MI. Spray-dried chitosan microspheres cross-linked with D,L-Glyceraldehyde as a potential drug delivery system: preparation and characterization. Brazilian Journal of Chemical Engineering. 2005; 22(3):353-360. 23. Torres MA, Santana CC, Beppu MM, Arruda EJ. Obtenção e caracterização de microesferas de quitosana natural e modificada quimicamente com epicloridrina. Anais VII Congresso Brasileiro de Polímeros, Belo Horizonte; 2003.
Baixar