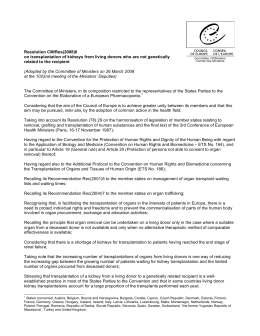
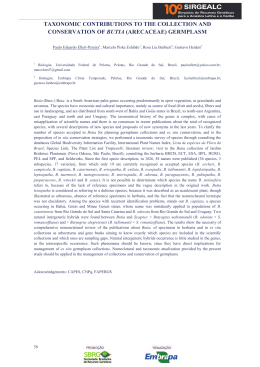
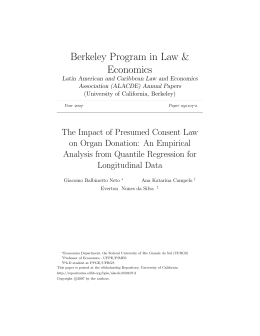
Rev Saúde Pública 2010;44(1)
Alethea Zago
Mariângela Freitas da Silveira
Samuel C Dumith
Blood donation prevalence and
associated factors in Pelotas,
Southern Brazil
ABSTRACT
OBJECTIVE: To estimate the prevalence of blood donation and factors
associated.
METHODS: A cross-sectional study was carried out with a representative
sample of 2,986 individuals, aged 20 or more, in the municipaly of Pelotas,
Southern Brazil, in 2007. Three outcomes were considered: ever donating
blood, donation during in the previous year and frequent donation pattern
(at least two donations in the previous year). Each outcome was analyzed
according to demographic, socioeconomic and health factors, exposure to blood
donation publicity campaigns and whether the donor had a relative or friend
who donated blood. The crude and multivariable analyses were performed
using Poisson’s regression, adjusted for sample design effect.
RESULTS: Blood donation prevalence – ever, in the previous year and a
frequent donation pattern – were 32%, 7.7% and 3.6%, respectively. Blood
donation was more prevalent among males and increased in accordance with
the economic level and health self-perception. The prevalence of ever donating
blood was higher in the 50 to 65 years age group; in the previous year, it was
higher among younger people (20 to 29 years); frequent donation was more
prevalent in the 30 to 49 group. There was no association of the outcomes with
skin color, marital status, religion, having a relative or friend who donates or
knowing about publicity campaigns.
CONCLUSIONS: Blood donation was more prevalent in men and in those who
have better self-perception of health and a higher economic level. Campaigns
encouraging blood donation should diversify the donor profile for reaching
those groups of people who are less inclined to donate blood.
Descriptors: Blood Donors. Prevalence. Socioeconomic Factors.
Cross-Sectional Studies
Programa de Pós-Graduação em
Epidemiologia. Departamento de Medicina
Social. Universidade Federal de Pelotas.
Pelotas, RS, Brasil
Correspondence:
Alethea Zago
R. Gonçalves Chaves, 3657/201B – Centro
96015-560 Pelotas, RS, Brasil
E-mail: [email protected]
Received: 11/17/2008
Revised: 4/20/2009
Approved: 7/9/2009
en_12.indd 1
28/1/2010 16:19:53
2
Blood donation prevalence
Zago A et al
INTRODUction
Donating blood is an act that can save the lives of
thousands of people worldwide. In England, in 2004
one million of lives were saved or improved by a blood
transfusion. In the United States, also in 2004, four and
a half million of deaths were avoided due to this act.a
In Brazil, there are no available data about how many
people die or suffer some other type of damage due
to the lack of blood or blood products. Estimates
from the Ministry of Health indicate that 1.8% of the
Brazilian population voluntarily donates blood every
year.b However, the World Health Organization (WHO)
advocates that 3% to 5% of the population should
donate blood every year, which would be the ideal rate
for maintaining a country’s stocks of blood and blood
products at acceptable levels.b
Turning people into loyal blood donors – a term referring to at least two donations per year, according to the
National Health Surveillance Agency (Anvisa)c, – is
an extremely relevant issue, since increasing indices
would raise the absolute number of donations coming
from donors who are known to be both healthy and
suitable.
In 2005, a wide national studyd about the profile of
Brazilian blood donors was carried out including just
blood donation centers.
The objective of this study was to estimate the prevalence of having ever donated blood, blood donation
in the previous year and loyal blood donation and the
factors associated.
METHODS
A cross-secional population-based study was conducted
in the city of Pelotas, Southern Brazil, between October
2007 and January 2008. The study was part of a larger
project that evaluated the health and behavioral exposure of the adult population of the town.e
Sampling was done in multiple stages. Of the 404
residential census tracts in Pelotas, 126 were randomly
selected, with a probability that was proportional to the
size of the tract and ordered according to the income of
the head of the family, in accordance with data from the
2002 census of the Brazilian Institute of Geography and
Statistics (IBGE).f As the IBGE establishes an average
of 2.1 adults (20 years old or more) per household,
1,428 households were previously selected, which
when divided by the 126 tracts, resulted in about 12
households per tract.
To calculate the size of the sample, a blood donation
prevalence rate over the previous year of 5%3 was
estimated, with a 1 percentage point margin of error,
resulting in a sample of at least 2,504 adults, aged 20
or more. Despite individuals over 18 being capable of
donating blood according to the Ministry of Health, a
lower limit of 20 was used because this is the start of
the adulthood, according to the WHO. To study associated factors, the highest value encountered relative
to the variable marital status was 2,823 people. The
number of individuals included in the study, however,
exceeded the number calculated for the sample, in order
to meet the demand of other studies that formed part of
the research consortium. For all associations a level of
significance of 95% was considered, a design effect of
1.25 and increase of 10% for possible losses and 15%
for controlling potential confounders.7 Individuals who
were incapable of replying to the questionnaire because
of mental problems were excluded, as were those in
institutions (rest homes for elderly and prisons) at the
time of data collection.
Data were obtained by means of a standard and
previously tested questionnaire, comprising several
questions on health. Three outcomes were considered:
having ever donated blood, donation in the previous
year and a loyal donation pattern. Individuals over
65 (N= 358) were excluded from the analyses of the
outcomes loyal blood donation pattern and donation
in the previous year, in line with guidance from the
Ministry of Health which establishes the age group
for blood donation as being between 18 and 65. The
outcome was obtained by means of the self-reporting
of the respondents about having ever donated blood
and in the year prior to the interview. Information
about loyal donation was obtained from the response
to the question about how many times the individual
had donated blood in the previous year; it was defined
as being at least two donations in the year prior to the
interview. In 10% of the randomly selected sample a
World Health Organization. World Blood Donor Day 2005 Report: “celebrating your gift of blood”; 2006. Available from: http://www.who.
int/worldblooddonorday/resources/WBDD_Report_2005.pdf
b
Ministério da Saúde. Saúde incentiva doações de sangue. [cited 2007 Sep 15] Available from: http://portal.saude.gov.br/portal/saude/
visualizar_texto.cfm?idtxt=25472
c
Agência Nacional de Vigilância Sanitária. Campanha Nacional de Doação de Sangue, 2005. Saúde incentiva doações de sangue. [cited
2007 Sep 17] Available from: http://www.anvisa.gov.br/cidadao/sangue/index.htm
d
Agência Nacional de Vigilância Sanitária. Pesquisa revela perfil de doadores e não-doadores de sangue, 2006 [cited 2007 Sep 16]. Available
from: http://www.anvisa.gov.br/DIVULGA/NOTICIAS/2006/110106_1.htm
e
Projeto Saúde e Comportamento da população adulta da cidade de Pelotas, RS, Brasil; 2007-8, financiado pela Coordenação de
Aperfeiçoamento do Pessoal de Nível Superior.
f
Instituto Brasileiro de Geografia e Estatística. Censo Demográfico 2000. Rio de Janeiro: IBGE; 2000.
a
en_12.indd 2
28/1/2010 16:19:53
Rev Saúde Pública 2010;44(1)
summarized questionnaire was used for quality control
of the interviews. There was a low percentage of losses
or refusals (6.1%).
The following were considered as independent variables: gender; marital status; age; skin color (observed by
the interviewer); schooling (number of years of formal
education completed); economic level, according to the
classification of the Brazilian Association of Research
Companies (ABEP, 2007);a having a religion or not;
having a relative or friend who had donated blood;
having seen or heard about blood donation campaigns
and self-perception of health.
The Epi Info version 6.04d program was used for
double entry of the questionnaires. Data analysis was
carried out using Stata, version 9.0 statistical package.
Poisson regression technique was used for gross and
multivariate analyses, with control for the sample
design effect.7
For the multivariate analysis, a conceptual hierarchical
model was designed, in which the demographic variables were located on the first level, the social-economic
variables on the second level and the other variables
at the third level. The statistical significance of each
variable in the model was evaluated, using the Wald
test for heterogeneity or for trend (when appropriate).
Initially, each block of variables of a particular level
was included in the analysis, with all those variables
with a value of p≤0.20 being maintained. The variables
at an hierarchically superior level in the model or at the
same level were considered as potential confounders.13
The level of statistical significance considered was 5%
for two-tailed tests.
The study was approved by the Research Ethics
Committee of the Faculdade de Medicina of the
Universidade Federal de Pelotas. The participants
signed the informed consent form.
Results
Of the 3,180 individuals eligible for the study, 2,986
(6.1% losses and refusals) were interviewed. Excluding
those who did not fulfill the inclusion criteria the final
sample consisted of 2,956 individuals, of whom three
had no information about blood donation. The sample
design effect for the variable donation in the previous
year was 1.15 (intraclasse correlation coefficient of
0.005), and the kappa coefficient was 87%.
The average age of the interviewees was 45 (standard
deviation, SD= 17). Of the individuals studied 56%
were female and approximately 80% were white. With
3
regard to marital status, 63.2% of those interviewed
said they were married or had a partner or were in a
stable relationship. The average number of years of
schooling was 8.7 (SD=4.3). As for socioeconomic
level, around 45% belonged to economic class C.
Approximately 80% of the interviewees reported
having some kind of religion. More than 70% knew
someone close to them who had already donated blood
and almost 25% of the individuals considered their
state of health to be excellent or very good. As for
blood donation campaigns, 80% of the participants said
they had seen or heard about many campaigns.
The prevalence of having ever donated blood was
32% (95% CI: 30.3;33.7) (Table 1). After adjusting
for confounders, it was observed that donation was
2.3 times higher in men. There was an increasing
tendency to donate blood according to age (greater
for the 50 to 65 age group), schooling (nine or more
years of education) and economic level (1.4 times
greater for economic classes A and B together and
1.3 times greater for class C). Better self-perception
of health also tended to increase blood donation. The
other variables proved not to have any association with
having ever donated blood (Table 1).
The prevalence of blood donation over the 12 months
that preceded the interview was 7.7% (95% CI: 6.8;
8.7) (Table 2). It was observed that blood donation
was 2.5 times greater among men and almost twice
as high among young adult men (20 to 49), but with a
decreasing tendency according to the increase of age.
Skin color and marital status were not associated with
blood donation, either in the gross analysis or in the
adjusted analysis (Table 2).
As for schooling, in the gross analysis, blood donation
tended to increase with the higher number of years of
study. However, this significance did not remain in
the adjusted analysis. There was a positive association
between economic level and donation in the previous
year, with the prevalence of blood donation in the
previous year almost twice as high in economic classes
A and B as in classes D and E.
Of the third level variables, only self-perception of
health had a positive association with blood donation:
individuals who perceived themselves as having excellent or very good state of health donated 2.3 times
more than those who had a regular or poor perception
of their health.
The prevalence of loyal donors was 3.6% (95% CI: 2.9;
4.3) (Table 3). Loyal donation was 3.7 times higher
among men and 2.0 times higher among middle-aged
adult men (30 to 49). Skin color, marital status and
socioeconomic variables (schooling and economic
Associação Brasileira de Empresas de Pesquisa. Critério Padrão de Classificação Econômica Brasil/2008. [cited 2007 Sep 17] Available from:
http://www.abep.org/codigosguias/Criterio_Brasil_2008.pdf
a
en_12.indd 3
28/1/2010 16:19:53
4
Blood donation prevalence
Zago A et al
Table 1. Prevalence, gross and adjusted prevalence ratios and factors associated with having ever donated blood. Municipality
of Pelotas, Southern Brazil, 2007.
Variable
n
Donation
prevalence (%)
Gross analysis
PR (95% CI)
Adjusted analysis
p
PR (95% CI)
<0.001a
Sex
Male
1137
47.8
2.39 (2.14;2.68)
Female
1448
20.0
1
Skin color
2.38 (2.12;2.67)
1
0.377
a
0.596a
White
1896
32.3
1.11 (0.93;1.32)
1.09 (0.92;1.29)
Mixed
137
33.7
1.16 (0.92;1.46)
1.08 (0.87;1.34)
Black
348
29.2
1
1
<0.001a
Marital status
0.179a
No partner
1149
25.7
1
1
Has partner
1805
36.0
1.40 (1.23;1.59)
1.09 (0.96;1.23)
0.002b
Age (years)
0.001b
20-29
711
22.1
0.88 (0.71;1.08)
0.83 (0.68;1.01)
30-49
1143
36.1
1.43 (1.18;1.74)
1.33 (1.11;1.61)
50-65
744
38.3
1.52 (1.26;1.83)
1.45 (1.21;1.73)
66 or more
358
25.2
1
1
0.003a
Schooling (years)
0.050b
0-4
527
26.6
1
1
5-8
933
34.6
1.30 (1.12;1.51)
1.25 (1.08;1.44)
1495
32.3
1.22 (1.06;1.40)
≥9
Economic level
c
1.21 (1.05;1.40)
b
0.002b
<0.001
A/B
1093
C
D/E
36.7
1.56 (1.30;1.86)
1.37 (1.16;1.62)
1362
31.2
1.32 (1.10;1.58)
1.26 (1.07;1.49)
471
23.6
1
1
0.515a
Religion
0.775a
No
642
33.0
1
1
Yes
2312
31.7
0.96 (0.85;1.09)
0.98 (0.87;1.11)
0.529a
Donor relative
0.723a
No
880
32.5
1
1
Yes
1996
31.3
0.96 (0.86;1.08)
0.98 (0.88;1.09)
Self-perception of healthd
0.002b
Excellent/very good
730
Good
Fair/poor
0.026b
35.0
1.26 (1.08;1.46)
1.18 (1.02;1.37)
1327
33.2
1.19 (1.04;1.37)
1.11 (0.97;1.27)
897
27.8
1
Donation campaigns
1
0.549
a
0.723a
Never seen/heard
117
27.6
1
1
Seen/heard a few
553
32.8
1.19 (0.87;1.62)
1.09 (0.83;1.43)
Seen/heard a lot
2284
32.0
1.16 (0.87;1.56)
1.03 (0.80;1.34)
2953
32.0
-
Total
p
<0.001a
-
-
-
a
Heterogeneity test (Wald)
b
Trend test
c
Adjusted for sex, age and marital status
d
Adjusted for sex, age, marital status and economic level
Agência Nacional de Vigilância Sanitária. Pesquisa revela perfil de doadores e não-doadores de sangue, 2006 [cited 2007 Sep 16]. Available
from: http://www.anvisa.gov.br/divulga/noticias/2006/110106_1.htm
a
en_12.indd 4
28/1/2010 16:19:53
5
Rev Saúde Pública 2010;44(1)
Table 2. Prevalence, gross and adjusted prevalence ratios and factors associated with blood donation in the previous year.
Municipality of Pelotas, Southern Brazil, 2007.
Variable
n
Donation
prevalence (%)
Gross analysis
PR (95% CI)
Adjusted analysis
p
PR (95% CI)
<0.001a
Sex
Male
1137
11.8
2.60 (1.97;3.44)
Female
1448
4.5
1
Skin color
2.53 (1.93;3.33)
1
0.686
a
0.574a
White
1896
7.9
1.19 (0.75;1.91)
1.17 (0.73;1.87)
Mixed
137
6.8
1.02 (0.49;2.10)
0.89 (0.44;1.82)
Black
348
6.7
1
Marital status
1
0.228
a
0.190a
No partner
1149
6.9
1
1
Has partner
1805
8.2
1.18 (0.90;1.56)
1.20 (0.91;1.58)
0.001b
Age (years)
<0.001b
20-29
711
9.3
2.16 (1.40;3.33)
2.20 (1.42;3.42)
30-49
1143
8.9
2.07 (1.47;2.93)
2.02 (1.43;2.87)
50-65
744
4.3
1
Schooling (years)
0-4
1
0.014
b
0.229b
527
5.2
1
1
5-8
933
7.4
1.40 (0.89;2.22)
1.18 (0.73;1.89)
≥9
1495
8.6
1.64 (1.10;2.46)
Economic level
c
1.31 (0.83;2.05)
b
0.030b
0.049
A/B
1093
8.4
1.82 (1.07;3.08)
1.83 (1.11;3.02)
C
1362
8.0
1.74 (1.04;2.92)
1.68 (1.01;2.79)
D/E
471
4.6
1
Religion
1
0.661
No
642
8.1
1
Yes
2312
7.6
0.93 (0.67;1.29)
a
0.664a
1
1.07 (0.78;1.48)
0.174a
Donor relative
0.237a
No
880
6.6
1
1
Yes
1996
8.1
1.23 (0.91;1.67)
1.20 (0.89;1.63)
Self-perception of healthd
<0.001b
<0.001b
Excellent/very good
730
12.7
3.11 (2.10;4.62)
2.37 (1.55;3.62)
Good
1327
6.9
1.70 (1.12;2.58)
1.35 (0.88;2.10)
Fair/poor
897
4.1
1
Donation campaigns
1
0.391
a
0.266b
Never seen/heard
117
5.8
1
1
Seen/heard a few
553
9.1
1.57 (0.60;4.12)
1.12 (0.47;2.64)
2284
7.4
1.28 (0.51;3.22)
2598
7.7
-
Seen/heard a lot
Total
p
<0.001a
0.93 (0.41;2.10)
-
-
-
a
Heterogeneity test (Wald)
Trend test
c
Adjusted for sex, age and marital status
d
Adjusted for sex, age, marital status and economic level
b
level) proved not to be significantly associated with
loyal donation. The association of self-perception of
health was similar to that found for blood donation in
en_12.indd 5
the previous year and having ever donated blood, and
also with a linear trend relative to the reference category
(self-perception of health as fair or poor). Knowledge
28/1/2010 16:19:53
6
Blood donation prevalence
Zago A et al
Table 3. Prevalence, gross and adjusted prevalence ratios and factors associated with loyal blood donation. Municipality of
Pelotas, Southern Brazil, 2007.
Variable
n
Loyal donation
prevalence
(%)
Gross analysis
PR (95% CI)
Adjusted analysis
p
PR (95% CI)
<0.001a
Sex
Male
1137
6.1
3.68 (2.42;5.60)
Female
1448
1.6
1
Skin color
1896
<0.001a
3.65 (2.40;5.53)
1
0.898
White
a
0.851a
3.7
1.15 (0.61;2.17)
1.12 (0.59;2.10)
Mixed
137
3.4
1.06 (0.36;3.13)
0.89 (0.31;2.55)
Black
348
3.2
1
1
0.133a
Marital status
No partner
1149
2.8
1
Has partner
1805
4.0
1.43 (0.90;2.27)
Age (years)
0.337a
1
1.25 (0.79;1.99)
0.007
a
0.008a
20-29
711
3.2
1.50 (0.81;2.80)
1.42 (0.76;2.66)
30-49
1143
4.7
2.20 (1.32;3.67)
2.12 (1.27;3.53)
50-65
744
2.2
1
Schooling (years)
1
0.233
a
0.425b
0-4
527
2.1
1
1
5-8
933
3.8
1.81 (0.88;3.73)
1.57 (0.73;3.37)
1495
3.9
1.84 (0.89;3.80)
≥9
Economic level
c
1093
C
D/E
a
0.104b
4.1
2.00 (0.85;4.67)
1.98 (0.86;4.56)
1362
3.6
1.74 (0.78;3.88)
1.70 (0.76;3.79)
471
2.1
1
1
Religiond
0.250a
No
Yes
Donor relative
1.55 (0.66;3.63)
0.281
A/B
642
2.8
1
2312
3.8
1.35 (0.81;2.56)
d
0.075a
1
1.56 (0.95;2.56)
0.118
a
0.121a
No
880
2.7
1
1
Yes
1996
3.9
1.45 (0.91;2.31)
1.46 (0.90;2.36)
Self-perception of healthd
0.001b
Excellent/very good
730
Good
Fair/poor
0.030b
5.0
2.89 (1.55;5.40)
2.10 (1.07;4.11)
1327
3.8
2.17 (1.18;4.00)
1.63 (0.88;3.00)
897
1.7
1
1
0.530a
Donation campaigns
0.093b
Never seen/heard
117
4.4
1
1
Seen/heard a few
553
4.5
1.03 (0.31;3.38)
0.85 (0.28;2.58)
2284
3.4
0.77 (0.25;2.35)
2598
3.6
-
Seen/heard a lot
Total
p
0.60 (0.22;1.65)
-
-
-
a
Heterogeneity test (Wald)
Trend test
c
Adjusted for sex, age and marital status
d
Adjusted for sex, age, marital status and economic level
b
en_12.indd 6
28/1/2010 16:19:53
7
Rev Saúde Pública 2010;44(1)
of blood donation campaigns, religion and knowledge
of someone close who had already donated blood were
not associated with loyal donation (Table 3).
DISCUSSION
A limitation in this study, frequently observed in crosssectional studies, refers to recall bias. However, as the
associated factors gave similar results for having ever
donated blood and in the year prior to the interview,
we consider that recall bias may not have affected
the results.
Another factor to be considered is the exclusion of the
interviews of people aged 18 and 19. Although those
aged 18 and over are able to donate blood, the study
Profile of the Brazilian Blood Donora did not show
higher prevalence of outcomes related to blood donation
in this age group. Although this is a limitation of the
study, such bias probably did not occur.
The prevalence of having ever donated blood was 32%,
which is similar to the prevalence of 38% observed in
the city of Yazd, Iran, among randomly selected adults
aged between 20 and 60.6 Zaller et al,14 in a study with
a sample of 1,280 individuals in Urumqi, China, found
that 27.6% had already donated blood. The prevalence
reported in other studies were smaller.1,4,5,11 The prevalences of blood donation in the previous year of 7.7% is
relatively high if we consider that a smaller prevalence
was found for Brazil as a whole and in comparison with
studies in the United States, which found a prevalence
between 4% and 6%.3
In international literature, the prevalence of blood
donation in the previous year showed more variation,
ranging from 4% to 11%.3,4 These variations might
be explained by the cultural and socioeconomic differences between countries.
As for loyal blood donation, the only cross-sectional
study that analyzed this aspect, despite using a different methodology from this study, was carried out
with students from the University of Maastricht,
Netherlands, and found a 7% loyal donor rate, which
was higher than in our study (3.6%).8
Regarding the factors associated, blood donation was
higher among male donors in the three evaluations, thus
corroborating the literature,3,10,12 as well as the positive
association with higher economic and educational
levels.2,3,14 Such variables were probably not associated
with loyal donation due to their low prevalence, which
may have compromised the strength of the analyses.
However, the size of the effect encountered was greater
than that observed for having ever donated and blood
donation in the previous year.
The association with age proved to be very different in
the three types of outcome considered. The oldest age
group (50-65) had the greatest prevalence of having
ever donated blood. On the other hand, the prevalence
in the previous year was higher in the youngest group,
reducing with age. The intermediary age group (30-49)
was the one that was most associated with loyal donation. In the study Profile of the Brazilian Blood Donor,
conducted in blood banks throughout the country, having
ever donated blood was more prevalent in the youngest
age group.a Also in the study by Godwin et al,4 it was
greater for the 50-70 age group. In other two studies
which analyzed the association with age, having ever
donated blood was more frequent among people in the
intermediary age group (26 to 55).10
The associations with age found in our study were
expected given that people in the oldest age group
had had more opportunities for donating blood in their
lifetime. Loyal donation was prevalent in the intermediary age group. Younger individuals have perhaps not
acquired an awareness of and/or sufficient maturity
for recognizing the importance of regular donations,
although they are healthier and probably better informed.
This behavior may be changing, once higher frequency
of donation in the previous year was observed.
As expected, self-perception of health as being excellent/very good proved to be strongly associated with
blood donation because people who perceive they are
healthy feel more suitable for donating blood and are
also less excluded in the triage, when the candidate is
questioned about his health characteristics. This was
also observed by Godin et al.4 This association remained
after adjustment for the socioeconomic level, which
could be a possible confounder (people from a higher
socioeconomic level would have better self-perception
of their health and donate more blood).
With regard to blood donation campaigns, in our study,
more than two thirds of the interviewees reported having
seen or heard about many blood donation campaigns.
Nevertheless, this fact did not seem to have a positive
influence on blood donation, suggesting the need for
improving blood donation campaigns so that they really
motivate people to become donors. The fact that a
great number of people reported having seen or heard
about many campaigns on the topic may be due to the
fact that the interviews were conducted in November
when there is more publicity about blood donation in
the media, because 25th November is National Blood
Donor Day.
The objectives of the Ministry of Health’s National
Blood Donor Program in 2003a were to reach a prevalence of 2% of blood donation in the population per
year, increasing the percentage of female donors to
Ministério da Saúde. Saúde incentiva doações de sangue. [cited 2007 Sep 15] Available from: http://portal.saude.gov.br/portal/saude/
visualizar_texto.cfm?idtxt=25472
a
en_12.indd 7
28/1/2010 16:19:53
8
30% and also raising the number of donations from
young people (18 to 29 age group). This study found a
donation prevalence of 7.7% in the previous year, 33%
of the donors were women and 33% of the donors were
also in the 20 to 29 age group. Therefore, in Pelotas, the
objectives of the program were achieved. However, the
demand for blood and blood components is still greater
than donations. The fact that Pelotas is a reference for
many smaller towns in the region for treatments, such
as in the area of cancerology, may explain the bigger
demand, despite its adequate donation prevalence,
according to WHO criteria. Perhaps for centers like this
it is necessary to reassess the real need for donors in the
population in order to maintain adequate stocks of blood
and derivatives, which would provide data for improving the quality and effectiveness of the campaigns.
This study, based on a consultation of Brazilian scientific literature, is the first population-based investigation
Blood donation prevalence
Zago A et al
on the topic in Brazil and can serve as the basis for
future comparisons in order to evaluate the impact
of the measures for increasing the number of donors,
particularly loyal donors whose characteristics and
blood types are known.
In conclusion, the study identified the groups of people
more inclined to donate blood voluntarily and also those
who are the least susceptible to this type of behavior.
Many people do not give blood for fear of becoming
anemic and because they do not know the interval of
time between donations and the maximum number of
donations allowed. This indicates a substantial need
for clarification and specific incentives for making
people loyal donors.9 As blood donation is an attitude
that demands taking individual initiative, populationbased studies should investigate the reasons that lead
people to donate blood and those that prevent people
from having this initiative.
REFEReNCeS
1. Androulaki Z, Merkouris A, Tsouras C, Androulakis
M. Knowledge and attitude towards voluntary blood
donation among a sample of students in TEI of Crete,
Greece. Nurs Web J. 2005(23):1-9.
2. Bettinghaus EP, Milkovich MB. Donors and nondonors:
communication and information. Transfusion.
1975;15(2):165-9.
3. Gillespie TW, Hillyer C. Blood donors and factors
impacting the blood donation decision. Transfus
Med Rev. 2002;16(2):115-30. DOI:10.1053/
tmrv.2002.31461
4. Godin G, Sheeran P, Conner M, Germain M, Blondeau
D, Gagné C, et al. Factors explaining the intention
to give blood among the general population. Vox
Sang. 2005;89(3):140-9. DOI:10.1111/j.14230410.2005.00674.x
5. Hosain GM, Anisuzzaman M, Begum A. Knowledge
and attitude towards voluntary blood donation among
Dhaka University students in Bangladesh. East Afr Med
J. 1997;74(9):549-53.
6. Javadzadeh Shahshahani H, Yavari MT, Attar M,
Ahmadiyeh MH. Knowledge, attitude and practice
study about blood donation in the urban population
of Yazd, Iran, 2004. Transfus Med. 2006;16(6):403-9.
DOI:10.1111/j.1365-3148.2006.00699.x
7. Kirkwood B. Essential Medical Statistics. 2.ed.
Blackwell Science Publication; 2003.
8. Lemmens KP, Abraham C, Hoekstra T, Ruiter RA,
De Kort WL, Brug J, et al. Why don’t young people
volunteer to give blood? An investigation of the
correlates of donation intentions among young
nondonors. Transfusion. 2005;45(6):945-55.
DOI:10.1111/j.1537-2995.2005.04379.x
9. Mathew SM, King MR, Glynn SA, Dietz SK, Caswell
SL, Schreiber GB. Opinions about donating blood
among those who never gave and those who stopped:
a focus group assessment. Transfusion. 2007;47(4):72935. DOI:10.1111/j.1537-2995.2007.01177.x
10. Misje AH, Bosnes V, Gåsdal O, Heier HE.
Motivation, recruitment and retention of voluntary
non-remunerated blood donors: a survey-based
questionnaire study. Vox Sang. 2005;89(4):236-44.
DOI:10.1111/j.1423-0410.2005.00706.x
11. Sampath S, Ramsaran V, Parasram S, Mohammed
S, Latchman S, Khunja R, et al. Attitudes towards
blood donation in Trinidad and Tobago. Transfus
Med. 2007;17(2):83-7. DOI:10.1111/j.13653148.2007.00731.x
12. Silva H, Nunes C, Nachtigal G, Passos S, Primo L,
Brum M, et al. Perfil dos doadores de sangue do
Hemocentro Regional de Pelotas (RS). Rev Bras
Hematol Hemoter. 2005;27(Supl 2):271.
13. Victora CG, Huttly SR, Fuchs SC, Olinto MT. The
role of conceptual frameworks in epidemiological
analysis: a hierarchical approach. Int J Epidemiol.
1997;26(1):224-7. DOI:10.1093/ije/26.1.224
14. Zaller N, Nelson KE, Ness P, Wen G, Bai X, Shan H.
Knowledge, attitude and practice survey regarding
blood donation in a Northwestern Chinese city.
Transfus Med. 2005;15(4):277-86. DOI:10.1111/
j.0958-7578.2005.00589.x
Article based on the master’s dissertation of Zago A, presented to the Programa de Pós-Graduação em Epidemiologia of the
Universidade Federal de Pelotas (UFPel), in 2008.
en_12.indd 8
28/1/2010 16:19:53
Download