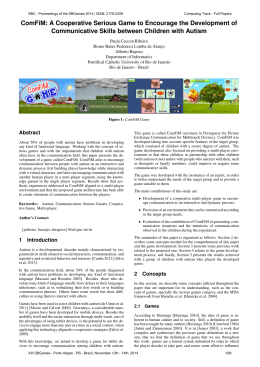
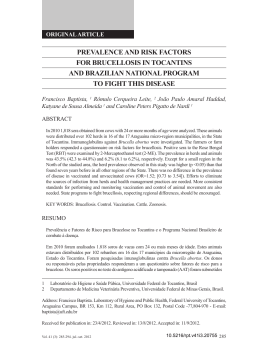
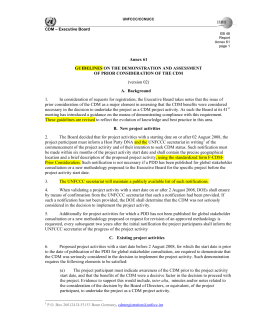
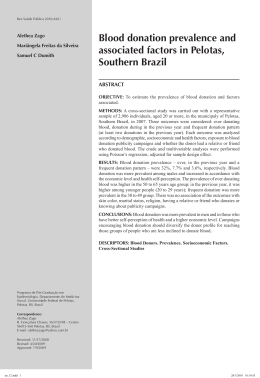
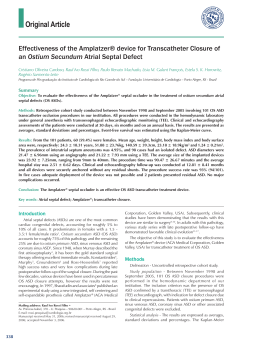
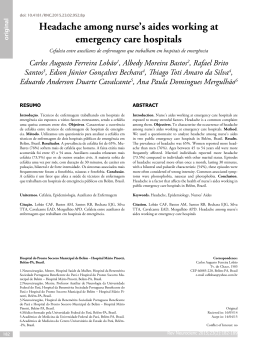
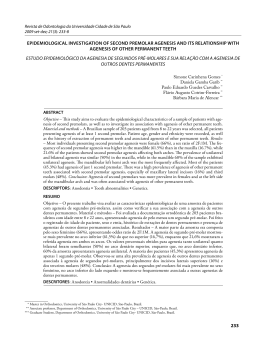
The epidemiology of Autism and PDDs
1st Brazilian Meeting for Autism Research
EBPA 10
Porto Alegre
April 22-24 2010
Pr. Eric Fombonne
McGill University
Outline
• Recent prevalence surveys
• Best current estimate for ASDs
• World wide efforts on ASD epidemiology
• Time trends: is there an epidemic?
75
65
Prevalence of autism in 34 surveys
55
45
35
25
15
5
25
1965
-5
22 .5
1970
1975
19
Rate / 10,000
20
17 .5
27
10
15
11
12 .5
26
13
18
10
24
12
16
7 .5
21
6
5
1
2
9
7
2 .5
0
1965
14
4
5
3
1975
17
20
15
8
1985
Year of Publication
1995
23
1980
1985
1990
1995
2000
Great
Britain
Stafford
London
Staffordshire surveys
92-95
cohort
96-98
cohort
Combined samples
N=15,500
N=10,903
N=26,403
N
P
N
P
N
Autistic disorder
26
16.8
24
22.0
50
18.9 14.1-25.0
PDD NOS
56
36.1
27
24.8
83
31.4 25.0-39.0
Asperger
13
8.4
12
11.0
25
9.5
6.1-14.0
1
0.7
1
0.9
2
0.8
0.1-2.7
961 61.9
64
58.7
CDD
All PDDs
1:
One girl with Rett syndrome has been excluded
P
95% CI
160 60.6 51.6-70.7
Chakrabarti & Fombonne (2005)
New Montreal survey
• Sample
– English Montreal School Board (EMSB) for
Anglophone children
– 71 schools; 23,635 pupils from K to grade 11
– Children with PDD identified through special
education code (ASD) that provides extra funding to
the school
– 187 children with PDD identified on April 1st 2008
Lazoff, Fombonne et al., 2010 (submitted)
New Montreal survey
Male
Female
Total
N
N
N
Prevalence /10,000
(95% confidence
interval)
PDD -NOS
88
15
103
43.6 (35.2 – 52.0)
Autistic
Disorder
50
10
60
25.4 (19.0 - 31.8)
Asperger
19
4
23
9.7 (5.8 – 13.7)
CDD
1
0
1
0.4 (0.0 – 1.3)
Total
158
29
187
79.1 (67.8 - 90.4)
Lazoff, Fombonne et al. 2010 (submitted)
New Montreal survey:
trends in birth cohorts 1991-2002
Outline
• Recent prevalence surveys
• Best current estimate for ASDs
• World wide efforts on ASD epidemiology
• Time trends: is there an epidemic?
Recent review of surveys
• 63 published surveys
•
•
•
•
•
•
50 on AD, 14 on ASP, 12 on CDD, 26 on PDD
half published since 2001
AD:
2.2/1,000
ASP:
1/1,000
CDD:
2/100,000
PDD: ~ 7/1,000
• Some studies have PDD rates over 1%
•
•
•
•
•
1.1% in NJ- USA (CDC, 2007)
1.3% in Arizona (CDC, 2009)
1.2% in the UK (Baird et al. 2006)
1.3% in some birth cohorts (Fombonne et al., 2010)
1.8% in Japan (Kawamura et al. 2008)
Fombonne et al 2010 (in press)
Equivalences
70/10,000 =
7/1,000 =
0.7% =
1 child in 140
Brazil estimates for PDDs (2000)
Age groups
0- 4
Urbana
Population
N
expected
Rural
Population
N
expected
Brasil
Population
N
expected
5-9
10 - 14
15 - 19
Under 20
12,749,346
12,787,933
13,509,943
14,401,006
53,448,228
89,245
89,516
94,570
100,807
374,138
3,636,893
3,788,326
3,843,740
3,548,282
14,817,241
25,458
26,518
26,906
24,838
103,720
16,386,239
16,576,279
17,353,683
17,949,289
68,265,490
114,704
116,034
121,476
125,645
477,858
Based on Tabela 1.1.1 - População residente, por sexo e situação do
domicílio,segundo os grupos de idade – Brasil and a prevalence estimate of 0.7%
Outline
• Recent prevalence surveys
• Best current estimate for ASDs
• World wide efforts on ASD epidemiology
• Time trends: is there an epidemic?
Korean Autism Study (KAS)
Research Design
•
Total Population
Study
No sampling
•
Mechanisms to
Identify Children
1.
2.
3.
•
Mandatory
Educational System
Home Schooling
Disability Registry
Two Stage Design
1.
2.
Multi-Informant
Screening
Confirmative Dx with
ADOS & ADI-R
School Visit and Screening: East District
Cultural differences:
Autism
versus
Reactive attachment
disorder ?
Value of an epidemiological survey
• Get an estimate of the magnitude of the health problem
• Get a baseline useful to monitor time trends
• Provide information to decision-makers re. service needs and
planning
• Provide data on risk factors/correlates
• Evaluate access to services and factors that influence it
• Generate a representative case series from which to sample for
further studies (ie case-control, outcome studies, etc…)
• Generate data on trajectories of ASD subjects in the local
health/welfare system
• Develop up-to-date screening and evaluation techniques
• Increase awareness, involve professionals, develop expertise
Outline
• Recent prevalence surveys
• Best current estimate for ASDs
• World wide efforts on ASD epidemiology
• Time trends: is there an epidemic?
Time trends in autism
• Problems :
–prevalence versus incidence rates
–changes in case definition / case finding
–secular changes in age at diagnosis
–statistical power issues
It happened in the 1990’s...
Minnesota, USA – Gurney et al., 2003
Japan – Honda et al, 2005
Denmark – Madsen et al., 2003
United Kingdom – Taylor et al, 1999
Approaches used to evaluate
time trends in autism
– referral statistics
– comparison of prevalence surveys over time
– repeat surveys in defined areas
– trends in rates in consecutive birth cohorts
– incidence studies
Prevalence and access to services
Population
Population
Services
Services
Same prevalence
Low access to services
High access to services
Trends in Minnesota
Individual with Disabilities
Educational Act (IDEA)
DSM-III-R
Gurney et al., 2003
ICD-10
DSM-IV
1991-92 birth
cohort as it ages
“age”
effect
Gurney et al., 2003
Prevalence of autism and MR
of unknown cause in California
King & Berman’s replication (Int J
Epi, in press):
25% of DDS caseload of Autism is
due to shift from MR to ASD
Croen et al., 2001
Diagnostic ‘substitution’:
from Language disorders to Autism
•
•
38 subject (31 M,
7F), diagnosed with
developmental
language disorder
(20 PLI, 18 SLI)
re-evaluated as
adults (age 15 to
31) with autism
specific instruments
(ADI-R and
ADOS-G)
Bishop et al. 2008
SLI
N=18
PLI
N=20
ALL
N=38
Autistic disorder
on both ADI and
ADOS
0
-
8
(40%)
8
(21%)
PDD on both ADI
and ADOS
2
(11%)
11
(55%)
13
(34%)
PDD on either
ADI or ADOS
6
(33%)
19
(95%)
25
(66%)
Approaches used to evaluate
time trends in autism
– referral statistics
– comparison of prevalence surveys over time
– repeat surveys in defined areas
– trends in rates in consecutive birth cohorts
– incidence studies
Relative rates of AD and PDD NOS
Study
Definition for other PDD
AD
“PDD NOS”
Ratio
Lotter (1966)
behaviour similar to
autistic children
4.1
3.3
0.8
Brask (1970)
‘other psychoses’ or
‘borderline psychotic’
4.3
1.9
0.4
Wing et al (1976)
socially impaired
4.9
16.3
3.3
autistic mental
retardation
2.3
2.9
1.3
Burd et al (1987)
‘autistic-like’
3.3
> 7.8
2.4
Cialdella &
Marmelle (1989)
other forms of
‘infantile psychosis’
4.5
4.7
1.0
(triad of impairments)
Hoshino et al
(1982)
Impact of diagnostic criteria on rate estimation:
example of the Northern Finland survey
Age
N
Population
Criteria
Rate
/10,000
15 – 18
9
39,216
Kanner
2.3
15 – 18
28
39,216
Autism
ICD-10/DSM-IV
6.1
15 – 18
30
39,216
Autism Spectrum
ICD-10
7.6
Kielinen et al., 2000
Study design impact on prevalence
Example of 4 recent UK surveys
location
Baird et al.
2000
Chakrabarti &
Fombonne
2001
size age
South.East 16,235
Thames
group
7
method
PDD rate
/10,000
Early screening 57.9
+ FU identification
Stafford
-shire
15,500
2½ - 6½
intense screening
+ assessment
62.6
Fombonne
et al. 2001
England
& Wales
10,438
5 - 15
household survey
26.1
Taylor et al.
1999
North
Thames
490,000
0 - 16
administrative
records
Six-fold variation in estimates
10.1
Stafford Surveys
60
Rate
40
92-95
96-98
/10,000
20
0
AD
ASP
PDDNOS
All PDDs
Chakrabarti and Fombonne, 2005
Prevalence rates by birth cohorts (1972-1985) in two
surveys
12
1985-90 surveys
Prevalence rate / 10,000
1992-93 survey
10
8
6
4
2
0
71 72 73 74 75 76 77 78 79 80 81 82 83 84 85
Fombonne et al. 1997
Birth cohort
Incidence of PDD in GPRD – UK 1988 – 2001
Incidence
other
PDDs
Incidence
Autism
2.0
1.92
1.2
1.6
1.0
1.06
1.2
0.8
0.8
0.6
0.34
0.4
0.68
0.4
0.11
0
0.2
0
0
1988
Smeeth, Fombonne et al., 2004
0
1992
0.06
1996
2001
Time trends : conclusions
• Most epidemiological studies are not informative to gauge
trends over time
• There is evidence that methodological factors account for a
substantial part of the observed increase in prevalence
• Prevalence rates have gone up but this trend cannot be
interpreted as evidence of a secular increase in the incidence
• The hypothesis of an increased incidence is not ruled out,
but it remains to be tested with adequate epidemiological data
Take home messages...
• ASDs are amongst the most frequent child
neurodevelopmental disorders
• Increasing numbers/prevalence occurred
with changes in diagnostic criteria and
awareness
• Surveillance should be developed in order
to detect future changes in the incidence
Download