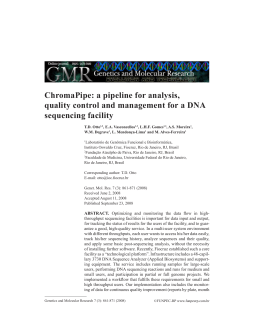
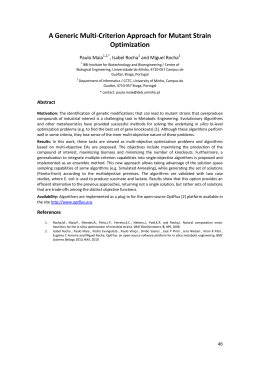
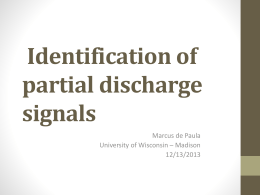
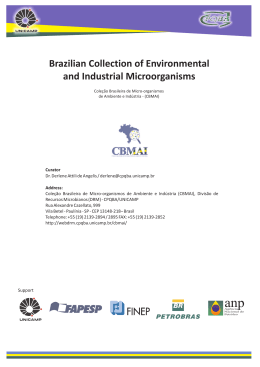
Rem: Revista Escola de Minas
ISSN: 0370-4467
[email protected]
Escola de Minas
Brasil
Candido, Mateus Toniolo; Peroni, Rodrigo de Lemos; Hilário, Daniel
Impact in long-term planning of optimization algorithms and mineral deposit geometry
Rem: Revista Escola de Minas, vol. 66, núm. 1, enero-marzo, 2013, pp. 105-110
Escola de Minas
Ouro Preto, Brasil
Available in: http://www.redalyc.org/articulo.oa?id=56425762014
How to cite
Complete issue
More information about this article
Journal's homepage in redalyc.org
Scientific Information System
Network of Scientific Journals from Latin America, the Caribbean, Spain and Portugal
Non-profit academic project, developed under the open access initiative
Mateus Toniolo Candido et al.
Mineração
Mining
Impact in long-term planning
of optimization algorithms and
mineral deposit geometry
Impacto de diferentes algoritmos
e geometria de depósitos minerais
no planejamento de longo prazo
Mateus Toniolo Candido
Mining Engineer,
Federal University of Rio Grande do Sul - UFRGS.
[email protected]
Rodrigo de Lemos Peroni
Prof. Dr.,
Federal University of Rio Grande do Sul - UFRGS.
[email protected]
Daniel Hilário
Mining Engineer,
Federal University of Rio Grande do Sul - UFRGS.
[email protected]
Resumo
O principal objetivo do planejamento mineiro é determinar a distribuição
de quantidade e qualidade do minério ao longo de uma sequência de tempo, ou
seja, minério necessário para tornar o projeto técnica e economicamente viável.
Esse sequenciamento é fundamental para o sucesso financeiro de uma atividade
de mineração e, atualmente, esse sequenciamento ideal pode ser obtido através
de vários aplicativos computacionais de mineração. A maioria dos estudos em
planejamento de lavra apresenta a cava final calculada por um único algoritmo
escolhido pelo engenheiro de projeto ou, simplesmente, por disponibilidade.
Além disso, variações nos aspectos técnicos e geométricos do projeto podem
ser impostas provocando diferenças nos resultados. Existem muitos algoritmos
implementados em diversos programas comerciais para o cálculo da cava final
e sequenciamento de longo prazo, e, por isso, um dos objetivos desse trabalho é
verificar a eficácia dos algoritmos que obtiveram maior reconhecimento dentro
da indústria mineral e verificar se existem diferenças relacionadas com o tipo
de mineralização e depósito onde eles são aplicados. A comparação é realizada
usando dois programas comerciais e dois algoritmos diferentes para determinar
se as diferenças podem ser observadas para tipos de mineralização distintos. A
aplicação da metodologia foi executada em modelos de blocos tridimensionais
estimados e os resultados analisados para os três tipos de depósitos: um corpo de
minério de cobre disseminado, um grande depósito de fosfato de origem ígnea e
uma mineralização aurífera, de espessura pequena relativamente à extensão em
profundidade, apresentando um mergulho subvertical.
Palavras-chave: Planejamento de lavra, algoritmos de otimização, longo prazo.
Abstract
The main objective of mine planning is to determine ore quantity and quality
distribution along a time sequence, i.e., scheduling the ore necessary to make the
project technically and economically feasible. These temporal sequences are
fundamental for the financial success of a mining activity and currently this optimal
sequence can be obtained through various mining software. Most studies in mine
planning present the final pit calculated by only one algorithm chosen by the mining
REM: R. Esc. Minas, Ouro Preto, 66(1), 105-110, jan. mar. | 2013
105
Impact in long-term planning of optimization algorithms and mineral deposit geometry
engineer or simply by availability. Besides, technical constraints and geometrical
aspects can be imposed promoting differences on the results of the project. There
are many algorithms implemented in various commercial software for the ultimate
pit calculation. One of the purposes of this work is to check the effectiveness of
the algorithms that obtained greater recognition within the mineral industry and
if there are differences related to the type of mineralization and deposit where
they are applied. The comparison is performed using two commercial software,
and two different algorithms to determine if differences can be observed from the
different mineralization types. The implementation of the two algorithms in threedimensional block models estimated and analyzed for three types of deposits:
a massive disseminated copper orebody, a large igneous phosphate deposit and a
subvertical gold vein type.
Keywords: Mine planning, optimization algorithms, long term.
1. Introduction
The optimization in open pit mines
is an important element to successfully
achieve the realization of the project. The
pit that provides the best profitability is
made by optimization algorithms, considering a specific economic scenario and,
at each change of this scenario it becomes
obsolete and should be re-examined
(David et al., 1974; Dagdelen, 2001;
Halatchev, 2002). The method widely
used to represent mineral deposits is the
individualization in portions of the deposit
in a Cartesian representation called block
model. This model is essential for the pit
optimization process and stores technical
and economical parameters to determine
the economic value of each block that will
be analyzed by optimization algorithms.
Over this model will be calculated the
profit function so that one can quickly
have their parameters changed for sensi-
tivity studies.
In this work were used two algorithms with the implementations of the
Lerchs-Grossmann (LG) algorithm (Lerchs-Grossmann, 1965), a dual simplex algorithm that examines the maximum closure problem and minimum cut amount
that seeks the optimal solution possible
(Tolwinski, B. and R. Underwood (1992),
Underwood, R. and B. Tolwinski (1996)
Underwood, R. and B. Tolwinski, 1998).
Its relationship to maximum flow is quite
obvious (Do Carmo, 2001) and Floating Cones (FC) (Pana, 1965); a method
based on optimal contour search final pit
attempts. The principle of the algorithm
considers the physical constraints and
local geological restrictions (Guimarães,
2007). The two techniques were applied
in three separate ore deposits to assess the
performance in reproducing the results for
different deposits, evaluating the processing time to calculate the mathematical pit
and in a second step to sequence different
deposits according different constraints.
The main differences observed in
the construction of final pit were: variation in grade of pit, total quantity of ore
and waste, computation time. Mining
sequencing was set to control certain
parameters in each phase (either ore or
contaminants). There were observed
amount of ore and waste by phase, differences in mining sequence, stripping ratio,
processing time and level of user control
and interaction.
In this sense, the purpose of this
study is to submit the three databases
representing deposits with different geometries to two algorithms extensively
used in the mining industry and analyze
comparatively the results produced.
The second model refers to a relatively small gold deposit comprised of an high
dip ore body of with average gold grades
of approximately 1 g/t, due to selectivity
and dilution, the block size adopted for
this deposit was relatively small, using a
dimension to the ore zone of 5 x 5 x 5 m
and for the waste zone the block size used
was 25x25x5 m.
The third deposit studied consists
of a large phosphate deposit, an
igneous alkaline complex divided into
weathering zones, containing a set of
oxides where the quality of the primary
attribute is measured by the apatite
content (P2O5). The average grade of
the deposit is about 10% of apatitic
phosphate (P2O5AP).
to compare the commercial programs
itself but the optimization algorithms
and its implementations and the form of
sequencing, the programs will be referred
here only as softwares A and B.
In program A, it is available only
one optimization technique: the dynamic programming algorithm using
Lerchs-Grossmann (LG). In Program
B are available the Lerchs-Grossmann
2. Material and methods
Description of mineral deposits
The first model consists of a large
copper and molybdenum disseminated
deposit. The data were obtained by drill
hole samples within a file containing
location in three dimensions, hole depth,
slope and azimuth and another file grade
containing copper and molybdenum
assays, rock type and density of each
sample.
Methodology
In the first step, the models were
imported into the two mining softwares,
containing different optimization tools,
referred in this work as softwares A
and B. As the goal of the work is not
106
REM: R. Esc. Minas, Ouro Preto, 66(1), 105-110, jan. mar. | 2013
Mateus Toniolo Candido et al.
and Floating Cones (FC) algorithms.
An attempt was made to use exactly
the same parameters in both programs
which have different interfaces and
complexities to input data, to maintain
comparability in the results.
Despite the interface, the two programs present differences in format and
data insertion order, although one realized
that the two programs require similar
parameters to run the algorithm.
In this way, knowing whether the
block is mined, or in other words, if a
block is contained in the proposed solution by optimization algorithm is of
extreme importance (answer given by
the optimization algorithm). But knowing when this block will be mined and
later when this block will be sent to the
process is even more relevant information, because this order defines the project’s cash flow (Whittle, 1988).. Thus,
the pits resulting from optimization for
each deposit studied are divided into
stages which will be used as precedence
information to sequence the blocks in
each software.
I n pro g r a m A , t h e m i n i n g
sequencing was executed in two steps,
at first, one obtained the phases of
sequencing by the program A itself, i.e.,
were selected the phases by maximizing
Net Present Value (NPV) criteria. In the
second step, were used the phases created
in program B, and inputted in program
A to compare the results.
In the first case, the phases were
obtained by selecting only a maximum
number of stages and defining the criteria of pit size and minimum number
of blocks. Thus, the phases generated
were chosen only by NPV maximization criterion, not being mandatory total
extraction from one phase to begin the
next phase.
In the second case, it was only
changed the phases. The phases generated in program B were exported and
imported into program A, after one
followed the same procedures for sequencing the first case obtaining also a
worksheet with the results that will be
analyzed later.
In Program B were generated
phases to sequence through a tool iterating calculation of intermediate pits to
until reaching the ultimate pit defining
adequate definition of operational advances, information necessary for the
sequencing tool.
Thus, one can select the pits for
phases extraction to sequence the production using program B. In this case
were analyzed, stripping ratio and quantity and quality of the ore, within phases
that were used as input parameters in the
program B sequencer.
The next step is to start the sequencing tool of program B, for the three
deposits. Thus, varying these parameters
one can get the optimal sequencing for
each type of deposit and ore.
between the optimization algorithms in
function of the geometry of this deposit.
Note that numerical results show, for
this deposit where the mineralization
is much more homogeneous and the
geometric relationship of area (large)
relative to the thickness (small) is quite
expressive.
For the gold deposit the particularity is not exactly related to the mineralization itself, but in the selectivity
required for this type of deposit. To
represent the model within the zone
of interest one needs small blocks
well adherent to the contact zone.
Operationally the way to handle this
problem ends up with the reduction of
the block size. In this case the block
model for this deposit has different
sizes of blocks for waste and ore. The
model in the region defined as ore has
dimensions of 5 x 5 x 5 m and waste
blocks have dimensions of 25 x 25 x
5 m. Because of the amount of blocks
that could be generated if blocks of 5 x
5 x 5 m were defined for all portions of
the deposit, generating a huge amount
of unnecessary blocks. An important
aspect about this model is that the
program B cannot handle (because
it does not operate with sub-blocks
feature) so different block dimensions
demanded the use of smaller blocks
of 5x5x5m and the economic value of
each block had to be recalculated using the same parameters assumed for
the profit function.
3. Results and discussions
Optimization
The results are shown in Table 1
indicate the differences between programs A and B using the two algorithms
represented by the parameters chosen by
the study, such as: tonnage, net present
value (NPV) and ore content.
In copper/molybdenum model
three pits were generated by the two
programs and one realized that the
results between the algorithms implemented using both programs produced
very similar results, even though can be
observed a small detachment between
the surfaces.
The optimum pit and the results
generated for the phosphate deposit are
quite similar for both programs and
algorithms tested. Compared to other
deposits tested, this better adherence
Cupper and molybdenum
Software
(Algorithm)
A
(LG)
Ore
B
(FC)
B
(LG)
B
(FC)
A
(LG)
265.606.594
267.749.719
253.118.000
550.997.262
522.575.000
525.230.000 High Grade 7.274.431
330.991.250
340.405.000 Waste (20) 265.362.303
260.701.000
266.638.000
Interm.
Waste (10) 330.109.350
325.733.000
332.445.000
Waste
Total (t)
599.794.875
598.740.969
Ore (30)
A
(LG)
Gold
Tonnes (t) Waste 334.188.281
NPV ($)
Table 1
Results of the pit optimization
in the three deposits.
B
(LG)
Phosphate
593.523.000
1.805.824.530 1.859.340.840 1.829.464.528
Cu
0,863
0,855
0,861
Mo
0,101
0,101
0,102
Ore (%)
P2O5AP
458.479
B
LG)
7.708.000
476.000
23.061.264 22.918.000
1.146.468.915 1.109.009.000 1.124.313.000
30.794.174 31.102.000
4.750.681.204 4.803.718.257 4.749.201.961
86.207.739 86.667.332
7,93
7,98
7,97
Au
1,05
1,06
REM: R. Esc. Minas, Ouro Preto, 66(1), 105-110, jan. mar. | 2013
107
Impact in long-term planning of optimization algorithms and mineral deposit geometry
Figure 1
Final pit (blue) for copper and
molybdenum deposit.
Sequencing
Copper and molybdenum
This sequencing has as main objectives a period of 20 years (that corresponds
to the deposit exhaustion), the production
of an amount of 13 million tons of ore per
year and maintaining a stripping ratio
approximately constant between 0.8:1
and 1.2:1.
First was analyzed using program
A sequencing tools, maximizing the
net present value. It was observed that
after the seventh year the stripping ratio
stabilizes in the target and maintains
an average of 1.26: 1:0 pm within
the whole period. The ore production
remained constant throughout the se-
restrictions of the program. The phases
defined for the sequencing did not reach
the desired ratio in several attempts, but
then through an interactive approach
repeating the steps until you reach the
appropriate sequencing targets.
In the last scenario the phases established in (B) were imported into the
program and then sequenced with the
same parameters. It was noted that the
ratio reaches the goals proposed in the
program A using the same phases used to
feed program B. It can be seen in Figure
2 the comparison between the results of
the two programs.
Comparison - Cu/Mo
2,5
Cooper Grade (%)
quencing as well as the grades of copper
and molybdenum.
In the next case discussed in program B, sequencing was generated using
five phases and the restrictions imposed
to the sequencer were the same as the
previous case. However, the sequencer
of program B is very strict regarding
the selection of the phases. In this case,
we can verify that the annual targets
regarding to quantity and grades of
copper ore and molybdenum were affected, however the stripping ratio became unstable, varying across the years.
This was attributed to the very tight
2
1,5
Cu (%) B
1
Cu (%) A
0,5
0
0
5
10
15
20
Year
Figure 2
Comparison between programs
A and B, deposit of Cu/Mo.
Phosphate
The sequencing for the phosphate
deposit was performed once again using the two programs used in this work.
Unlike the two other deposits compared
in this deposit it was not conducted the
third scenario, placing the phases of the
program B in the program A, because in
this case only two phases were generated
by program B.
This sequencing had as main objectives mining for 22 years (which corresponds to exhaustion of deposit), production of 25 million tons of ore per year and
a stripping ratio around 1:1.
Analysis of sequencing using the
program A and program B reach the restrictions applied to the case. We can see
in Figure 3 the comparison between the
two programs.
between 4:1 and 5:1. First it was analyzed
the sequencing using the program A, so in
this case one can observe that up to the
twelfth year the sequencer followed the
restrictions imposed between the limits of
stripping ratio, the quantities of ore in the
range of 380.000tons per year (tpy) and
Au grade around 1 g/t.
Gold
This sequencing has as main objectives mining for 16 years (until exhaustion
of the deposit), ore production of 380.000
tons per year and keep a stripping ratio
108
REM: R. Esc. Minas, Ouro Preto, 66(1), 105-110, jan. mar. | 2013
Mateus Toniolo Candido et al.
In the next case will be addressed
the steps using Program B, sequencing
generated four phases and the restrictions imposed to the sequencer were the
same as the previous case, sequencing
deposit until exhaustion, production of
380 thousand tpy and waste/ore ratio
between 4: 1 and 5: 1. In this case one
can verify that the annual quantity of
ore, 365 thousand tones, gold content
in 1 g/t and stripping ratio in the 4: 1 to
5: 1 have been reproduced.
In the last scenario the phases
established in (B) were imported in the
program A and then sequenced by the
program with the same parameters.
One can note that the amount of ore
is maintained in 380.000tons, but the
amount of waste and therefore the total mass movement, generating mining
for 19 years and a stripping ratio with
higher values. Figure 4 shows the comparison between the algorithms in the
two programs.
Comparison - Phosphate
3
2,5
SR
2
1,5
SR A
1
SR B
0,5
Figure 3
Comparison between programs
A and B, phosphate deposit.
0
0
5
15
10
20
Year
Comparison - Gold
Gold Grade (%)
2,5
2
1,5
Au (%) A
1
Au (%) B
0,5
Figure 4
Comparison between softwares
A and B, gold deposit.
0
0
5
15
10
20
Year
4. Conclusions
The main objective of this study is
to present a comparison between the programs and algorithms of pits optimization and sequencing implemented within
different mining programs. In this sense,
different deposits were used, having different natures and geometries to test the
applicability and the intricacies that exist
between the programs and consequently
between the algorithms itself.
Between the various comparisons
carried out with the programs and algorithms were not identified significant
differences to condemn or ostracize any
of the algorithms in function of advantages that both present. Still, as the
two algorithms have been used in three
distinct types of deposits and the results
have not shown significant differences,
it is considered the extent of validity
of application of both algorithms. In a
context of long-term planning, several
premises, assumptions and uncertainties are present. So that the order of
magnitude of differences found may be
treated as within this area of variation
allowed for a future scenario of exhaustion of a deposit. It is recommended
here that for an analysis that considers
a first approximation, the algorithm of
floating cones can represent an interesting alternative when the computation
time for processing a deposit with huge
number of blocks.
Altough this small difference observed when running the optimization
and sequencing in deposits of copper/
molybdenum and phosphate for the
long-term planning can be diluted without affecting the mining plan. However,
is important to stress that mining is an
activity that works with large amounts
of mass movement and small variations
in pit optimization could represent a
substantial amount of money.
About the sequencing, we found
that the program A is much more flexible
considering the definition of the phases,
always seeking the highest net present
value, while B is more rigid in relation
to the defined phases, being easier to
show the sequencing, but more complex
to consolidate the phases correctly, especially when certain parameters of goal
are defined as goal to be achieved. This
means that there is a greater demand on
the part of interaction from the planner
for an appropriate selection of stationary
targets within each phase for the longterm mine planning.
REM: R. Esc. Minas, Ouro Preto, 66(1), 105-110, jan. mar. | 2013
109
Impact in long-term planning of optimization algorithms and mineral deposit geometry
5. Acknowledgments
We would like to thank the postgraduating program (PPG3M) of Federal University of Rio Grande do Sul
(UFRGS). Teachers and colleagues of the
LPM (Mine planning are mineral research
laboratory) from DEMIN/UFRGS, for
6. References
DAGDALEN, K. Open pit optimization - strategies for improving economics of mining
projects through mine planning. In: INTERNATIONAL MINING CONGRESS
OF TURKEY, 17. Ankara: The Cahmber of Mining Engineers of Turkey, 2001.
DAVID, M., DOWD, P., KOROBOV, S. Forecasting departure from planning in
open pit design and grade control. APCOM, Golden, CO, 1974.
DO CARMO, F. A. R. Metodologia para planejamento de cavas finais a minas a céu
aberto otimizadas. Ouro Preto: Universidade Federal de Ouro Preto, Programa de
Pós-graduação em Engenharia Mineral, 2001. 135 p. (Dissertação de Mestrado).
FRANÇOIS-BONGARÇON, D., MARECHAL, A. A new method for open pit
design: parametrization of the final pit contour. In: APCOM SYMPOSIUM, 14.
Proceedings… Pennsylvania State University, 1976.
GUIMARÃES, O. R. DE A. Aplicação de algoritmos genéticos na determinação
de cava final e sequenciamento de lavra em minas a céu aberto. Universidade
Federal de Minas Gerais, Curso de Pós-Graduação em Engenharia Metalúrgica e
de Minas, 2007. 169 p. (Dissertação de Mestrado).
HALATCHEV, R. The time aspect of the optimum long-term open pit production
sequencing. In: APPLICATION OF COMPUTERS AND OPERATIONS
RESEARCH IN THE MINERAL INDUSTRY, 30. Littletown, SME, 2002.
HUSTRULID, W., KUCHTA, M. Open pit mine planning and design. Fundamentals.
Netherlands: A.A. Balkemu Rotterdas, 1995. 636p.
JOHNSON, T.B., SHARP, W. A three-dimensional dynamic programming method
for optimal pit design. US Bureau of Mines report on investigations, n. 7553, 1971.
KOROBOV, S. Method for determining optimal open pit limits. Ecole Polytechnique
Montreal, 1974.
LANE, K. The economic definition of ore. London: Mining Journal Books, 1988.
LECHS, H., GROSSMANN, I. F. Optimum design of open-pit mines. Transactions
C.I.M, v. LXVIII, p. 17-24, 1965.
NORONHA, R.A., GRIPP, A. H. Definição e seleção de projeto de cava final em
mineração de ferro. Brasil Mining Site, 2001. http://brasilminingsite.com.br.
PANA, M. The simulation approach to open pit design. In: APCOM SYMPOSIUM,
5. Proceedings… Arizona, p. zz1-zz24, 1965.
PERONI, R. DE L. Análise de sensibilidade do sequenciamento de lavra em função
da incerteza do modelo geológico. Universidade Federal do Rio Grande do Sul,
Programa de Pós-Graduação em Engenharia de Minas, Metalurgia e de Materiais
- PPGEM, 2002. 143 p. (Tese de Doutorado).
TOLWINSKI, B., R. UNDERWOOD. An algorithm to estimate the optimal evolution
of an open pit. 23rd APCOM. 1992.
UNDERWOOD, R., B. TOLWINSKI. The lerchs grossman algorithm from a dual
simplex viewpoint. 26th APCOM. 1996.
UNDERWOOD, R., B. TOLWINSKI. A mathematical programming viewpoint for
solving the ultimate pit problem. European Journal of Operational Research,
v.107, p. 96-107, 1998.
KIM, Y.G. Open pit limit analysis. SME-AIME, 1979. p. 297-303.
WHITTLE, J. Beyond optimisation in open pit design. CANADIAN CONFERENCE
ON COMPUTER APLICATIONS IN THE MINERAL INDUSTRIES, Balkema.
1988.
WRIGTH, E.A. Open pit mine design models. Federal Republic of Germany: Trans
Tech Publications, , 1990. 188 p.
ZHAO, Y., KIM Y.C. A new optimum pit limit design algorithm. 23rd APCOM,
Tucson, p. 423-432, 1992.
Artigo recebido em 17 de janeiro de 2012. Aprovado em 28 de novembro de 2012.
110
REM: R. Esc. Minas, Ouro Preto, 66(1), 105-110, jan. mar. | 2013
the support and infrastructure to develop
this study. And to CNPq, for the scholarship grant.
Download