FUNDAÇÃO GETULIO VARGAS
ESCOLA DE ADMINISTRAÇÃO DE EMPRESAS DE SÃO PAULO
DISTRIBUTION STRATEGIES FOR THE BASE OF THE PYRAMID: AN
EXPLORATORY STUDY IN BRAZIL
EDGARD ELIE ROGER BARKI
SÃO PAULO
2010
EDGARD ELIE ROGER BARKI
DISTRIBUTION STRATEGIES FOR THE BASE OF THE PYRAMID: AN EXPLORATORY
STUDY IN BRAZIL
Dissertation
presented
to
Escola
de
Administração de Empresas de São Paulo of
Fundação Getulio Vargas, as a requirement to
obtain the title of Doctor in Business
Administration.
Knowledge Field: Marketing
Adviser: Prof. Dr. Juracy Parente
SÃO PAULO
2010
Barki, Edgard
Distribution Strategies for the Base of the Pyramid: An Exploratory Study in
Brazil / Edgard Barki. - 2010.
260 f.
Orientador: Parente, Juracy
Tese (doutorado) - Escola de Administração de Empresas de São Paulo.
1. Mercados emergentes. 2. Consumo (Economia) – Aspectos sociais. 3.
Marketing. 4. Planejamento estratégico. 5. Canais de distribuição. I. Juracy
Parente. II. Tese (doutorado) - Escola de Administração de Empresas de São
Paulo. III. Título.
CDU 658.8
EDGARD ELIE ROGER BARKI
DISTRIBUTION STRATEGIES FOR THE BASE OF THE PYRAMID: AN EXPLORATORY
STUDY IN BRAZIL
Thesis presented to Escola de Administração de
Empresas de São Paulo of Fundação Getulio
Vargas, as a requirement to obtain the title of
Doctorate in Business Administration.
Knowledge Field: Marketing
Approval Date
____/____/_____
Committee members:
________________________________
Prof. Dr. Juracy Parente (Advisor)
________________________________
Prof. Dr. Eliane Zamith Brito
________________________________
Prof. Dr. Fernando de Rosa
________________________________
Prof. Dr. Heitor Takashi Kato
________________________________
Prof. Dr. Rodrigo Bandeira-de-Mello
To Teresa,
Letícia and Carol
AKNOWLEGMENTS
A doctoral thesis can’t be accomplished without the help of many people. Sometimes
people that don’t even know how much they helped only with one word. It is not possible to
name all these people, but I wanted to thank every person that in a more or less intense manner
made this dream come through. Anyway, I couldn’t let to name a few people that had a strong
influence on the finalization of this work.
Firstly, I want to thank my advisor. Advices, patience, support, improvements. Prof.
Parente helped me in many ways. In this six years’ relationship, he is a friend that helped in many
other instances beyond this work. Prof. Parente: Thank you for teaching me so many things of
marketing, research and, mainly, of life.
Secondly, I had the help and suggestions of many other professors that contributed a lot to
the development of this research. Four of those professionals that had a more important influence
in this work are: Prof. Delane Botelho, Profa. Eliane Brito, Prof. Heitor Kato and Prof. Rodrigo
Bandeira-de-Mello. Delane, Eliane, Heitor and Rodrigo: thank you for your scientific support.
Thirdly, I would like to thank all the interviewed people that probably will never read
these lines, but that offered me 60, 70, 90 minutes of their experience and that allowed this
research to happen. Moreover, the data supplied from Latin Panel was insightful and helpful.
Dear Executives: Thank you for creating value to this research.
Fourthly, my friends of FGV and more specifically from the Center of Retailing
Excellence gave always a great support. They gave me the space, tranquility and energy to
conclude this thesis. Sometimes the support came as “You haven’t still finished it?”; “What are
you writing so much?”, or the best one: “come on, this is only a thesis”. Ana, Celia, Edson,
Jacques, Juliana, Luiz, Maria, Mauricio, Roberta and Roseli: thank you for all these years of
excellent coexistence.
Whether the friends inside FGV gave me a great support, my friends outside FGV were
also very important to give me strength to go until the end. Betão, Carlos, Fiss and Michel: thank
you for your stimulus. Another person that played an important role from the beginning to the
end was Sonia: thank you for understanding and for helping me in a unique way.
For my family a special thank. You gave me the education that created the pillars of this
thesis. Here, I would like to express my special gratitude to my father that besides emotional
support gave me practical and operational assistance. To my parents, sisters, parents-in-law and
brothers-in-law: thank you for being so supportive in every moment.
Lastly and more importantly, I would like to thank my wife and kids. For all the moments
I was absent. For all the trips that didn’t happen. But above all, for all the support, the energy and
love you gave me in all these years. Leticia and Carol: thank you for your smiles, inspiration and
for giving another sense to life. Teresa: Thank you very much for every moment, every word.
Thank you for your understanding. Thank you for your incentive in every moment. Thank you for
being beside me.
CONTENTS
1
INTRODUCTION AND OBJECTIVES ................................................................... 18
1.1 Introduction ........................................................................................................... 18
1.2 Objectives ............................................................................................................. 22
1.3 Structure of this Work........................................................................................... 23
2
KNOWLEDGE REVIEW .......................................................................................... 24
2.1 Introduction ........................................................................................................... 24
2.2 Overview of Existing Knowledge about BoP ....................................................... 24
2.2.1
Definition of BoP ...................................................................................... 24
2.2.2
Definition of Emerging Markets ............................................................... 25
2.2.3
Knowledge about Management Practices for BoP .................................... 26
2.2.4
Strategies that best fit emerging markets ................................................... 31
2.2.5
Marketing strategies .................................................................................. 36
2.2.6
BoP consumer behavior ............................................................................. 42
2.2.7
Sustainability, clean technology and poverty alleviation .......................... 44
2.2.8
Criticisms and Ethics ................................................................................. 45
2.2.9
New business models ................................................................................ 47
2.2.9.1 Incremental Innovation .............................................................................. 48
2.2.9.2 Partnerships with local businesses and NGOs ........................................... 49
2.2.9.3 Social Entrepreneurship and Social Business............................................ 51
2.2.9.4 Co-creation with communities (Embedded Innovation) ........................... 53
2.2.10 Summary and conclusions of BoP Knowledge ......................................... 55
2.3 Marketing Channels .............................................................................................. 57
2.3.1
Definition of Marketing Channels ............................................................. 57
2.3.2
Channel Structure ...................................................................................... 58
2.3.3
Intermediaries functions ............................................................................ 61
2.3.4
Pull and Push Strategies ............................................................................ 62
2.3.5
Relationships ............................................................................................. 63
2.3.5.1 Partnerships ............................................................................................... 64
2.3.5.2 Relationship Marketing ............................................................................. 66
2.3.5.3 Trust ........................................................................................................... 70
2.3.5.4 Commitment .............................................................................................. 71
2.3.5.5 Power ......................................................................................................... 72
2.3.5.6 Continuity Relationship ............................................................................. 74
2.3.5.7 Idiosyncratic Investments .......................................................................... 75
2.3.5.8 Supplier Competence................................................................................. 76
2.3.6
Worldwide distribution cases at BoP......................................................... 76
2.3.6.1 Hindustan Unilever Limited (HUL): Shakti Program (India) ................... 77
2.3.6.2 Mumbai Dabbawala (India) ....................................................................... 79
2.3.6.3 Cemex (Mexico) ........................................................................................ 80
2.3.6.4 Wizzit (South Africa) ................................................................................ 81
2.3.6.5 Sustainable Healthcare Foundation (Kenya) ............................................. 82
2.3.6.6 Coca-Cola System’s Manual Distribution Center ..................................... 83
2.3.6.7 Grameen Danone (Bangladesh) ................................................................. 85
2.3.6.8 Nestlé (Brazil)............................................................................................ 86
2.3.6.9 Summary of Worldwide distribution cases at BoP.................................... 87
2.4 Strategy ................................................................................................................. 88
2.4.1
Introduction ............................................................................................... 88
2.4.2
Strategy Concept ....................................................................................... 89
2.4.3
Emergent x Deliberate Strategies .............................................................. 90
2.4.4
Resource Based View ................................................................................ 91
2.5 Conclusion of Knowledge Review ....................................................................... 93
3
METHODOLOGY..................................................................................................... 95
3.1 Introduction ........................................................................................................... 95
3.2 Qualitative Research ............................................................................................. 95
3.3 Research methodology: Grounded Theory ........................................................... 97
3.3.1
Evolution of grounded Theory .................................................................. 99
3.3.2
Grounded Theory in Marketing ............................................................... 100
3.3.3
Reasons for the choice of Grounded Theory ........................................... 104
3.4 Research Design ................................................................................................. 104
3.4.1
Sources of Data Collection ...................................................................... 105
3.4.2
Sample and Data Collection .................................................................... 106
3.4.3
Analysis ................................................................................................... 113
3.5 Development of a Theory ................................................................................... 117
4
BRAZILIAN MARKET OVERVIEW .................................................................... 120
4.1 Introduction ......................................................................................................... 120
4.2 Brazilian Socio-Economic Overview ................................................................. 120
4.3 Brazilian Marketing Channel Structure .............................................................. 124
4.3.1
Main Retail Formats used by Brazilians.................................................. 125
4.3.1.1 Methodology of this section .................................................................... 125
4.3.1.2 Channel Representativeness Analysis ..................................................... 125
4.3.1.3 Historical Analysis .................................................................................. 128
4.3.1.4 Summary of Retail formats used in Brazil .............................................. 129
5
RESULTS ................................................................................................................ 131
5.1 Introduction ......................................................................................................... 131
5.2 Satisfactory Distribution ..................................................................................... 132
5.3 Marketing channels ............................................................................................. 135
5.3.1
Introduction ............................................................................................. 135
5.3.2
Level Two - Direct to consumers ............................................................ 136
5.3.3
Level Three - Direct to Retail .................................................................. 137
5.3.3.1 Large & Medium Retailers ...................................................................... 137
5.3.3.2 Small retailers .......................................................................................... 140
5.3.4
Level Four ............................................................................................... 141
5.3.4.1 Wholesalers ............................................................................................. 141
5.3.4.2 Cash and Carry ........................................................................................ 143
5.3.4.3 Distributors .............................................................................................. 144
5.3.5
Conclusions of Marketing Channels........................................................ 147
5.4 Relationship ........................................................................................................ 149
5.4.1
Power Usage ............................................................................................ 149
5.4.2
Time of operation .................................................................................... 152
5.4.3
Shared Values .......................................................................................... 154
5.4.4
Idiosyncratic investments ........................................................................ 156
5.4.5
Supplier Competence............................................................................... 157
5.4.6
Trust ......................................................................................................... 161
5.4.7
Commitment ............................................................................................ 165
5.5 BoP environmental characteristics ...................................................................... 165
5.6 Manufacturers’ strategies to reach BoP market in Brazil ................................... 173
5.6.1
Large Manufacturers’ strategies to reach BoP market in Brazil ............. 173
5.6.2
Small Manufacturers’ strategies to reach BoP market in Brazil ............. 176
5.6.3
Marketing strategies to reach BoP markets ............................................. 183
5.7 Dichotomy between scalability and micro actions ............................................. 185
5.8 Innovation ........................................................................................................... 187
6
A SUBSTANTIVE THEORY FOR DISTRIBUTION TO BoP ............................. 190
6.1 Introduction ......................................................................................................... 190
6.2 Willingness ......................................................................................................... 192
6.3 Execution ............................................................................................................ 199
6.4 Relationship ........................................................................................................ 212
6.5 Proposition of substantive theory for BoP Distribution...................................... 219
7
CONCLUSIONS AND FINAL CONSIDERATIONS............................................ 222
7.1 Introduction ......................................................................................................... 222
7.2 Conclusions ......................................................................................................... 222
7.3 Theoretical Implications ..................................................................................... 225
7.4 Managerial Implications ..................................................................................... 229
7.5 Limitations .......................................................................................................... 230
7.6 Future researches ................................................................................................ 230
8
REFERENCES......................................................................................................... 233
APPENDIX 1 – Basic questionnaire used in the interviews ............................................. 250
APPENDIX 2 – Open coding from Interviews ................................................................. 251
APPENDIX 3 – Categories from Axial Coding ................................................................ 253
APPENDIX 4 – Categories from Selective Coding .......................................................... 260
LIST OF FIGURES
Figure 2-1: Model of Ghetto Consumer Problems ........................................................................ 28
Figure 2-2: The Four-Tiered Structure of Markets ........................................................................ 32
Figure 2-3: The Commercial Infrastructure at the Bottom of the Pyramid ................................... 34
Figure 2-4: The Three stages in the convergence between corporate sector and civil society...... 50
Figure 2-5: Channel structures for consumer goods...................................................................... 59
Figure 2-6: The range of Marketing .............................................................................................. 65
Figure 2-7: Key Mediating Variable (KMV) Model ..................................................................... 67
Figure 2-8: Deliberate and Emergent Strategies............................................................................ 91
Figure 3-1: Network of Basic Assumptions Characterizing the Subjective—Objective Debate
within Social Science. ................................................................................................................... 96
Figure 3-2: Zig-Zag. The process of Grounded Theory analysis. ............................................... 114
Figure 4-1: Minimum Salary Evolution ...................................................................................... 122
Figure 4-2: Variation of Average income per decile (2008/2003) .............................................. 123
Figure 4-3: Evolution of Gini Index – Brazil .............................................................................. 123
Figure 4-4: Channels relevance per channel (R$). ...................................................................... 126
Figure 4-5: Channels relevance per social class (in R$). ............................................................ 127
Figure 4-6: Channels relevance per year ..................................................................................... 129
Figure 5-1: Categories resulting from the selective coding. ........................................................ 131
Figure 5-2: Channel structures for consumer goods.................................................................... 135
Figure 5-3: Channel structure for BoP markets. .......................................................................... 148
Figure 6-1: Properties of Willingness .......................................................................................... 195
Figure 6-2: Properties and dimensions of Willingness ................................................................ 195
Figure 6-3: Evaluation of willingness of interviewed companies ............................................... 197
Figure 6-4: Willingness as a condition associated to satisfactory distribution. .......................... 199
Figure 6-5: Properties of execution ............................................................................................. 200
Figure 6-6: Properties of Operation in Marketing Channel. ........................................................ 201
Figure 6-7: Properties and dimensions of execution. .................................................................. 208
Figure 6-8: Evaluation of execution of interviewed companies .................................................. 210
Figure 6-9: Well done execution as a condition associated to satisfactory distribution.............. 212
Figure 6-10: Executives’ perceptions about relationship in the marketing channel. .................. 213
Figure 6-11: Properties and dimensions of relationship .............................................................. 214
Figure 6-12: Evaluation of relationship of interviewed companies ............................................ 216
Figure 6-13: Relationship as a condition associated to satisfactory distribution. ....................... 218
Figure 6-14: Proposed Model to have a satisfactory distribution to BoP market........................ 219
LIST OF TABLES
Table 2.1: Summary of strategies for emerging markets............................................................... 36
Table 2.2: The impact of emerging market characteristics on marketing programs ..................... 37
Table 2.3: 12 principles for product development ......................................................................... 39
Table 2.4: Next Generation BoP Strategy ..................................................................................... 54
Table 2.5: Elements of Supplier Competence ............................................................................... 76
Table 2.6: Summary of Worldwide distribution cases at BoP ...................................................... 87
Table 3.1: A comparison of grounded theory methodology orientations: Strauss and Corbin vs.
Glaser ........................................................................................................................................... 100
Table 3.2: Examples of marketing researches using grounded theory. ....................................... 102
Table 3.3: Profile of interviewed companies ............................................................................... 108
Table 4.1: Social Classes Division – Brazil in prices of December 2008 ................................... 124
Table 4.2: Per Capita Income per Region ................................................................................... 124
Table 4.3: Channels relevance per channel (volume).................................................................. 127
Table 4.4: Visits per year per social class ................................................................................... 128
Table 5.1: Executives perceptions on the dimensions that define satisfactory distribution2....... 134
Table 5.2: Importance of Power Usage in the relationship ......................................................... 152
Table 5.3: Importance of Time of Operation in the relationship ................................................. 154
Table 5.4: Importance of Shared Values in the relationship ....................................................... 156
Table 5.5: Importance of Idiosyncratic Investments in the relationship ..................................... 157
Table 5.6: Importance of Supplier Competence in the relationship ............................................ 161
Table 5.7: Importance of the antecedents of trust and commitment in the relationship.............. 161
Table 5.8: Environmental characteristics of Brazilian market .................................................... 172
Table 5.9: Marketing Mix Adaptation ......................................................................................... 184
Table 6.1: Evaluation of willingness of interviewed companies ................................................. 198
Table 6.2: Evaluation of efficient execution of interviewed companies ..................................... 211
Table 6.3: Evaluation of relationship of interviewed companies ................................................ 217
Table 6.4: Evaluation of major categories associated to a satisfactory distribution1 .................. 221
LIST OF ACRONYMS
ABAD:
Brazilian Association of Distributors
ABEP:
Association of Brazilian Research Companies
BoP:
Base of the Pyramid
CSR:
Corporate Social Responsibility
DEC:
Category Specialized Distributor
DNA:
DeoxyriboNucleic Acid
FLE:
Frontline Employees
GDP:
Gross Domestic Product
GNP:
Gross National Product
HUL:
Hindustan Unilever Limited
IBGE:
Brazilian Institute of Geography and Statistics
IBOPE:
Brazilian Institute of Public Opinion and Statistics
IPEA:
Institute for Applied Economic Research
MNC:
Multinational Company
MPP:
Management Policies and Practices
NGO:
Non Governmental Organization
P&L:
Profit and Losses
PH:
Patrimonio Hoy
PPP:
Purchasing Power Parity
RBV:
Resource-Based View
SHG:
Self Help Groups
UNDP:
United Nations Development Program
ABSTRACT
Access has been one of the main difficulties companies have faced in emerging markets
(PRAHALAD, 2005). The capillarity of the market, the existence of small, not professionalized
and sometimes informal retailers, the lack of infrastructure and high transportation costs are some
of the distribution challenges companies face in poorer regions.
The literature concerning the Base of the Pyramid (BoP) is still recent and only after the
seminal article by Prahalad and Hart (2002), it evolved into many different management
perspectives. However, there is a lack of researches concerning distribution strategies to the BoP.
Therefore, the main objective of this research is to identify, in the perception of
executives working in the market, the conditions associated to a satisfactory distribution for the
BoP market in Brazil and to build a substantive theory that helps to shed light to the
understanding of the distribution phenomenon adopted by consumer goods companies to reach
the BoP market in Brazil.
In order to accomplish the objectives of this thesis, a grounded theory methodology
(Glaser; Strauss, 1967; Corbin; Strauss, 2008) was used. This approach helped to identify the
channel strategies used by local and global companies in the market. Many techniques for data
collection were applied. The most important one was in-depth interviews with 26 executives from
24 different consumer goods companies in Brazil. Among the companies there were small,
medium and large enterprises; which were also grouped as manufacturers, distributors and
retailers. Furthermore, secondary data were examined to identify business strategies to reach BoP
and map global distribution initiatives. A database from a consumer panel was also used to
analyze what and where BoP consumers purchase non-durable goods. It was verified that small
and traditional retailing is a very strong format in BoP markets and in the Northern/Northeastern
regions. Cash & Carry is a format that is growing a lot. On the other hand, hypermarkets are not
very used by low income population.
The results suggest that three major categories are associated to a satisfactory distribution:
(a) willingness, which means the effort, knowledge and enthusiasm a firm has to operate at BoP
markets; (b) well-done execution, which is related to designing correctly the marketing channel
and operating efficiently in an environment full of obstacles, such as lack of infrastructure,
capillarity, lack of safety, regional differences and informality, and (c) relationship, which was
perceived to be friendlier and essential at BoP markets, since it is very difficult for manufacturers
to reach the entire market alone. It is more likely to have a satisfactory distribution when
manufacturers establish strong relationships in the marketing channel. Besides, small retailers
have a perception of isolation and expect a higher level of relationship. These major categories
explain also the competitive advantage that local companies have in relation to MNCs and large
companies.
Despite of the limitations of an exploratory study, it is expected that this thesis will
contribute to the BoP knowledge as well as to the identification of the peculiarities of distribution
in BoP markets.
Keywords:
Marketing Channels; Base of the Pyramid; Distribution Strategies; Marketing Strategies;
Emerging Markets; Grounded Theory.
RESUMO
Acesso tem sido uma das maiores dificuldades que as empresas tem enfrentado em
mercados emergentes (PRAHALAD, 2005). Alguns dos desafios de distribuição que as empresas
enfrentam em regiões mais pobres são a capilaridade do mercado, a existência de varejistas
pequenos, não profissionalizados e por vezes informais, a falta de infra-estrutura e os altos custos
de transporte.
A literatura relacionada à base da pirâmide (BoP) é ainda recente e apenas após o artigo
seminal de Prahalad e Hart (2002), que o assunto evoluiu em diversas perspectivas em negócios.
No entanto, ainda há uma lacuna em estudos relacionados a estratégias de distribuição para a base
da pirâmide.
Assim sendo, o principal objetivo deste estudo é identificar, na percepção de executivos
que trabalham no Mercado, as condições associadas a uma distribuição satisfatória para o
Mercado da Base da Pirâmide no Brasil e construir uma teoria substantiva que apóie o
entendimento do fenômeno da distribuição para a base da pirâmide de empresas de bens de
consumo no Brasil.
Para atingir os objetivos deste trabalho, foi utilizada a metodologia da Grounded Theory
(Glaser; Strauss, 1967; Corbin; Strauss, 2008). Esta metodologia ajudou a identificar as
estratégias de canal utilizadas por empresas locais e globais. Várias técnicas de coleta de dados
foram utilizadas. A mais importante foi a realização de entrevistas em profundidade com 26
executivos de 24 empresas diferentes de bens de consume no Brasil. Dentre estas empresas havia
pequenas, medias e grandes organizações; que também foram agrupadas em fabricantes,
distribuidores e varejistas. Além disso, dados secundários foram analisados para identificar
estratégias de negócios e mapear iniciativas globais de distribuição. Um banco de dados de um
painel de consumidores foi utilizado para analisar o que e onde os consumidores da base da
pirâmide comparam bens não-duráveis. Foi verificado que o pequeno varejo tradicional é um
formato muito importante para a Base da Pirâmide e nas regiões Norte e Nordeste. Cash & carry
é um formato que está crescendo bastante. Por outro lado, hipermercados não são muito
utilizados pela população de baixa renda.
Os resultados sugerem que três categorias principais estão associadas a uma distribuição
satisfatória: (a) Interesse em atuar na Base da Pirâmide, que significa o esforço,
comprometimento, conhecimento e entusiasmo de uma empresa em atuar na Base da Pirâmide;
(b) execução, que está relacionada ao correto desenho da estrutura de canais e em uma operação
eficiente em um ambiente repleta de obstáculos, tais como falta de infra-estrutura, capilaridade,
insegurança, diferenças regionais e informalidade, e (c) relacionamento foi percebido como sendo
mais amigável e essencial na base da pirâmide, dada a dificuldade dos fabricantes em acessar o
mercado todo sozinhos. É mais provável estabelecer-se uma distribuição satisfatória quando os
fabricantes possuem relacionamentos estreitos com o canal de marketing. Além disso, pequenos
varejistas tem a percepção de isolamento e possuem a expectativa de um maior nível de
relacionamento.
Apesar das limitações de um estudo exploratório, espera-se que esta tese contribua para o
conhecimento na Base da Pirâmide e na identificação das peculiaridades existentes na
distribuição de produtos de bens de consumo para a Base da Pirâmide.
Palavras-chave:
Canais de Marketing; Base da Pirâmide; Estratégias de Distribuição; Estratégias de
Marketing; Mercados Emergentes; Grounded Theory.
18
1
INTRODUCTION AND OBJECTIVES
1.1
Introduction
Access has been one of the main difficulties companies have faced in emerging markets
(PRAHALAD, 2005). The capillarity of the market, the existence of small, not professionalized
and sometimes informal retailers, the lack of infrastructure and high transportation costs are some
of the distribution challenges companies face in poorer regions. Hence, organizations that
properly define their distribution strategies and efficiently execute them may have a source of
competitive advantage.
Worldwide low income markets comprise 4 billion people with a combined income of
about US$ 5 trillion, similar to the gross national income of Japan (UNDP, 2008). In Brazil,
almost 70% of the population may be defined as low income and they are responsible, in some
categories, for the largest share of the market.
Surprisingly, despite the importance of distribution and of low income markets, based on
empirical data that has been collected, it is possible to note that even large companies with an
intensive distribution, still have a hard time reaching the Base of the Pyramid (BoP)1. Actually,
many times, regional or local brands are closer to these consumers and to more adequate
marketing channels.
Although distribution decisions cannot be made in isolation from other marketing-mix
initiatives such as pricing, product development and communication, the reasons for the emphasis
of this thesis in distribution strategies are twofold: The relevance of distribution strategies in the
challenge to reach BoP population and the fact that they have not received much attention in
previous works developed about business activities in the existing BoP literature.
Even though there are in Brazil more than one million points of sales and many
distribution models, few cases and researches have been made in this subject in the country or
even in other emerging markets (LENARTOWICZ; BALASUBRAMANIAN, 2009).
1
It was first called “Bottom of the Pyramid”. The term has evolved to “Base of the Pyramid’.
19
Understanding how to transpose the inefficiencies of an emerging market is important to offer
better solutions for BoP markets. As stated by Lenartowicz and Balasubramanian (2009, p. 58):
A key challenge in consumer markets in developing economies pertains to the
‘last-mile’ problem - that is, the challenge of getting goods to the final
consumer… efficiencies associated with consolidated retail formats are difficult
to achieve in developing economies.
It is clear that there is a need to clarify the difficulties, complexities and strategies to reach
BoP in emerging countries as Brazil. Thus, understanding distribution models, their efficiency
and their propensity for success will contribute to a better strategic definition of companies (large
and small) willing to access BoP markets.
Our study has identified the existence of different distribution models in operation in
Brazil: there are companies that reach the small retailers which serve the BoP markets selling
through distributors and wholesalers (for instance, Unilever and Procter & Gamble), others sell
directly to small retailers (as for example, Souza Cruz and Coca Cola) and still others sell directly
to end consumers (Natura and Avon). There are hybrid solutions too, as is the case of Nestlé that
sells directly to some small retailers; operates through distributors, and has also a door-to-door
model. To select the best channel structure is one of the main issues when defining distribution
strategies.
Another important issue in this context is the length of the channel structure. It is
hypothesized by some authors (JAFFE; YI, 2007), that the channel length, i.e., the number of
intermediaries of a marketing channel, depends on the level of development and efficiency of the
market. For the authors, with economic development there is a lengthening of marketing channels
as more intermediaries enter the distribution system, but later on, there is a shortening as a result
of efficiencies such as vertical integration.
To analyze marketing channels used to reach low income consumers, this thesis
contextualizes the discussion under BoP business literature. Since the seminal article by Prahalad
and Hart (2002) about the relevance of BoP, a lot has been written and studied. The discussion
which started with the potential of the market (PRAHALAD; HART, 2002; PRAHALAD, 2005)
has evolved. Some different perspectives were offered, such as possible strategies to reach low
income consumers (DAWAR; CHATTOPADHYAY, 2002; LONDON; HART, 2004), the
20
importance of understanding the differences between developed and emerging markets
(KHANA; PALEPU, 2006), how to define the right business model to operate at BoP (SEELOS;
MAIR, 2007; RANGAN et al, 2007; SIMANIS; HART, 2009) and which were the sustainability
challenges and solutions at BoP (HART, 2005; KANDACHAR; HALME, 2008).
One of the main issues under this discussion is the role of Multinationals (MNCs), local
companies, Non Governmental Organizations (NGOs) and the Government. Some authors
supported the idea that MNCs have an important and many times leading role in developing
inclusive business models (PRAHALAD; HART, 2002; PRAHALAD, 2005).
For other authors (KHANA; PALEPU, 2006), local companies are more adapted to operate
in the hurdle infrastructure and legal barriers of the emergent markets. Only local companies
could thoroughly understand the idiosyncrasies of these markets. Moreover, only locals could be
successful or even willing to create new products or services for BoP markets which demand
another price-performance logic. Therefore, one of the objectives of this study is to identify the
distribution strategies of small local manufacturers that make them fierce competitors to MNCs
and large companies.
Based on the existing BoP literature, four business models appear as a possibility to
generate new businesses and at the same time improve life of the poor. The first one is based on
partnerships between MNCs and NGOs (PRAHALAD, 2007; SEELOS and MAIR, 2007). MNCs
have the technology and capital and NGOs the knowledge about the communities’ needs. The
second business model is inspired by the Nobel Prize Yunus and is established on the structure of
a “Social Business”, where the main objective of the company is the social impact and not
necessarily profits (YUNUS, 2007).
The third business model is structured on the concept of co-creation with the communities.
This new capacity is termed “social embeddedness” or “native capability” (LONDON, 2008).
The fourth business model is used by for profit companies that take advantage of their existing
business to make incremental improves to reach BoP markets. Companies just adapt their
business model to operate in a more appropriate way at BoP. Despite being the most used model,
the limited number of successful cases show that much have still to be improved (OLSEN;
BOXENBAUM, 2009).
21
One of the objectives of this thesis is to understand whether the concepts and ingredients
of these business models are present in the distribution strategies developed by manufacturers in
Brazil.
Under this scenario, some large companies are trying to find shortcuts or new alternatives
to reach BoP markets. Nevertheless, the majority of the actions are still in the direction of some
incremental improvements in distribution models. On the other hand, many small and local
companies, in a clear emergent strategy, are quite successful in their distribution strategy and
many times have a competitive advantage in their proximity to the market. Hence, the main
purpose of this work is to identify the conditions associated to a satisfactory distribution to BoP
markets and to analyze the distribution strategies adopted by large and small companies in Brazil.
Based upon the data collected, this research seeks to build a substantive theory2 that helps to shed
light to the elements which influence the degree of a satisfactory distribution for the BoP market
in Brazil.
As the theme is still recent in management literature, this thesis seeks also to map some
global distribution strategies adopted by companies in order to identify some of their innovations
and key success factors and compare them with the findings of the empirical research.
Moreover, distribution and channel management literature is much more mature, but
mainly considering more developed markets. Whether in distribution strategy literature,
relationship in the channel, partnership, trust and commitment are important constructs that
define a successful approach to marketing channels; in business BoP literature also trust,
relationship, partnership and social embeddedness appear as important elements that differentiate
successful business models. Therefore, this thesis aims also at linking these two theoretical
knowledge fields to provide a broader understanding about distribution at BoP markets.
In order to accomplish the objectives of this thesis, a grounded theory methodology was
used. This approach helped to identify the channel strategies used by local and global companies
in the market. Many techniques for data collection were applied. The most important one was indepth interviews with 26 executives from 24 different consumer goods companies in Brazil.
Among the companies there were small, medium and large enterprises; which were also grouped
2
Substantive theory is a specific theory applied for a group or situation. It is a context specific theory, rather than
developed to the general level (GOULDING, 2005). See more in section 3.5.
22
as manufacturers, distributors and retailers. Furthermore, secondary data were examined to
identify business strategies to reach BoP and map global distribution initiatives. A database from
a consumer panel was also used to analyze what and where BoP consumers purchase non-durable
goods.
1.2
Objectives
Based upon the above description, the main objective of this research is to identify, in the
perception of executives working in the market, the conditions associated to a satisfactory
distribution for the BoP market in Brazil and to build a substantive theory that helps to shed light
to the understanding of the phenomenon of consumer goods distribution for the BoP market in
Brazil.
In order to accomplish the main objective, some intermediaries objectives should be
achieved, and they are listed below:
•
Describe distribution strategies that companies use in Brazil to distribute their products
to BoP markets.
•
Integrate the existing knowledge about distribution with the findings from the empirical
investigation with manufacturers and distributors who serve the Brazilian BoP market.
•
Identify how the distribution strategies of small local companies make them fierce
competitors to MNCs and large companies.
•
Identify if the ingredients proposed by BoP business models are present in the
distribution strategies developed by manufacturers in Brazil.
•
Map global distribution strategies adopted by companies in order to identify some of
their innovations and key success factors and compare them to the findings of the
empirical research.
23
1.3
Structure of this Work
This work is divided into seven chapters. This first one introduces the theme, its relevance
and the thesis’ objectives. In the second chapter, the knowledge review is presented. The third
chapter describes the methodology applied in the research. In the fourth, a Brazilian socioeconomic overview is presented. In the fifth chapter, results of the field research are described
and in the following one a substantive theory for distribution at BoP is elaborated. In the seventh
and last chapter the conclusions, theoretical and managerial implications are presented as well as
the work limitations and proposals for future studies.
24
2
KNOWLEDGE REVIEW
2.1
Introduction
The main objective of this research is to identify, in the perception of executives working
in the market, the conditions associated to a satisfactory distribution for the BoP market in Brazil
and to build a substantive theory that helps to shed light to the understanding of the phenomenon
of consumer goods distribution for the BoP market in Brazil. For this purpose, the knowledge
review is divided into three parts.
The first part conceptualizes BoP and emerging markets, presents the evolution of the
knowledge about management practices for BoP, examines some characteristics about low
income consumer behavior and discusses business models and strategies for BoP markets.
The second part defines marketing channels and some of the constructs it involves, such as
relationship and presents some examples of worldwide distribution models for BoP.
Finally, as strategy is a central concept in this thesis, the third part of the knowledge
review presents some strategy theories.
2.2
Overview of Existing Knowledge about BoP
This section offers an overview of the definition of BoP and emerging markets, the history
of the recent knowledge about management practices for BoP, the consumer behavior of
Brazilian consumers at BoP, strategies to reach the BoP population, the sustainability challenges
and solutions for BoP, the criticisms that have been made about the ideas presented in BoP
literature, and finally business models proposed to operate at BoP.
2.2.1
Definition of BoP
The term BoP has not been precisely defined. Different authors use distinct definitions.
Some authors define it as people who live with less than US$ 2 per day, considering Power
Purchase Parity (PPP) (PRAHALAD; HART, 2002; PRAHALAD, 2005). It is possible also to
25
differentiate the extremely poor people, who live with less than US$ 1 per day from the
moderately poor - less than US$ 2 (REDDY; MINOIU, 2007). As a matter of fact, the
international poverty lines are US$1.08 and US$2.15 per person per day at 1993 PPP, and the
preferred welfare indicator for international comparisons is consumption rather than income
(RAVALLION; CHEN, 2004). However, most of the researches and case studies at BoP consider
a broader definition that includes people living on less than US$8 a day (UNDP, 2008).
Within the BoP group, income levels vary. About 1.1 billion earn US$ 2-8 per day and –
while still considered poor – are beginning to generate significant discretionary income. In the
mid-range, 1.6 billion earn between US$ 1-2 per day, spending largely on essentials. One billion
people live in extreme poverty, earning under US$ 1 per day, and often struggle to meet basic
needs (WORLD ECONOMIC FORUM, 2009).
Nevertheless, it is possible to argue that poverty is much more than low income. For the
poor, “well-being is peace of mind; it is good health; it is belonging to a community; it is safety;
it is freedom of choice and action; it is a dependable livelihood and a steady source of income; it
is food” (KANDACHAR; HALME, 2008, p. 6). Therefore, discussing BoP is much more than
only analyzing people below poverty lines, it is to understand the values, behavior and desires of
a population deprived of a consumption society.
In Brazil, there isn’t also a single definition of BoP. Some authors use the concept of
people belonging to classes C, D and E (PRAHALAD, 2005; PARENTE et al, 2008). In this
work, this last definition will be used, with the qualification that the values and behavior of the
population are also important drivers to define BoP. For Brazil, based on average income by
social class compiled by the Brazilian Association of Research Companies (ABEP), the monthly
family income of about US$ 1,0003 is the dividing line between class C and class B.
2.2.2
Definition of Emerging Markets
Many authors (HAMMOND; PRAHALAD, 2004; KHANA; PALEPU, 2006; McFALLS,
2007) when discussing BoP, bring the concept together with emerging markets. Therefore this
section presents the differences between BoP and emerging markets.
3
US$ 1 = R$ 1.74, Jan 1st 2010.
26
A term coined in 1981 by Agtmael of the International Finance Corporation of the World
Bank, an emerging market is defined as an economy with low-to-middle per capita income. Such
countries constitute approximately 80% of the global population, representing about 20% of the
world's economies4.
According to Arnold and Quelch (1998),
There is no commonly accepted definition of “emerging market”, but there are
three aspects of a country’s economy that often underlie various definitions.
First is the absolute level of economic development, usually indicated by the
average GDP per capita, or the relative balance of agrarian and
industrial/commercial activity… Second is the relative pace of economic
development, usually indicated by the GDP growth rate. Third is the system of
market governance and, in particular, the extent and stability of a free market
system.
It becomes clear that emerging markets and BoP are not synonymous. Most of BoP
population lives in emerging markets, and the largest amount of people that live in emerging
markets can be classified as BoP. However, there is an important affluent segment also in the
emerging markets that has to be considered.
Despite this consideration, in this thesis, when the term “emerging markets” is adopted, it
can be understood as the BoP approach to emerging markets, not considering the high income
population.
2.2.3
Knowledge about Management Practices for BoP
This section will not describe the history of poverty, the reasons for so many inequalities
in the world or even the many different thoughts about poverty. As mentioned by Malthus (1817,
apud LANDES, 1998) “the causes of the wealth and poverty of nations - the grand object of all
enquiries in Political Economy”. The objective here is just to present an overview of the recent
evolution of BoP knowledge in its business vein.
4
Source: http://www.investopedia.com/articles/03/073003.asp accessed in 01/28/2009
27
THE 1960s AND 1970s
The concept that low income is also an important market and poor could be seen as
consumers is not new. Since the decade of the 1960s, several authors devoted attention to the fact
that poor people in the United States pay more for the same products than rich people
(CAPLOVITZ, 1963; GOODMAN, 1968; ALCALY; KLEVORICK, 1971; KUNREUZHER,
1973). The main reason identified in these articles for the poor paying more is that they usually
shop at small independent stores, which practice higher prices, owing to their inefficiencies and
higher operational costs (BERRY, 1972).
However, this was not new even at that time. Converse and Spencer (1942, p. 371) had
already made a research which identified that
Low-income families buy a large proportion of their groceries daily from
independent neighborhood stores located conveniently near their homes. This
habit may be thought by some to indicate improvidence, since such stores are
generally believed to have somewhat higher prices than the supermarkets and
the cash-carry chain grocery stores. It was observed, however, that many of
these families cook their food as soon as purchased. If large quantities are
purchased, some of it will be wasted or spoil. To buy economically in larger
quantities would involve larger storage and refrigeration space. Thus the practice
of hand-to-mouth buying may not be as uneconomical as it seems.
Another argument for the poor paying more was because of their lack of education and of
shopping expertise. This made them an easy target for unethical practices of retailers, which
could be practiced by luring the consumer for easy credit or even by using abusive, unethical and
illegal sales tactics (CAPLOVITZ, 1963; BERRY, 1972). Furthermore their low income made it
difficult for them to afford lower priced, large sized products (KUNREUZHER, 1973).
The relevance of understanding BoP shopping habits became stronger with the expansion
of credit, as stated by Caplovitz (1965, p.12):
Until recently, the War on poverty was focused exclusively on the inability of
the poor to earn a decent living. The emphasis has been upon expanding
economic opportunities through education, job training and job creation. In
recent months, however, the Office of Economic Opportunity has come to
recognize that earning power is only one side of the economic plight of the
28
impoverished. Also important is how the poor spend what little income they
have.
Summarizing, until the mid 1970s, it is possible to perceive three major factors causing
low income consumer problems, which can be seen in Figure 2-1. The first set of factors is the
personal characteristics of the consumers, with their attitudes, values and preferences
(CAPLOVITZ, 1963), which is going to be further discussed in chapter 2.2.6.
The second important set of antecedents is the market structure that makes poor purchase
predominantly in small inefficient and more expensive retailers. The third set of factors is the
exploitation of low income population by abusive practices of dealers, and their need for credit,
which were also many times exploitive.
Socioeconomic
Characteristics
Attitudes, Values
Preferences
Ghetto Consumer
Problems
Market Structure
Merchant
Exploitation
Figure 2-1: Model of Ghetto Consumer Problems
Source: Andreasen (1978, p. 23), based on Caplovitz (1963).
THE EARLY 1990s
The interest in the subject during the 1960s and early 1970s seemed like a wave that
passed. During the 1980s, the discussion about the poor as consumers has been scarce
(ANDREASEN, 1993; ALWIT, 1995). It was only in the early 1990s that the interest on low
income consumers emerged again, but still with the focus on North American poor. Mayer et al
(1993) brought up once more the discussion that the poor pay more for the same products. The
causes remained the same as in the 1960s and 1970s, that is, poor communities usually purchase
in small independent and more expensive stores, they buy more frequently in smaller uneconomic
29
packages and there were still unethical retail practices as, for instance, a store “increase [s its
prices] on the first and fifteenth of the month, when food stamps, welfare, social security, and
other government support checks are received” (MAYER et al, 1993, p. 268). Despite these
problems, Mayer et al (1993) believed that there was an untapped market for large supermarket
chains to operate successfully and profitably in low income neighborhoods and partnerships
among communities, local government and corporations were a way out for achieving success.
Alwit and Donley (1997) broadened that discussion, showing that poor neighborhoods not
only had fewer large chains in the grocery and banking industries – which were the main market
segments studied until then – but also in other types of retail establishments, such as drugstores,
apparel stores, restaurants and discount stores. They also agreed that low income markets were
underserved by retailers.
Alwit (1995) proposed five solutions for the problems faced by the American poor:
“increase what the poor consumer has to exchange; increase the exchange power of poor
consumers; decrease the exchange power of the marketer; alter what marketers have to exchange;
reduce marketer risk”, in a clear demonstration of the concern with both the income of the poor
consumer and the profits from the companies.
FROM 1998 ONWARDS
Until 1997, the discussion about low income was much more oriented to their lack of
access to large retail chains and the need to buy in small inefficient and more expensive stores.
The proposal was to create mechanisms to facilitate the operation of larger retailers and/or
professionalize the smaller stores in the inner cities.
Since 1998, the subject had broadened in several aspects. Many different authors of
distinct countries joined the debate, which turned into a global discussion, with a strategic
orientation aiming at creating opportunities to sell profitable goods and services for the poor and
simultaneously improve their welfare.
In that year, Prahalad and Hart wrote an article that was still underground called “Raising
the Bottom of the Pyramid: Strategies for Sustainable Growth”. It was only published in 2002
with the name “The Fortune at the Bottom of the Pyramid”, and was considered one of the most
30
influential papers on the subject. The main objective was to show the enormous potential of the
low income population, mainly in the emerging markets. As they argue, it represents a market of
4 billion people with annual per capita income of less than US$ 1.500, based on purchasing
power parity. This opportunity, still out of MNCs lens could mean “lifting billions of people out
of poverty and desperation, averting the social decay, political chaos, terrorism, and
environmental meltdown that is certain to continue if the gap between rich and poor countries
continues to widen” (PRAHALAD; HART, 2002, p.3).
The theme of the potential of BoP market and its fortune appeared in many other articles
(ARNOLD;
QUELCH,
1998;
DAWAR;
CHATTOPADHYAY,
2002;
PRAHALAD;
HAMMOND, 2002; PRAHALAD, 2005). In his book, Prahalad (2005) assumes a potential
market in PPP (Purchasing Power Parity) of US$ 12.5 trillion, which represents 90% of the
developing world. Despite many discussions about the real potential of the market (KARNANI,
2007), the mainstream believe that there is a huge, untapped market at BoP.
However, the main issue is not anymore to evaluate if there is or not a fortune at BoP. As
Wilson and Wilson (2007, p. 11) argue, Prahalad set the agenda and created “the motivation, the
ambition and the shining city on the hill”.
The discussion evolved to the strategies that best fit emerging markets (ARNOLD;
QUELCH, 1998; DAWAR; CHATTOPADHYAY, 2002; HAMMOND; PRAHALAD, 2004;
KHANA; PALEPU, 2006); the differences between emerging poor markets and developed
markets (DE SOTO, 2000; KHANA et al, 2005); BoP consumer behavior (PARENTE, 2005;
KEMPEN, 2004; D’ANDREA; LUNARDINI, 2005); sustainability, poverty alleviation and
clean technology (HART, 2005; KANDACHAR; HALME, 2008; LONDON, 2008), criticisms
and ethics (KARNANI, 2007; HUDON, 2009) and new business models (WILSON; WILSON,
2006; BRUGMANN; PRAHALAD, 2007; SEELOS; MAIR, 2007; YUNUS, 2007; SIMANIS;
HART, 2009). All these points will be further discussed in the next sections.
31
2.2.4
Strategies that best fit emerging markets
This section aims at describing some of the strategies identified to reach emerging
markets. Although not being the focus of this thesis, general strategies have an important role in
the definition of distribution strategies.
Despite the increasing concern about environmental and social aspects of the inclusion of
poor people in the market, BoP management discussions are still mainly a sales approach
(WILSON; WILSON, 2006). Furthermore, there is a consensus that MNCs should avoid an
imperialist approach (ARNOLD; QUELCH, 1998; PRAHALAD; LIEBERTHAL, 1998). In that
sense, many academics and companies are interested in developing the right strategies for
emerging markets.
Besides the potential of emerging markets, the competition among MNCs in the
developed economies stimulated a new look at emerging markets (ARNOLD; QUELCH, 1998).
However, these markets challenged MNCs with institutional voids they hadn’t faced before, such
as lack of data; lack of sophistication in capital and financial markets; few distribution and
communication channels; inadequate physical infrastructure; ineffective property and regulatory
system; lack of knowledge and skills, and political structure and social organization quite
different from developed economies (ARNOLD; QUELCH, 1998; DE SOTO, 2000; KHANA et
al, 2005; UNDP, 2008).
To accomplish good results, MNCs should understand the differences in these markets
and adapt their strategies, instead of just adopting a less developed approach assuming that these
markets are just at an earlier stage of the same development path followed by developed countries
(ARNOLD; QUELCH, 1998; DAWAR; CHATTOPADHYAY, 2002; KHANA et al, 2005). One
of the main challenges for MNCs is to change their mindset of high-margin markets and learn to
operate creatively and without preconceptions. Therefore they should invest in learning to really
understand how to reach profitably BoP (PRAHALAD; HAMMOND, 2002; LONDON; HART,
2004).
Khana and Palepu (2006) show many examples that local companies still excel MNCs.
According to the authors, this happens for three reasons:
32
i.
When multinationals operate in emerging markets they have to face the same
institutional voids local companies face. However, local companies and their
executives are much better adapted to operate in precarious circumstances.
ii.
As they have some success, companies from emerging markets can tap talent and
capital in developed countries. For instance, it is much more common for these
companies to list themselves in the New York Stock Exchange or Nasdaq and
raise money.
iii.
Many multinationals are reluctant to tailor and adapt their strategies to the needs
of the emerging markets, mainly for BoP.
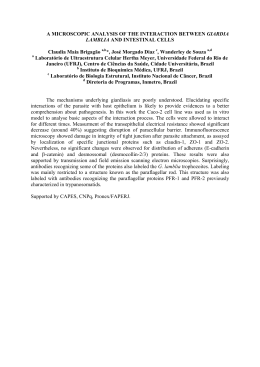
As shown in Figure 2-2, most product markets in emerging countries comprise four tiers
(KHANA; PALEPU, 2006): the global tier, where consumers want products with global qualities
and features. Usually, MNCs can only afford to serve this tier and leave the market quite open to
operate in the other tiers which are the glocal, “that demands products of global quality but with
local features (and local soul) at less-than-global prices; a local segment that wants local products
with local features at local prices; and a bottom-of-the-pyramid segment” (KHANA; PALEPU,
2006, p.63). The markets for talent and capital in developing countries are usually structured
along the same lines.
top-notch managers, who demand global-level
salaries.
high-quality managers who will work only
for local companies even if the pay is a
little less than it would be at multinational
corporations.
Managers will put up with lessthan-worldclass working
conditions as long as they are
paid higher-than-average
salaries.
Less qualified
managers.
Global
Glocal
Local
consumers who want offerings to have the same
attributes and quality that products in developed
countries have and are willing to pay global
prices for them
Consumers who demand customized products of
near-global standard and are willing to pay a little
less than global consumers do.
Consumers are happy with products of
local quality and at local prices.
Base
Figure 2-2: The Four-Tiered Structure of Markets
Source: Adapted from KHANA and PALEPU (2006, p. 65)
People who can afford only
the least expensive products.
33
In the above figure, Khana and Palepu (2006) introduce the idea that besides being
possible to divide the population in tiers according to their income, companies may also be
segmented in four levels. Each level has different targets, characteristics and competitive
advantages. Understand these differences might be fundamental to better explain the elements
that define a satisfactory distribution.
In order to be successful in emerging markets, many authors suggest some strategies for
MNCs. For instance, Arnold and Quelch (1998) argue that there are four areas in which MNCs
should adapt their strategies:
•
Timing of Entry: MNCs would have additional advantages in being the first
movers, including “favorable government relations, pent-up demand,
marketing productivity, marketing resources and consequent learning” (p. 10)
•
Market assessment: The market analysis should be based on long-term
evaluation and not only on short term political and economic risks.
•
Product Policy: The product life cycle might be different in Emerging markets
due to their restrained demand.
•
Partner Policy: Possibility of different marketing channels, as direct sales and
multiple marketing partners, mainly with local distributors.
Prahalad and Hart (2002) also believe that MNCs could have an important role and should
develop new business models in partnership with multiple players like local governmental
authorities, nongovernmental organizations (NGOs), communities, financial institutions, and
other companies. In their view, MNCs should be innovative and assure competitiveness in four
key elements: creating buying power, improving access, shaping aspirations and tailoring local
solutions (Figure 2-3).
34
Creating Buying
Power:
• Access to Credit
• Income Generation
Improving Access:
• Distribution Systems
• Communications
links
Shaping Aspirations:
• Consumer education
• Sustainable
Development
Tailoring Local
Solutions:
• Targeted product
development
• Bottom-up innovation
Figure 2-3: The Commercial Infrastructure at the Bottom of the Pyramid
Source: PRAHALAD; HART, 2002, p.8.
Microcredit plays an important role in creating buying power either making consumption
possible or improving income through the entrepreneurship of low income populations. Shaping
aspirations means meeting consumers’ needs with disruptive innovation that in many ways can be
a clean, sustainable technology. In improving access, MNCs should evaluate new manners of
distributing their products to reach rural and remote communities with poor infrastructure. MNCs
could also distribute products manufactured by low income people and link them to the entire
world. Finally, MNCs should tailor local solutions, with deep local insights, combining global
best practices with local capabilities (PRAHALAD; HART, 2002).
Prahalad (2005, p. 18) believes that
Creating the capacity to consume is based on three simple principles best
described as the “Three As”:
1. Affordability. Whether it is a single-serve package or novel purchasing
schemes, the key is affordability without sacrificing quality or efficacy.
2. Access: Distribution patterns for products and services must take into account
where the poor live as well as their work patterns. Most BOP consumers must
work the full day before they can have enough cash to purchase the necessities
for that day. Stores that close at 5:00 PM have no relevance to them, as their
shopping begins after 7:00 PM. Further, BOP consumers cannot travel great
distances. Stores must be easy to reach, often within a short walk. This calls for
geographical intensity of distribution.
35
3. Availability: Often, the decision to buy for BOP consumers is based on the
cash they have on hand at a given point in time. They cannot defer buying
decisions. Availability (and therefore, distribution efficiency) is a critical factor
in serving the BOP consumer.
From the 3 “A”s suggested by Prahalad, two of them are closely linked to distribution:
access, which refers to the importance of an intensive distribution and availability that is related
to the distribution efficiency.
Anderson and Markides (2007) include a “fourth A” in this discussion that stands for
“Awareness”, which would be the consciousness of consumers about the existence of products
and services of a company. As many BoP consumers are not reached by conventional
communication, awareness is a great challenge for large companies.
London and Hart (2004) also identified three important strategies of successful BoP
market entries: Collaborating with non-traditional partners, Co-inventing custom solutions,
Building local capacity. According to a UNDP report analyzing 50 case studies all over the
world, there are five core strategies used by companies in emerging markets (UNDP, 2008):
•
Adapting products and processes;
•
Investing to remove market constraints;
•
Leveraging the strengths of the poor;
•
Combining resources and capabilities with other organizations;
•
Engaging in policy dialogue with government.
A recurrent theme when discussing strategies for BoP is innovation. As Hart (2005b)
argues, companies should look for disruptive innovation. The disrupters “have discovered new
ways of solving old problems that are usually simpler, cheaper, easier to use, and require less
centralized expertise. Disruptive innovations have those characteristics. Initially, such
innovations do not look very appealing to the mainstream market” (HART, 2005b, p. 26).
Or, as Wilson and Wilson (2006, p. 127) argue “perhaps the most interesting areas in
innovation for poverty reduction are not the product itself but the processes by which customers
acquire, use and dispose it”.
Owing to the market structure, competition is quite different in emerging markets, where
informal economy is huge and plays an important role (LONDON; HART, 2004). “The new
36
urban poor have created entire industries and neighborhoods that have to operate on clandestine
connections to electricity and water. There are even dentists who fill cavities without a license”
(DE SOTO, 2000, p. 28). Therefore, companies’ strategies must be adapted and face different
kinds of threats.
The following table summarizes the main strategies presented above:
Table 2.1: Summary of strategies for emerging markets
Author
Arnold and Quelch (1998)
Prahalad and Hart (2002)
London and Hart (2004)
Prahalad (2005)
Anderson and Markides
(2007)
UNDP (2008)
Strategy / Strategy Concerns
Timing of Entry (First Movers)
Market assessment (long-term evaluation)
Product Policy (Different product life cycle)
Partner Policy (Different and varied partners)
Creating Buying Power
Improving access
Shaping aspirations
Tailoring local solutions
Collaborating with non-traditional partners
Co-inventing custom solutions
Building local capacity
Affordability
Access
Availability
Affordability
Access
Availability
Awareness
Adapting products and processes
Investing to remove market constraints
Leveraging the strengths of the poor
Combining resources and capabilities with other
organizations
• Engaging in policy dialogue with government
•
•
•
•
•
•
•
•
•
•
•
•
•
•
•
•
•
•
•
•
•
•
Source: Elaborated by the author
2.2.5
Marketing strategies
One first attempt to identify how marketing strategies should adapt to BoP markets was
made by Dawar and Chattopadhyay (2002).
37
Table 2.2: The impact of emerging market characteristics on marketing programs
Segmentation
Segments are coarse
and diverse because
the costs of
segmentation are high.
Mass media are not
finely segmented.
Product
Products need to be
functional, built to
last, and basic.
Rapid obsolescence
is a mistake.
Variability
Income disparities and
income flow
variability lead to coexistence of very
different market
segments.
Cheap labor
Despite huge
differences in
consumers’ cost of
time, the market
cannot be segmented
on this dimension
because time is often
bought and sold.
Quality consistency
is at a premium,
and not easy to
achieve in a
variable
environment.
Design and
package for
infrastructural and
consumer
variability.
Products can be reengineered to
replace some
elements with
consumers’ labor.
This makes the
product more
affordable to the
mass market.
Low
Incomes
Source: DAWAR; CHATTOPADHYAY, 2002, p.461
Pricing
Large volumes, and
low margins drive
profitability.
Consumers gauge
prices in relation to a
local basket of
purchases.
Price promotions
yield large volume
gains. But it is
worthwhile to launch
second tier brands
rather than
occasional
promotions.
Distribution
Retail distribution is
highly fragmented, but
nevertheless, powerful.
Communication
Persuade consumers to
consume more and nonconsumers to adopt the
product.
Urban and rural
retailers look similar
but operate on
different principles. It
pays to be first in rural
markets. It pays to be
differentiated in urban
markets.
Creating own channels of
communication where no
mass media exist to cater
to large swathes of the
market.
Consumers ‘make
versus buy decisions
drive value
perceptions.
Competition also
comes in the shape of
home- made products
People rather than
machines provide a
cost-effective means
of delivering products
to consumers.
Mass media don’t always
have a cost advantage
over face-to-face
customer interaction.
Sales forces can be used
to communicate product
benefits and usage more
effectively.
38
According to them, segmentation in emerging markets is difficult to implement, since it’s
too expensive to target different segments and there is not such a variety of segments which are
both able and willing to pay for specialized products.
As for the products, Dawar and Chattopadhyay (2002, p. 462) believe that emerging
“consumers dislike products that evolve too rapidly, making their recent purchases obsolete instead, the need is for basic, functional, long lasting products”. Regularity in these markets is
very important. The price is also seen as a fundamental variable and the market is driven by low
cost, low price, low margin and high volumes. Price promotions usually have good results.
Distribution must assume that marketing channels in emerging markets are extremely fragmented
and small stores possess the majority of the market. Regarding communication, it is important to
establish a brand positioning and face to face can be an effective alternative to mass media
(DAWAR; CHATTOPADHYAY, 2002).
This discussion evolved with some researches and analyses about marketing strategies for
BoP markets. Prahalad (2005), for instance defined 12 principles to develop products for BoP
markets. It is possible to notice in these principles the relevance of innovation and understanding
of the consumer needs. Prahalad (2005) agree with the idea of low prices and low margins (first
principle) but goes far beyond, as can be seen in the table below.
39
Table 2.3: 12 principles for product development
PRINCIPLE
1. Price Performance
2. Innovation: Hybrids
3. Scale of Operations
4. Sustainable
Development:
Eco-Friendly
5. Identifying Functionality
6. Process Innovation
7. Deskilling of Work
8. Education of Customers
9. Designing
for
Infrastructure
10. Interfaces
Hostile
11. Distribution: Accessing the
Customer
12. BoP markets essentially
allow us to challenge the
conventional wisdom in the
delivery of products and
services
EXPLANATION
More than just lowering prices, it is important to review
completely the cost structure and offer a different pricing
approach. “Traditional approaches to reducing prices by 5 to
10 percent will not suffice” (p. 30).
To operate at BoP is much more than creating simple versions
of products. It is necessary to develop solutions based on
advanced technology combined with existing (and evolving)
infrastructure.
The size of the market demands scalable operations.
Solutions for this market should be sustainable and
ecologically friendly. The planet cannot afford including
another 4 billion people with the same pattern of consumption.
Functionality needed in emerging markets is not always the
same as in developed countries.
“Process innovation is a critical step in making products and
services affordable for the poor. How to deliver is as
important as what to deliver” (p. 37).
The lack of formal education demands a simplified work for
the employees.
In the same way, as customers do not have formal education,
it is important to present them the appropriate use and benefits
of specific products and services.
The fragile infrastructure of emerging markets has to be
considered in the developing process.
The interfaces with customers have to be simple so as to
facilitate the use of the products and services.
“Distribution systems that reach the BoP are critical for
developing this market. Innovations in distribution are as
critical as product and process innovations” (p. 43).
“By its nature, success in BoP markets will break existing
paradigms” (p. 45).
Source: Based on Prahalad (2005)
Brand is also an important asset of the companies. For instance Kempen (2004, p.221)
found out in a field experiment that “a substantial proportion of the urban poor in developing
countries is willing to pay for a designer label as a symbol”. Apparently, this fact has two main
reasons:
a.
Designer labels are a symbol of status and integration within society. As they buy
a branded product, poor people feel as if they belong to society and are not
excluded.
40
b.
It is a kind of differentiation from extremely poor people, who cannot afford these
products.
Besides that, poor people tend to be more loyal to branded products because they cannot
make mistakes. If a product does not deliver the expected value, BoP consumers will not be able
to buy another new product. They will have to use the product until the end. The financial risk is
too high. So buying branded products is a rational purchase, since it assures the expected deliver
(PRAHALAD, 2005).
No one doubts about the importance of price for a consumer with a limited budget.
Nevertheless, besides the many researches already discussed before which show that the poor
usually pay more for the same products, new studies demonstrate that sometimes price is not the
main driver for store patronage (PARENTE, 2005) and that there are some consumer clusters of
low income people which are not driven by prices (D’ANDREA; LUNARDINI, 2005). More
than the real price, the perception that consumers have is the most important factor in deciding a
purchase (PARENTE, 2005). This leads to ethical issues that will be further discussed in section
2.2.8.
Few researches and studies explored the differences in communication that should be
accomplished to reach low income populations. Most of the studies are still much more focused
just on the lack of formal education and low literacy rates and the need of a simple
communication for this population.
Regarding distribution, some case studies illustrate the importance of door-to-door sales,
as for instance, the Unilever Shakti program (that will be explained in section 2.3.6). Also, smallscale, decentralized initiatives may make more sense in low-income markets than the developed
world mantra of centralization of control and economies of scale (CHRISTENSEN et al, 2001;
LONDON; HART, 2004).
Few authors discuss distribution strategies for BoP. For instance, Vachani and Smith
(2008) identified three creative market-based alternatives to overcome the difficulties of
distributing products and services in rural areas in India:
▪ Taking cost out. This approach increases access by lowering the costs of
distribution.
41
▪ Reinventing the marketing channel. This approach increases access through
innovation, by identifying different routes for reaching rural consumers and for
rural producers to get their products to market. New technologies provide one
type of solution. Other solutions come in business process redesign.
▪ Taking the long-term view and investing for the future. This approach entails
increased private sector investment anticipating a long-term payback and/or as a
social commitment (VACHANI; SMITH, 2008, p. 57).
Griffith et al (2005) also analyzed channels of distribution in India, however with the
focus on United States MNCs operations in the country. Three strategic initiatives were identified
in their research: (a) tiering distribution, which means, using multiple tiers or distribution levels
to reach consumers; (b) partnering with regional firms to overcome distribution challenges while
enhancing their reach across the market, and (c) creating tailored distribution specific for the
MNC.
Parente and Barki (2006) identified three generic strategies that retail companies could
successfully use to operate in low income markets. These strategies are lined up with Porter’s
generic strategies:
•
Emphasis on low price: Retailers that have their strength in a low cost-low price
strategy, offering few services in a store atmosphere with no frills.
•
Emphasis on benefits: On opposition, some retailers offer, even for low income
consumers, high prices but with more benefits, such as services, excellent visual
merchandising, good assortment and more enthusiastic and numerous sales
attendants.
•
Emphasis on proximity: Some retailers still have an important competitive
advantage based on proximity, due to the difficulty that large and medium retailers
have to reach some localities.
According to Varotto (2007), the relationship strategies, mainly among wholesalers and
small retailers in low income neighborhoods in Brazil, are focused mainly on the transactional
relationship. However, owing to the increasing competition with large companies, small retailers
are demanding a more cooperative relationship with their suppliers, encouraging wholesalers to
adopt strategies that are not based just on price.
42
2.2.6
BoP consumer behavior
Despite the common sense that a good “strategy for any serious emerging market player is
to understand and cater to local consumers’ current needs, and evolve with them, as they grow
more affluent” (DAWAR; CHATTOPADHYAY, 2002, p. 459), the international literature that
analyzes more deeply the differences in cultural, social and consumption behavior of BoP
consumers is still scarce. This section aims at identifying just some peculiarities of BoP consumer
behavior that are relevant to the understanding of the Brazilian market without any intention to be
exhaustive.
Barki (2005) based on many researches made in Brazil on some characteristics of BoP
consumer, identified the most relevant peculiarities of low income consumer behavior; which can
be summarized as follows:
•
Values and conservativeness – BoP has a more conservative behavior, when compared
to the high income population.
•
Abundance – The like for abundance can be observed in different contexts: In the
households, it can be seen in the abundance of food, as for instance, when receiving
relatives and friends; while in the stores, the quantity of products exposed indicates
that the store is generous and offers low prices.
•
Low Self-esteem – As they are poor, low income consumers feel as being inferior and
considered ‘second class citizens’. The camouflaged, but intense, racial prejudice
increase this feeling. As Prahalad (2005, p. 20) states:
When the poor are converted into consumers, they get more than access to
products and services. They acquire the dignity of attention and choices from the
private sector that were previously reserved for the middle-class and rich.
•
Dignity – BoP demonstrates a high concern with maintaining their dignity and not
being treated as a dishonest person. The low income consumer feels discomfort with
some routine retail practices, such as close employees, sealed bags, revolving doors or
being required to show proof of income and address (AGUIAR et al, 2008). He
43
perceives these practices as insinuations of lack of trust. As pointed by Prahalad
(2005, p. 20):
Both sides—the large firms and the BOP consumers—have traditionally not
trusted each other. The mistrust runs deep. However, private-sector firms
approaching the BOP market must focus on building trust between themselves
and the consumers”.
Brand Loyalty – BoP consumers demonstrate, in general, higher loyalty for known brands
and there is little room for experimentation, since the limited budget inhibits the risk
associated to new products. Furthermore, brands differentiate poor from extremely poor
and have a strong status appeal. As Kempen (2004, p. 222) states:
Those who earn an income above this level, although still poor, have the
opportunity to differentiate themselves from the poorer group by consuming
designer products. Hence, there is room for status-seeking based on wealth
disparities. Second, the support given to the compensatory consumption thesis
by the data is a direct indication of status-oriented consumer behavior. Subjects
who are unable to gain status because of their poor educational profile pay a
relatively high symbolic premium on the designer label.
•
The paradox of power and frustration – With few entertainment alternatives, store
visits represent a source of leisure. In the purchase process, consumers demonstrate a
lot of pleasure and also reveal a “Power” feeling. On the other side, the limited budget
causes constant frustrations.
•
Exclusive versus Inclusive – While high income classes prefer exclusive products that
offer an exclusivity image, so that the individual feel unique; low income consumers
look for products with the inclusion ideal that give a feeling of belonging. This
consumer is used to be excluded and the consumption is a way of being part of
society.
•
Face to face contact – Brazilian popular culture values face to face contact. BoP
people like to interact.
Furthermore, Mattoso (2005) identified some other characteristics:
44
•
Immediate Gratuity – BoP people say it is impossible to save, but most of them pay
some kind of installment for a product.
•
Solidarity – BoP communities tend to create a strong social network, in which one
helps the other. The Grameen Bank experience shows that this might be true in other
places around the world.
2.2.7
Sustainability, clean technology and poverty alleviation
There is an increasing pressure for companies to play an important role in sustainable
issues, such as environmental problems and poverty eradication all over the world, creating a
more inclusive capitalism (LONDON; HART, 2004; McFALLS, 2007).
One of the main concerns when discussing market inclusion of BoP consumers is
sustainability. Two main questions arise: a) how to include 4 billion people in the consumption
market without damaging the environment; and b) how to improve income of the poor and not
only try to sell to the poor.
As seen before, the answer is in identifying the right approach and the right business
model. It is much more than adapting some products or creating Corporate Social Responsibility
(CSR) programs. According to Jenkins (2005, p. 540), “CSR as currently practiced is unlikely to
play a significant role in reducing poverty in developing countries, despite the enthusiasm of
many development agencies”.
Despite of the difficulties, many authors believe that companies can make profit and
simultaneously reduce poverty in a sustainable way (HART; CHRISTENSEN, 2002;
PRAHALAD, 2005). As pointed out by Chesbrough et al (2006, p.49), “those products backed
by organizations with a strong focus on the development of a comprehensive business model
were able to develop commercially sustainable products”
One way to create sustainable products is through “Clean Technology”, the new
sustainable technologies that dramatically reduce or eliminate the human footprint on the planet.
One possibility advocated by Hart (2008a, p.4) is
45
To merge Clean Technology and Base of the Pyramid in a ‘Great Convergence’.
The Great Convergence recognizes that clean technologies are almost always
“disruptive” in character (e.g. distributed generation, point-of-use water). That
is, they threaten incumbents in current served markets at the top of the pyramid.
As a result, the BoP is often the best place to focus initial commercialization
attention. At the same time, the Great Convergence also recognizes that
successful strategies must be co-created with underserved communities and local
partners so as to ensure culture fit, rather than imposing technological solutions
from the top down.
Businesses can also help in poverty alleviation. Wilson and Wilson (2006) believe that
large companies have an important role in poverty alleviation, as they are an important engine
that stimulates economies, employment and therefore increase the income of the poor. Besides
allowing access to products and services, companies are an essential part of economic growth,
they pay taxes, employ people and use many local resources. As Hart (2008b, p. xi) states, “as
business people, we should begin to think of the poor as ‘colleagues’ and ‘partners’ engaged in
the co-creation of entirely new businesses that generate mutual value”.
According to some authors (LANDRUM, 2007; KARNANI, 2007), the main concern
when discussing BoP markets should be the inclusion of the poor in production. At present, some
few cases are being studied and described of how poor communities can be engaged in
production (YUNUS, 2007; KANDACHAR; HALME, 2008). Research by the World Bank and
United Nations has shown that the expansion of employment and entrepreneurial opportunities is
the single most important pathway out of poverty (NELSON et al, 2009).
This discussion has the potential to be an important node in defining distribution
strategies to the BoP markets. Firstly, because many people work in the marketing channels and
there is a potential to include and/or train many people. Secondly, a CSR work at small retails
might create an emotional link with the communities that might strengthen brand equity. Finally,
due to fuel use, environmental impact of distribution strategies might need to be rethought.
2.2.8
Criticisms and Ethics
As successful cases were not so vast in BoP markets, some criticisms appear (JENKINS,
2005; WILSON; WILSON, 2006; KARNANI, 2007) praying that the “BoP approach” proposed
46
by Prahalad was much more about selling to the poor and having more profits and less about
helping the poor and eradicating poverty.
One of the main criticisms is that purely profit-driven models would not improve poor
lives. It would just increase short-term satisfaction, but not necessarily long term welfare
(JENKINS, 2005; WILSON et al, 2008). Some authors go beyond. Karnani (2007), for instance,
states that MNCs weren’t either doing good nor making profits and the Government should lead
this process, because the main issue is how to increase the poor’s income and it could only (or
preferably) be done by public policies.
A second criticism made for the BoP paradigm is that sometimes it damages the
environment. For instance, one strategy to “sell more” to low income populations is to reduce
packages, a common practice in India (PRAHALAD, 2005). However, the proliferation of single
serve packages has a negative impact on the environment (KARNANI, 2007).
A third criticism is the strategy used by many companies of giving credit for consumers to
buy products, as for instance the classical case of Casas Bahia in Brazil. At the BoP paradigm this
can be seen as the main (or only) way to offer access to products for a population with difficulties
to save money. However, for the critics, this is another fallacy and low income consumers spend
more and pay high interests when they should be better advised to save money and pay in cash
(KARNANI, 2007; HUDON, 2008).
A fourth and important criticism is about the role of MNCs. Karnani (2007) believes that
Government (and not large companies) have a central role in poverty alleviation and “the best
way for private firms to help eradicate poverty is to invest in upgrading the skills and
productivity of the poor and to help create more employment opportunities for them” (p. 109).
Besides, there is a discussion that this market is not profitable and success cases are limited and
mostly, fulfilled by local and small companies (KARNANI, 2007; LANDRUM, 2007).
Another criticism is that poor people, because of lack of education and information are
easy targets for marketing strategies that persuade them to purchase something that they didn’t
need or that it is superficial. One example given is of the poor guy who spends $0.20/day on
tobacco and when asked if his three children ever eat eggs, he exclaimed, “Eggs? Where will the
money come from to buy them?” Yet, if he didn’t buy tobacco, each of his children could eat an
egg a day, or other nutritious foods, and be healthier as a result (KARNANI, 2007). This point
47
emphasizes the importance of an ethical approach to marketing strategies for low income
markets. As discussed previously, the perception of a product/service has an important impact on
consumption and MNCs can use their power to convince people who don’t have the tools to
make a well informed choice (KARNANI, 2007).
A sixth criticism is that MNCs don’t have long term commitment to adjust their business
models and create breakthrough models. Firms are still concerned with short term, quarterly
results and it is difficult to implement new approaches in emerging markets. There are still many
limitations for MNCs to operate an inclusive capitalism (MCFALLS, 2007).
There are some criticisms also concerning the size of the market. Some authors believe
that the market is much smaller and there is not such a fortune to be sought (JENKINS, 2005;
LANDRUM, 2007; KARNANI, 2007).
2.2.9
New business models
One of the main challenges for companies that want to operate at BoP is to develop the
right business model. Operating at low income markets is much more than developing or
adapting the product, reaching the market, finding out the correct pricing strategy and
communicating efficiently. Companies must thoroughly understand the market, invest in the long
term and develop the right business model. Or as Prahalad (2005, p. 49) points out, that “the BoP
can be a source of innovations for not only products and processes, but business models as well”.
The business models have to be adapted for the BoP environment. “Scalability, flexibility,
decentralization, knowledge sharing, local sourcing, fragmented distribution, non-traditional
partners, societal performance, and local entrepreneurship appear to be important to the success
of such business ventures”. (LONDON; HART, 2004, p. 18).
The approaches to BoP have changed a lot in recent years and incorporate much of the
criticisms, the sustainability challenges and include the view of BoP as producers and consumers
as previously discussed. In the literature, it is possible to identify at least four different business
models for large companies to reach BoP.
48
The first one is based on partnerships between MNCs and NGOs (BRUGMANN;
PRAHALAD, 2007; SEELOS; MAIR, 2007). MNCs have the technology and capital and NGOs
the knowledge about the communities’ needs.
The second business model is inspired by the Nobel Prize Yunus and is based on the
structure of a “Social Business”, where the main objective of the company is the social impact
and not necessarily profits (YUNUS, 2007).
The third business model is structured on the concept of co-creation with the communities.
While Brugmann and Prahalad (2007) emphasizes the importance of co-creation between MNCs
and NGOs, Simanis and Hart (2008) believe that the success at BoP and improvement of poor
welfare will only happen with the engagement of the communities. This new competence is
termed “social embeddedness” or “native capability” (LONDON, 2008).
The fourth business model is used by for profit companies that take advantage of their
existing businesses to make incremental improves to reach BoP markets. Companies just adapt
their business model to operate in a more appropriate way at BoP. Despite being the most used
model, the lack of success cases show that there is still a lot to be improved.
The first three business models aim at establishing a more inclusive approach. In other
words, according to these models, corporations seek the “fortune at the Bottom of the pyramid”
(profits) and the welfare of the population. The fourth is usually a much more profit based
approach.
The four business models are discussed below:
2.2.9.1 Incremental Innovation
The first business model is not exactly a new one. It is actually just an improvement and
adaptation of existing strategies to better serve BoP. When operating in emerging markets, most
MNCs started adjusting their strategies, without making substantial changes. Consequently, many
of these companies couldn’t understand the peculiarities of the market and failed (KHANA;
PALEPU, 2006).
Despite the need to get things done differently, most companies just adapted part of their
solution and didn’t create new approaches. Examples of incremental innovations are: selling
49
through smaller packages, redefining cost structure, reducing margins and prices, simplifying
communications and so on.
Certainly these strategies were important to develop new markets and explore the
potential of BoP. However, they just scratched the surface and weren’t able to innovate and
create new ventures and opportunities. Moreover, these strategies pushed the market and
increased demand, but also had a negative impact on sustainability and the environment.
As criticisms got louder and successes were not so numerous, MNCs and large companies
had to rethink their business models and approaches to BoP so as to contemplate the
sustainability aspect as well as the engagement in solutions of civil society, communities and
even consumers. Therefore new business models appeared. Nevertheless, still many companies
are still oriented on the incremental innovation approach, just trying to adapt their products,
prices, communication and distribution.
2.2.9.2 Partnerships with local businesses and NGOs
The second business model is based on the assumption that MNCs have to partner with
local companies or NGOs, because they are not able to face the hurdles and informal competition
of emerging markets. Only with these partnerships, it will be possible to effectively address
poverty reduction, promote environmental sustainability and achieve the aimed profits, in other
words, the triple bottom line (WILSON et al, 2008).
Non-corporate partners can play an important role in business development and be
useful to provide access to important information that is not available in another way. (HART;
SHARMA, 2004; LONDON; HART, 2004).
When entering base of the pyramid markets, however, firms may need to expand
dramatically the potential field of alliance partners. Indeed, our analysis
indicated that successful base-of-the-pyramid strategies relied heavily on nontraditional partners. These partners included non-profit organizations and
community groups, as well as local and even village-level governments.
Unsuccessful strategies, on the other hand, relied primarily on traditional
partners such as national governments and large local companies (LONDON;
HART, 2004, p. 12).
50
In the same direction, Brugmann and Prahalad (2007) concluded that there is a shift in
corporate management, with a growing importance of not-for-profit organizations in the
development of new business models in emerging markets. They identified three stages in the
convergence of objectives and operations of corporate businesses and civil society.
PRECONVERGENCE
STAGE TWO
Companies and NGOs adopt
different attitudes toward
liberalization and globalization.
They quarrel over the
nature and speed of
deregulation. They fight over
companies’ conduct, especially
in developing countries.
Some companies get into bottom
of- the-pyramid segments and
niche markets even as NGOs set
up businesses in those markets.
Companies and NGOs try to learn
from, and work with, each other.
STAGE ONE
Companies and NGOs realize they
have to coexist. They look for ways
to influence each other. Some
corporations and NGOs execute
joint social responsibility projects.
STAGE THREE
Companies and NGOs enter
into cocreation business
relationships. Cocreation
entails the development of
business models in which
companies become a key part
of NGOs’ capacity to deliver
value and vice versa.
Figure 2-4: The Three stages in the convergence between corporate sector and civil
society
Source: Brugmann and Prahalad (2007)
According to the authors, at the present moment:
Cocreation involves the development of an integrated business model in which
the company becomes a key part of the NGO’s capacity to deliver value and vice
versa. Such ventures offer three opportunities:
• To deliver products at low prices to low-income consumers or to provide niche
products to consumers in mature markets.
• To create hybrid business models involving corporations, NGOs, and
entrepreneurs at the bottom of the economic ladder.
• To revive the corporation’s social legitimacy while expanding the NGO’s
impact (BRUGMANN; PRAHALAD, 2007, p. 89).
51
Furthermore, Seelos and Mair (2007) state that there is an opportunity for MNCs to
develop business models based on partnerships with local businesses. Besides allowing MNCs to
get preferential access to resources and capabilities necessary to operate adequately at emerging
markets, these partnerships create the possibility to increase BoP income.
According to them, two important characteristics of these partnerships are:
(a) Partners are managed totally independently based on their unique processes,
culture, and norms, and (b) the partners explicitly go about maximizing their
own private benefits (SEELOS; MAIR, 2007, p. 60).
2.2.9.3 Social Entrepreneurship and Social Business
Social entrepreneurship seeks creative and innovative thinking to solve seemingly
intractable social problems. It has become a popular concept, with many foundations, like
Ashoka, Skoll and Schwab, dedicated to this issue (YUNUS, 2007).
Seelos and Mair (2005, p. 243) define Social Entrepreneurship as:
Social entrepreneurship creates new models for the provision of products and
services that cater directly to basic human needs that remain unsatisfied by
current economic or social institutions.
Differently from other businesses, social entrepreneurship’s main goal is the creation of
social value. Grameen Bank is an example of Social Entrepreneurship that operates at BoP
(SEELOS; MAIR, 2005; YUNUS, 2007). Some facts illustrate the social value created by the
company:
•
The owners of the bank are the borrowers.
•
Borrowers are typically poor women.
•
The loans are given to a group of women that form Self Help Groups.
The Social Entrepreneurship has a capacity to create new business models in places and
markets that large companies cannot reach or are not encouraged to operate.
Aiming at a more inclusive capitalism without poverty, the Nobel Prize Muhammad
Yunus conceived the concept of “Social Business”, which would be a business with objectives
52
other than profits – a business that is totally dedicated to solving social and environmental
problems. “A social business is a company that is cause-driven rather than profit-driven, with the
potential to act as a change agent for the world” (YUNUS, 2007, p. 22).
According to Yunus (2007) there are three kinds of social businesses:
a. Companies that aim primarily at maximizing social benefits instead of
profits for the owners and that are owned by investors who seek social
benefits such as poverty reduction.
b. Companies owned by poor people that aim at profit maximization so
that the dividends go to the poor. In this case, the social benefit created
comes from its ownership.
c. A combination of the first two models. A company that aims at social
benefits and is owned by the poor and disadvantaged.
An example of the first model is Grammen Bank. The company grants small loans
available without collateral and at a reasonable interests to the poor, thereby enabling them to
start or expand any tiny businesses and ultimately lift themselves out of poverty and is owned by
the poor: 94% of the ownership shares are held by the borrowers themselves.
The joint venture between Grameen Bank and Danone is an example of the second model.
Both companies joined in 2007 in Bangladesh and created a new company whose main objective
was to “reduce poverty by a unique proximity business model which brings daily healthy
nutrition to the poor”.
The success of this business model is based on the integration of social objectives with
corporate management and on the partnership of an MNC (Danone) with plenty of financial and
personnel resources and a local company (Grameen) with local knowledge.
There is a slight difference between “Social Business” and “Social Entrepreneurship”.
The last one is a very broad idea, which is generally defined as any innovative initiative to help
people.
The initiative may be economic or non-economic, for-profit or not-for-profit.
Distributing free medicine to the sick can be an example of social
entrepreneurship… In other words, social business is a subset of social
entrepreneurship. All those who design and run social businesses are social
53
entrepreneurship. But not all social entrepreneurship are engaged in social
business (YUNUS, 2007, p. 32).
2.2.9.4 Co-creation with communities (Embedded Innovation)
This business model was proposed by Simanis and Hart (2008) in the known “BOP
Protocol”. In this report, based on some field cases, the authors propose a whole new strategy to
reach the 4 billion poor, the so called “BoP 2.0”, which would be a new vision of how to reach
the market. As a matter of fact, this vision is quite close to the three strategies proposed by
London and Hart (2004) and discussed in item 2.2.4.
The old view (“BoP 1.0”) was based on the logic of “Selling to the poor”, in which
companies engaged in “the latest form of corporate imperialism” tried to target the poor with few
adaptations and a superficial understanding of their needs. Besides viewing the poor just as
consumers and trying to get the maximum value from them, these strategies had little success and
an increasing critic chorus.
The “second-generation BoP strategy requires an embedded process of co-invention and
business co-creation that brings corporations into close, personal business partnership with BoP
communities” (SIMANIS; HART, 2008, p.2). The main idea is that companies go to BoP
communities with an open mind (and not just trying to push some products) to co-create new
products and new business models. The corporation together with the community and NGOs
could jointly develop new business ideas. It is a long term and quite expensive approach, that
should be seen as an R&D investment and that the long term results surpass these investments.
The table below shows the differences between the “BoP 1.0” and “BoP 2.0” approaches:
54
Table 2.4: Next Generation BoP Strategy
BOP 1.0
BoP as consumer
Deep listening
Reduce price points
Redesign packaging, extend
distribution
Arm’s length relationships
mediated by NGOs
“Selling to the Poor”
BOP 2.0
BoP as business partner
Deep dialogue
Expand imagination
Marry capabilities, build shared
Commitment
Direct, personal
relationships
facilitated by NGOs
“Business Co-Venturing”
Source: Simanis and Hart (2008, p. 2)
According to Simanis and Hart (2009, p.85),
The BoP Protocol consists of three phases that take approximately three years to
complete depending on a company’s base level of capability and established incountry relationships. The three phases include:
• Phase I: Opening Up – Phase I begins with a company immersion in the
community using homestays to build rapport and trust, and it culminates with
the cocreation of a business concept together with a core team of community
partners. The output is an actionable, cocreated business concept and local
market ‘buzz’.
• Phase II: Building the Ecosystem – Phase II begins formalizing a new
business organization with the core partners and creates an initial brand
product/service offering through intensive action learning that engages the
wider community. The output is a community-tested business prototype and
local market champions.
• Phase III: Enterprise Creation – In Phase III , the company and core
partners reach out to an even broader community segment with action
learning and small scale tests to evolve a working business model and build
local management capacity sufficient to manage and grow the business
independently. The output is a locally-embedded business and a committed
local market.
In this embedded view there is a business intimacy with the community. It is more than
just a deep listening of the customer with a lot of consumer research or the mass customization of
products and services to match individual tastes. This intimacy business model instills mutual
responsibility across the community for the growth and success of the new enterprise.
55
2.2.10 Summary and conclusions of BoP Knowledge
BoP knowledge has evolved a lot in recent years. From a vision of the poverty penalty
from the 1960’s it turned into a vision of the importance and potential of low income markets and
more recently into a definition of business models to reach the global poor.
As a new knowledge field, there are many different views and approaches to the BoP.
There is the discussion of the role of MNCs and large companies to help eradicating poverty, the
environmental impact of the inclusion of 4 billion new consumers, and more importantly whether
it is really possible to create a profitable, sustainable, scalable business model that can also take
people out of poverty.
Most of the discussion is still based on case studies and there is not a consensus on the
impact of these initiatives on businesses as well as on the poor. Out of that it is possible to
identify some elements of a BoP Business Model.
Distribution arises repeatedly as an obstacle to scale and business viability for socially
beneficial products and services. One of the main difficulties of any business model is to manage
the access to the BoP population not only in rural areas, but also in the slums of urban areas.
All business models analyzed are based on partnerships, indicating the difficulty for a
company to operate in a hurdled environment. NGOs, private and local companies can join
strengths and knowledge of each organization so as to create a more effective business model.
In order to build a strong relationship and get access to scattered, distant and different
communities, one important element that appeared is social embeddedness, which allows a
trusting relationship between companies and consumers. “Social embeddedness is the integration
into diverse local networks that leads to the development of long-term and cooperative
relationships and which may result in the achievement of common benefits for all the players
involved in the network” (SANCHEZ et al, 2006, p.20).
The consumption inclusion seeks to create products and/or services that are aligned to
the needs and values of low income consumers. The objective is to understand their real
aspirations and prevent the trap of selling cheap and low quality products. The challenge is to ally
quality and competitive prices, valorizing the consumer and offering him the possibility to him to
feel included in a society dominated by consumption.
56
The production inclusion is an important tool of social inclusion through income
generation. It looks for mechanisms in which low income population can participate of the means
of production, which can be placed in all parts of the channel value. Micro credit can have an
important role to enhance these practices.
It has also been recognized the need for companies to innovate, think out of the box and
act differently. BoP markets are a fertile terrain for disruptive innovation. This is due to two main
reasons: business models created in low income markets are more adaptable than those defined in
high income markets; and in emerging markets, innovators also compete against nonconsumption, creating a whole new market, that otherwise would be left to poor versions of what
is available in high-end markets (HART; CHRISTENSEN, 2002).
As the BoP population is huge and spread out in many countries, scalability is a main
element of the business model. Scale is a central concern for any business model intending to
serve the base of the pyramid. “Reaching scale is difficult for any enterprise, and even more
difficult for one aiming to serve or engage the poor and do so by providing socially beneficial
products and services and do it in a financially self-sustaining way” (KARAMCHANDANI et al,
2009, p. 27).
The environmental sustainability is related to the necessity of creating products and
services that don’t damage the planet even more. This is relevant for every business, but is
essential at BoP, with another 4 billion people being included in consumption.
Although some business models described before do not seek profit to distribute to
stakeholders, profitability is also important to maintain the business in the long run. Even
though, the owners do not receive the dividends, the economic sustainability of a company is
crucial for its continuity.
The greatest challenge is to create business models that allow an integration of all
the elements described above. The objective is to develop a business model based on partnerships
that generates income for the poor, profit for the organization, and is scalable and sustainable. In
addition, it should include low income population in consumption, in such a way that they feel
valorized. With so many challenges, business models at BoP are driven by innovation that could
be ‘exported’ to developed countries.
57
2.3
Marketing Channels
This section defines marketing channels and presents its relevance, describes a channel
structure and the intermediaries’ functions. Afterwards, it discusses pull and push strategies and
relationship. Those concepts were introduced because they strongly appeared in the empirical
research and, in the process of constant comparison with the literature (see section 3.4), they
were included in the knowledge review. Finally, the fourth part of this section maps some global
distribution strategies adopted by companies in order to identify some of their innovations and
key success factors.
2.3.1
Definition of Marketing Channels
Marketing channels can be defined as “sets of interdependent organizations involved in the
process of making a product or service available for consumption or use” (STERN et al, 1996, p.
1). Marketing channels are important not only to supply goods and services, but also to stimulate
demand, creating value to end-users by generating form, possession, time and place utilities
(STERN et al, 1996).
Marketing channels have been discussed and their importance recognized for almost one
century (WELD, 1917; CLARK, 1921). Butler5 (1917, apud ROSENBLOOM 2007) argued that
marketing channels were important to link specialized and large scale industries with the more
demanding needs of consumers. Essentially, marketing channels in the 1920s - represented
basically by wholesalers and retailers – “were seen as arising in distribution channels to perform
services (marketing functions) needed by manufacturers and final customers” (ROSENBLOOM,
2007, p. 329). In the first half of last century, the perception of the role of distribution was so
central to the marketing context that, in 1948, the American Marketing Association defined
marketing as “the performance of business activities directed toward, and incident to, the flow of
goods and services from producer to consumer or user” (WEBSTER, 1992).
Since then, distribution and exchange transactions have always been one of the main issues
in marketing studies (ALDERSON; MARTIN, 1965; BAGOZZI, 1975; HUNT, 1983;
5
Butler, R. S. (1917) Marketing Methods (New York: Alexander Hamilton Institute).
58
WEBSTER, 1992). Some authors believe that the best networked firms with a well established
marketing channel have a competitive advantage (SRIVASTAVA et al, 1998; DAY, 2000).
Nowadays, with the proliferation of channel options, the strategic role of distribution is even
more disseminated (KABADAYI et al, 2007). Furthermore, marketing channels can be
considered an important resource a company has, which is difficult to manage, and hard for rivals
to understand, copy, or displace (HYVÖNEN; TUOMINEN, 2007).
The need to better understand marketing channels is very relevant at BoP, where one of
the main issues is the access to a spread population in a hurdled infrastructure.
2.3.2
Channel Structure
The relationship between producers and the final consumer may need some enterprises that
make the supply and demand of products and services possible. On one side, producers want to
sell great quantities and maximize profits, and, on the other side, the final consumer demands for
its surviving quantities and prices adapted to his needs. Marketing channels form the set of paths
that a product or service follows from production to its use by the final consumer.
The emergence of distribution oriented firms that form a marketing channel can be
explained by four points (STERN et al, 1996):
•
Intermediaries improve the efficiency of the process: A decentralized system of
exchange is less efficient than a centralized network that uses intermediaries.
•
Intermediaries adjust the discrepancies of assortment: The marketing channel has
the role of bridging the discrepancy between the assortment of goods and services
generated by the supplier and those demanded by consumers.
•
Marketing channels provide routinization of transactions: Each transaction involves
a number of activities such as frequency of delivery and payment, communication
etc. The routinization of these activities diminishes the transaction costs, reduces
the number of contacts and improves efficiency.
•
Marketing channels facilitate the searching process: Marketing channels facilitate
the searching process because they diminish the uncertainty of suppliers about
59
consumers’ needs and the uncertainty consumers have that they will find what they
want in the right place and at the right moment.
When designing a marketing channel, two main decisions have to be made: the first
determines the number of levels between the supplier and the consumer and the second
determines, for a given number of levels, the intensity of the selected structure (for example,
number of intermediaries) and policies regarding channel management, such as trade discounts
(RANGAN; JAIKUMAR, 1991).
The figure below presents the kinds of intermediaries for consumer goods and the different
possible channel structures in a market.
Level Two
Level Three
Level Four
Level Five
Producer
Producer
Producer
Producer
Sales Agent
Wholesale
Wholesale
Retail
Retail
Retail
Consumer
Consumer
Consumer
Consumer
Figure 2-5: Channel structures for consumer goods.
Source: ROSENBLOOM (1999, p.23).
The number of intermediary levels between manufacturer and consumer can be defined as
channel length. As can be seen in Figure 2-5, it is possible to view different intermediaries’
levels between producer and consumer. A structure of Level Two is characterized by the
inexistence of intermediaries, where producers have a direct and individual relationship with
consumers, through internet or direct sales (for instance, Avon). In Level Three structure, there
is only one kind of intermediary – the retail – that buys, storages and resells to final consumers.
In Level Four structure, the intermediaries are composed of wholesales and retails. Usually,
wholesalers sell products from the producer to small and/or distant retailers. Finally, in Level
60
Five structure there is the role of the Sales agent, who makes the relationship between
wholesalers and producers.
It is more common for companies to use more than one kind of channel. Firms use online
channels simultaneously with sales force, sales representative, dealer channels, catalog channels,
call-center and door to door (MORIARTY; MORAN, 1990; KABADAYI et al, 2007).
The definition of a channel design is very important in developing a competitive strategy.
The prime requirement of a channel structure is to enhance effective delivery of the customer
value proposition (ANDERSON et al, 1997).
One issue under consideration is the impact of environmental factors (mainly economic
development) on channel length. However, there is not an agreement about this issue (OLSEN;
GRANZIN, 1990; JAFFE; YI, 2007). Some studies found out that channels lengthen as economic
development occurs, while others found out the opposite and still others found that the function is
U-shaped, i.e. channels first lengthen and then shorten (JAFFE; YI, 2007). After a research made
in China, Jaffe and Yi (2007, p. 488) indicated that “first, economic development provides the
need for more efficient channels, first lengthening as more intermediaries enter the distribution
system, but later shortening as the number of channel layers contracts as a result of efficiencies
such as vertical integration”. Although this is not the main purpose of this research, the length of
the marketing channel and its impact on efficiency will be discussed in the results analysis.
Furthermore, two related channel management considerations are the difficulty of
changing marketing channels once they are in place, as such a change could cause disruptive
conflicts and lead to a dysfunctional exercise of power. The second channel consideration
involves the constraints a company may find when developing and implementing the selected
channel (RANGAN et al, 1992).
This second consideration is of extreme importance when discussing BoP, because in
such markets, the most appropriate channel design might not be ready. For example, the best
alternative for an industry to distribute its products might be using formal wholesalers and formal
retailers, but in some places such entities do not exist, so the company has to innovate or use
options which are not optimal.
61
In Latin America there are few companies that are able to distribute their
products directly to retail, mainly because of the cost of serving a huge territory
and the enormous quantity of POS. The majority uses also indirect marketing
channels – wholesalers and distributors and others distribution agents. Several
new business models are appearing and the companies, confused with what is
happening, are questioning their distribution model (INTEGRATION, 2007)6.
At this point it is important to make a distinction between wholesalers and distributors.
According to the Brazilian Association of Distributors (ABAD)7:
WHOLESALERS: Distribution agent that buys and sells products from a producer with
whom he doesn’t have any link (formal or informal) of product and/or regional exclusivity.
DISTRIBUTORS: Distribution agent that buys and sells products from a producer with
whom he has a regional and/or product exclusivity.
In Brazil, there are many companies that operate as wholesalers for some producers and at
the same time as distributors for other producers. These companies can be characterized as
wholesalers and distributors.
2.3.3
Intermediaries functions
The main services offered by intermediaries to suppliers are (ROSENMBLOOM, 1999;
SOUZA, 2000):
1. Market coverage: Usually the markets are spread out in large geographic areas.
2. Sales Contact: It would be very costly for suppliers to maintaining a sales force, so
distributors are important to efficiently contact different clients.
3. Storage: Intermediaries diminish the cost and risk of maintain stocks by
manufacturers. Besides, this function helps suppliers to plan production.
4. Sales processing system: Intermediaries process a lot of requests from clients, which
would be very costly for manufacturers.
6
7
http://www.integration.com.br/atuacao.asp?area=1&subarea=2&prj=6&tipo=2. Accessed in 07 Sept 2007.
http://www.abad.com.br/index2.html. Accessed in 05 July 2009.
62
5. Market Information Collection: As the intermediaries are close to their clients, they
are a good source of market information related to products and consumers.
6. Client Support: Intermediaries may help their clients with many services such as
merchandising returns, adjusts, repairs and technical assistance.
Besides, intermediaries offer many services to their clients, such as (ROSENBLOOM,
1999):
1. Assortment: Intermediaries may offer a higher degree of product availability for their
clients, selling a wide variety of products and brands that simplify the clients’ choice.
2.
Fragmentation: Intermediaries can sell small quantities, which is essential when
dealing with small retailers.
3. Credit: The proximity and knowledge of the client, allow intermediaries to offer credit
and payment facilities for the small retailer. Given that cash is scarce, many times
traders must extend credit down to the retail level.
4. Consultancy: Intermediaries can help clients to sell more, assisting them in many
ways, like: product exposition, visual merchandising, sales promotion and training.
2.3.4
Pull and Push Strategies
There are two different kinds of strategies to distribute products: the pull and the push
strategy. In the first one, manufacturers create a strong demand for consumers of their product so
as to force the channel members to promote and sell them.
The second one is characterized to be a channel-directed support program, in which
manufacturers and channel members in a mutual and collaborative effort develop marketing
strategies for the product (ROSENMBLOOM, 1999).
There isn’t any conflict in using both strategies simultaneously, and, as a matter of fact,
they are usually used altogether successfully.
63
2.3.5
Relationships
During the past four decades, channel relationships have been an important area of
research in marketing. Relationship marketing focuses attention on how to develop and maintain
long-term, highly integrated relationships between customers and their suppliers (DWYER et al,
1987; RYLANDER et al, 1997).
There are many different definitions for relationship marketing. Morgan and Hunt (1994,
p.22), analyzing many different possibilities of marketing relationship, defined it as:
Relationship marketing refers to all marketing activities directed toward
establishing, developing, and maintaining successful relational exchanges.
Relational exchanges correspond to durable relationships governed primarily by some
norms and principles, involving close ties between partners. They differ from discrete
transactions, which have a short duration (DWYER et al, 1987). When the relationship evolves,
the accumulated relational capital becomes hardly imitable and transferable, turning into a source
of sustainable competitive advantage (IZQUIERDO et al, 2008)
Marketing literature is replete with perspectives that shed light on the underlying
characteristics of buyer–seller relationships (NARAYANDAS; RANGAN, 2004). For instance,
some authors discussed the constitution of partnerships and how they can be turned into an
important competitive advantage (WEBSTER, 1992; MENTZER et al, 2000; LAMBERT et al,
2004); others have studied how collaboration, commitment and trust have an important role in
defining
these
partnerships
(MOORMAN
et
al,
1992;
MORGAN;
HUNT,
1994;
SIMATUPANG; SRIDHARAN, 2005); and still others argue that continuity (ANDERSON;
WEITZ, 1989; SHAMDASANI; SHETH, 1995) and frequency (HEIDE; MINER, 1992) are very
important to strengthen relationship. There is also the discussion of the existence of power and its
impact on relationship (EL-ANSARY; STERN, 1972; WREN, 2007) and conflict management
(MORGAN; HUNT, 1994).
64
2.3.5.1 Partnerships
The partnership among firms is an increasingly common way for firms to find and
maintain competitive advantage. As markets get more competitive, members across the channel
are seen much more as partners (BROWN et al, 1995). Closer relationship and the management
of relational channel processes among manufacturers, distributors and retailers are opportunities
for the creation of competitive advantage (HYVÖNEN; TUOMINEN, 2007). A partnership is
constituted over time through social, economic, service and technical ties and it demands
common commitment, trust and objectives as well as communication and cooperation
(MENTZER et al, 2000; WREN, 2007).
According to Lambert et al (2004, p. 22),
a partnership is a tailored business relationship based on mutual trust, openness,
shared risk and shared rewards that results in business performance greater than
would he achieved by the two firms working together in the absence of
partnership.
Webster (1992) proposed a continuum (Figure 2-6) of possible relationships among
organizations that start with pure transactions, which would be the value exchange between two
organizations only once without any previous or future interaction. Afterwards, in this continuum
there are the repetitive transactions, as a frequent purchase of products and services. In the next
step there would be relationships with a contractual long range commitment. Subsequently, the
model continues with the partnerships that are characterized by the interdependence of the agents.
Afterwards there are the strategic alliances in which both parties commit resources and which
serves clear strategic purposes for both. In the next step there are network organizations that are
complex organizational structures resulting from several strategic alliances. Finally, there is the
vertical integration which consists of the control of the whole structure by a unique agent that
owns its property.
65
Transactions
Repeated
transactions
Long term
relationships
Buyer-seller
partnerships
(Mutual, total
dependence)
Strategic
alliances (inc.
joint ventures)
Network
organizations
Vertical
Integration
Figure 2-6: The range of Marketing
Source: WEBSTER (1992, p. 5).
Still according to Webster (1992, p. 9),
Instead of vertical integration being the preferred model, the network paradigm
is built around the assumption that smaller is better, that each part or process or
function should be the responsibility of a specialized entity, efficiently organized
and managed, that has world class competence.
This statement is in accordance with the discussion treated before about the relevance of
marketing channels.
According to Durand (2003), in Brazil wholesalers and distributors can be placed on the
continuum as follows:
•
Wholesalers have Long term relationships.
•
Distributors that are exclusive in the category but also work with other
manufacturers in different categories are in the buyer-seller partnership.
•
Distributors with total exclusivity (don’t work with other manufacturer) have
strategic alliance, since manufacturers and distributors commit many resources to
the partnership, which demands a high level of collaboration and common
planning.
66
It is possible to perceive that channel members ties are changing from an ‘arm´s length’
arrangement (close to the idea of long term partnership) to strategic alliances (HEIDE; JOHN,
1990).
Partnerships seem to have also a key role in BoP distribution models. It is quite difficult
for a firm (mainly a large one) to reach the BoP consumer alone without strong relationships with
other organizations like local companies and NGOs.
In their research with small retailers from São Paulo (Brazil), in a product category
frequently purchased, of consumable convenience good, with a unit consumer price always less
than $2, Lenartowicz and Balasubramanian (2009), found out that small retailers framed their
decisions in heuristics (simplified decision practices) mechanisms, such as defining their
purchase in terms of “last week’s sales”.
Besides heuristics not being the best managerial decision, because of its informality and
the fact that it doesn’t consider many factors, when heuristics are used, the distributor’s sales
force can more strongly influence retail decisions. This can be an opportunity for collaboration
among members of the channel, with mutual benefits.
2.3.5.2 Relationship Marketing
According to Morgan and Hunt (1994, p. 20), “relationship marketing is part of the
developing ‘network paradigm’, which recognizes that global competition occurs increasingly
between networks of firms”. Moreover relationship marketing is important because it is
considered a competitive advantage, difficult to copy (DAY, 2000). Relationship marketing aims
at maintaining a long term partnership and is based on collaboration between partners.
In their seminal article, Morgan and Hunt (1994) theorize that successful relationship
marketing requires relationship commitment and trust and create a model in which these concepts
are key mediating variables. Their model is presented below.
67
Relationship
Termination
Costs
Acquiescence
+
Relationship
Benefits
+
+
Relationship
Commitment
+
+
Shared Values
Propensity to
leave
+
Cooperation
+
+
Trust
Communication
+
+
-
Functional
Conflict
Opportunistic
Behavior
Uncertainty
Figure 2-7: Key Mediating Variable (KMV) Model
Source: Morgan; Hunt (1994, p. 22)
According to this model, commitment and trust are mediating variables and trust is the
most important determinant of commitment. Relationship terminating costs, relationship benefits,
shared values, communication and opportunistic behavior are the antecedents of a relationship.
Relationship terminating costs are all expected losses related to the end of a
relationship. According to Dwyer et al (1987, p. 14) "the buyer's anticipation of high switching
costs gives rise to the buyer's interest in maintaining a quality relationship”. Therefore, the
expectation of high terminating costs creates dependence and can be defined as an antecedent of
commitment.
Relationship benefits are related to the added value a partner can offer. Partners that
deliver superior benefits, such as product profitability, customer satisfaction and product
performance will be highly valued and there will be the desire to commit and intensify
relationship with them.
Shared Values are antecedents of commitment and trust. Partners have beliefs in
common about what behaviors, goals, and policies are important or unimportant, appropriate or
inappropriate, and right or wrong (MORGAN; HUNT, 1994).
Communication is an antecedent of trust. Communication flows in a marketing channel
include frequency, or the amount of contact between channel members, bidirectionality, which
68
reflects to the extent that partners give feedback and input to the other and formality, which is
related to structured, planned and routinized communication flows (MOHR; SOHI, 1994).
Opportunistic Behavior is related to self interest in a relationship and therefore when a
party believes that a partner engages in opportunistic behavior, such perceptions will lead to
decreased trust.
Furthermore acquiescence, propensity to leave, cooperation, functional conflict and
uncertainty are considered in the model as outcomes of a relationship.
Acquiescence is defined as “the degree to which a partner accepts or adheres to another's
specific requests or policies” (MORGAN; HUNT, 1994, p. 25). Relationship commitment
positively influences acquiescence. Propensity to leave is the perception that a partner will
abandon a relationship in a near future as a consequence of less commitment.
Cooperation means to work together to achieve mutual goals. As Morgan and Hunt
(1994, p. 26) noticed there is an important difference between cooperation and acquiescence.
“Cooperation is proactive; acquiescence is reactive. Passively agreeing to advertise a partner's
product is acquiescence; proactively suggesting better advertisements is cooperation”. In the
model, cooperation is an outcome positively affected by trust as well as commitment.
Functional conflicts are the disputes solved amicably. The ability to solve the problems
prevents stagnation, stimulates interest and curiosity. According to Morgan and Hunt (1994),
when partners trust each other, the interest and propensity to solve conflicts are higher. Channel
conflict might be defined as:
Channel conflict is a situation in which one channel member perceives another
channel member(s) to be engaged in behavior that prevents or impedes it from
achieving its goals. The amount of conflict is, to a large extent, a function goal
incompatibility, domain dissensus, and differing perceptions of reality (Stern et
al, 1996, p.306).
The main causes for a channel conflict are (ROSENBLOOM, 1999):
Role Incongruence: Occurs, for instance, when a channel member doesn’t accomplish the
role that was established for him.
Resources Scarcity: Sometimes there is a divergence related to resources allocation so as
channel members might achieve their goals.
69
Perception Differences: Related to the possible differences between channel members about
some stimuli. Whereas one channel member might believe that one action is positive, for the
other channel member might perceive this same action as being negative.
Expectations Differences: Channel members might have distinct expectations about the roles
and behavior of the other channel members.
Domain Dissensus: Channel members, explicitly or implicitly, determine to themselves,
domain decisions that they believe to be exclusively theirs. A channel domain comprises four
critical elements: population to be served, territory to be covered, functions or duties to be
performed and technology to be employed in marketing.
Goal Divergence: When the objectives of two or more channel members are incompatible,
conflict might emerge.
Communication Difficulty: Communication is the vehicle for all the interactions among
channel members and communication difficulties might create a conflict.
According to Stern e El-Ansary (1977, p. 13), conflict is dysfunctional and, therefore, it is
usually defined to destroy, hurt, oppose or control the other part in an interdependent relationship.
However, this vision is too negative, because it is clear that the presence of conflict is frequently
highly functional. Without conflict, systems might become passive, without innovation and,
eventually, not-viable.
Uncertainty in decision making is related to having enough information about the
decision, predicting the effects of a decision and the confidence on those decisions. Trust
decreases the uncertainty of a partner’s decision making, because partners rely on each other.
By the Morgan and Hunt (1994) model, trust and commitment have a key role in a
relationship. According to the authors, trust is a major determinant of relationship commitment.
That basically occurs because parties are willing to commit only with trusty partners. Moreover
the authors state that:
Commitment and trust are ‘key’ because they encourage marketers to (1) work
at preserving relationship investments by cooperating with exchange partners,
(2) resist attractive short-term alternatives in favor of the expected long-term
benefits of staying with existing partners, and (3) view potentially high-risk
actions as being prudent because of the belief that their partners will not act
70
opportunistically. Therefore, when both commitment and trust - not just one or
the other—are present, they produce outcomes that promote efficiency,
productivity, and effectiveness. In short, commitment and trust lead directly to
cooperative behaviors that are conducive to relationship marketing success
(MORGAN; HUNT, 1994, p. 22).
Owing to their relevance, next sections will further analyze the constructs of trust and
commitment.
2.3.5.3 Trust
Trust has a central role in cooperation and collaboration situations (YOUNG;
WILKINSON, 1989; GOODMAN; DION, 2001). Trust is not a concept defined uniformly and
has many different views in several knowledge fields, such as economy, sociology and law.
(HALLIDAY, 2003).
Moorman et al (1992, p. 82) define trust as “a willingness to rely on an exchange partner
in whom one has confidence”. Similarly, Morgan and Hunt (1994, p. 23) define trust “as existing
when one party has confidence in the exchange partner's reliability and integrity”. Both
definitions highlight the importance of confidence.
Sirdeshmukh et al (2002) divide trust construct in a service company around two distinct
facets: FLE, which would be the trust on Frontline Employees and MPP, which means
Management Policies and Practices. According to them, a consumer can trust a retail clothing
store’s management, but not its salespeople or vice-versa. Their study was done with consumers
of retail clothing and nonbusiness airline travel. Despite not being conclusive, since some
hypothesis were not completely supported, the study analyzes the influence of trust on value
perception, and consequently in consumer loyalty.
Harris and Goode (2004) studied the online market of books and flight purchasing and
concluded that trust has a central role in service dynamics and positions trust as a pivotal driver
of loyalty. In the same way as Sirdeshmukh et al (2002), their research offer empiric evidence of
the importance of analyzing several factors concomitantly, such as: perceived value, trust,
satisfaction and service quality.
71
Despite the fact that those studies have consumer as their object analysis, it seems that
these factors are important for small retail owners as well, and it is possible to differentiate, for
instance, trust of a small retailer towards distributors or manufacturers in the two facets: FLE and
MPP. Moreover, perceived value, trust, satisfaction and service quality are also very important in
the relation manufacturer-distributor-retailer.
2.3.5.4 Commitment
Commitment is very different from involvement in the same sense as the pig’s and the
chicken’s roles in one’s breakfast of ham and eggs. The pig was committed while the chicken
was involved (BOONE, 19928, apud RYLANDER et al, 1997).
Strong collaborations result in a higher commitment which is defined as “an implicit or
explicit pledge of relational continuity between exchange partners” (DWYER et al, 1987, p. 19).
As stated by Brown et al (1995, p. 363), “from a strategic view point, firms signal commitment to
their channel partners by employing well-trained personnel, participating in dealer councils,
granting exclusive territories, offering exclusive distribution and investing in transaction specific
assets”. In other words, it is the willingness to make short term sacrifices in order to achieve long
term benefits (DWYER et al, 1987).
Nevertheless, when commitment is done with disproportional investments, it can have an
opposite effect, undermining relationship and elevating one party's vulnerability to opportunism
(GUNDLASH et al, 1995).
Commitment can be based on economic or extrinsic concerns, with the investment of
relationship-specific assets among partner organizations. On the other hand commitment can also
be based on non-economic or intrinsic aspects, such as social interactions among partners,
identification with another party or internalization of similar values. This second type is critical to
trust development and more enduring relationships (BROWN et al, 1995; RYLANDER et al,
1997).
A high level of commitment reduces perceived behavioral uncertainty and reduces the
probability of opportunistic behavior (SHAMDSANI; SHETH, 1995). Once both parties commit
8
BOONE, Louis E. Quotable Business: Over 2500 funny, irreverent and insightful quotations about corporate life,
New York, NY: Random House. 1992.
72
themselves, it is difficult to redeploy investments to another relationship. “For example, when a
manufacturer grants and a distributor accepts sole product or territorial representation, each is in
effect tying the other's hands through economic and legal commitments that are difficult to exit”
(GUNDLASH et al, 1995, p. 79).
It is possible to distinguish several types of channel commitment (STERN et al, 1996):
•
Affective Commitment: It occurs when one party wants to maintain the
relationship.
•
Moral Commitment: Maintaining the relationship because one feels one should do
so).
•
Calculative Commitment: Maintaining the relationship because one has to do.
As stated by Stern el al (1996, p. 304),
Creating a channel relationship that exhibits trust and commitment is important
because it can have a significant effect on productivity and longevity of the
relationship as a whole […] but even the best designed relationships can
malfunction at some point during the relationship, requiring constant care and
nurturing to maintain coordination in the channel.
In other models, some different variables appear also as antecedent to commitment, such
as power (BROWN et al, 1995; GOODMAN; DION, 2001), continuity (ANDERSON; WEITZ,
1989; GOODMAN; DION, 2001) and idiosyncratic investments (ANDERSON; WEITZ, 1992;
RYLANDER et al, 1997; GOODMAN; DION, 2001). Furthermore, supplier competence is seen
as and antecedent of trust in marketing channels (FREDERICO, 2004). These constructs are
important for the purpose of this work and will be further explained.
2.3.5.5 Power
According to El-Ansary and Stern (1972, p. 47), power of a channel member can be
defined as the
Ability to control the decisions variables in the marketing strategy of another
member in a given channel at a different level of distribution. For this control to
qualify as power, it should be different from the influenced member’s original
level of control over his own marketing strategy.
73
The most used power taxonomy was comprised of five types and identified by French and
Raven in 19599 (ELIAS, 2008). The sources of power identified and still used by the literature
are:
a)
Reward: Capacity of a channel member to reward the other, if this second member
agrees with the first one’s influence. Usually it is a financial reward. Some
possible examples are granting of higher margins, allocation of promotional
allowances, discounts and the assignment of exclusive territories.
b)
Coercion: It is the opposite of the first one. It is based on the expectation that one
member can punish the other one. It involves any punishment or sanction of which
a firm is perceived to be capable. Some possible examples are reductions in
margins, slowing down shipments and taking out exclusivity of some territories.
c)
Legitimate: A channel member has the legitimate right to influence the other. Law
may be an important tool to define legitimate power as it can be seen in franchises.
However, that power doesn´t occur only by law. For instance, a large firm may be
considered the leader by other channel members.
d)
Referent: One channel member identifies itself with the other member.
Identification means a feeling of oneness or a desire for such an identity.
e)
Expert: Power based on the extent of knowledge in a given area. For instance,
small retailers may rely on the expertise of their distributors/suppliers in product
management and exposition.
Marketing researchers have usually divided these sources of power into two segments:
coercive and non-coercive (GASKI, 1986; SCHUL; BABAKUS, 1988). The latter one is
comprised of reward, legitimate, referent, expert (HUNT; NEVIN, 1974). The use of coercive
power results on a net positive relationship with conflict in the channel. Reversely, the use of
non-coercive power has a negative influence on conflict (SCHUL; BABAKUS, 1988).
9
FRENCH, J.R.P. and RAVEN, B. (1959), “The basis of social power”, in Cartwright, D. (Ed.), Studies in Social
Power, University of Michigan Press, Ann Arbor, MI, pp. 529-69.
74
The taxonomy of power sources discussed above doesn’t mean that each relationship has
only one power base. Actually, the power sources are used in combination. For instance,
legitimacy may enhance expertise and vice versa.
When a power imbalance exists, the member with higher power tends to take advantage
of it and exploits the low power channel member, creating a lower propensity for collaboration
(ANDERSON; WEITZ, 1989). On the other hand, the use of less coercive powers and more
reliance on noncoercive powers provides a greater sense of satisfaction for the distributing
partner (GOODMAN; DION, 2001).
There is a conventional wisdom that the balance of power between manufacturers and
retailers has shifted towards the latter. However, there is not an empirical evidence of that
(AILAWADI, 2001). In BoP markets, as small retailers still prevail, manufacturers still may be
perceived as having more power.
2.3.5.6 Continuity Relationship
Continuity is defined as the number of years in the partnership (GOODMAN; DION,
2001). Several authors discuss that satisfaction in a relationship tend to generate continuity
expectations (SHAMDASANI; SHETH, 1995; IZQUIERDO et al, 2008). Besides satisfaction,
the age of relationship is also a good antecedent for perceived continuity (ANDERSON; WEITZ,
1989). A continuous relationship may inspire more collaboration, commitment and trust, building
a virtuous circle. However, that is not always true and a long term partnership may have an
unhappy end, because some partnerships exist for a finite period of time and then purposively
finish; and in other cases, parties might work at arms length for years and never form a close
trading relationship based on trust and commitment. (MOHR; SPEKMAN, 1996; GOODMAN;
DION, 2001)
According to Anderson and Weitz (1989, p. 310):
The degree to which a long term relationship has been established with a
channel member is reflected in the channel member´s perception of the
likelihood that the relationship will continue. At the most basic level, a
manufacturer can’t hope to garner the benefits expected from a long term
75
partnership unless the channel member is convinced the relationship is likely to
last.
Continuity expectation is very important, because it indicates that channel members are
more likely to achieve their mutual strategic goals through the alliance (SHAMDASANI;
SHETH, 1995). Continuity allows channel members to:
•
Assist the manufacturer in new products developments;
•
Conduct and report formal and informal market research concerning the
manufacturer’s products;
•
Engage in activities with a longer term payoff;
•
Be responsive to manufacturer’s requests;
•
React to unforeseen contingencies with flexibility and good will
(ANDERSON; WEITZ, 1989, p. 311).
Continuity is also important to build trust. Early in a relationship it is difficult to find high
levels of trust, since there would have been few opportunities to see the other party engaging in
risk taking behavior (STERN et al, 1996).
2.3.5.7 Idiosyncratic Investments
According to Goodman and Dion (2001, p. 292), “idiosyncratic investments are defined
as investments specific to a channel relationship. Idiosyncratic investments as a rule are
expenditures of time, effort, or funds directed mainly at marketing initiatives for a specific
manufacturer’s product offering”.
By making idiosyncratic investments in a relationship, a channel member creates an
incentive to maintain the relationship (ANDERSON; WEITZ, 1992). Idiosyncratic investments
strengths commitment in two aspects:
a) It creates barriers to relationship termination. For example, a manufacturer that links
its identity to a specific distributor might find it difficult to switch a customer to a new
distributor if the relationship ends; and
b) It is a powerful signal of trust in partnership. Observing the other party investing
makes the channel member to be more confident in the commitment to the
relationship, because there will be economic consequences if the relationship ends.
76
2.3.5.8 Supplier Competence
The supplier competence consists of the core product and services (RUYTER et al, 2001).
Functional performance, quality, product design, competitive price are some elements of the core
products, while punctuality, production volume, infrastructure and organization are associated to
the services (FREDERICO, 2004). Some other supplier competences related to the services
offered are flexibility and responsiveness to customer requirements (GROVES; VALSAMAKIS,
1998).
It can be argued that a third block of competences could be included, which is associated
to the knowledge the supplier has of the product and even of sales. This knowledge is translated
in trainings and consultancy given by suppliers about product, exposition, negotiation and so on.
This third block is aligned with the idea stated by Prévot and Spencer (2006, p. 945), that “the
supplier, going beyond simple product transfer, places his own knowledge, skills and
competences, rather than just preconceived products and services, at the customer's disposal thus
generating added value for the customer, and consequently improving the supplier’s own position
in the market”.
Thus, supplier competence can be divided in three blocks as illustrated in the table below:
Table 2.5: Elements of Supplier Competence
Product
Functional performance
Quality
Product design
Competitive price
Services
Punctuality
Infrastructure
Organization
Flexibility
Responsiveness to customer
requirements
Knowledge
Training
Consultancy
Source: Elaborated by the author
2.3.6
Worldwide distribution cases at BoP
Multinational firms entering retail channels in developing economies need to keep in
mind the neighborhood store’s dual nature: commercial and social. According to Lenartowicz and
Balasubramanian, (2009, p. 59)
77
In developed economies, the introduction of a Walmart megastore at a specific
location can suppress prices and force out smaller stores in the surrounding
region. However, such impacts are muted in developing economies given the
differing consumer shopping patterns, high levels of income variance, low levels
of disposable income, and weak transportation infrastructure. Therefore, small
retailers will likely endure and compete with big-box retailers, and managers
will need to contend with the small retail format for the foreseeable future.
The statement above presents the same discussion of whether MNCs or local companies
are more suitable to operate at BoP market. In Brazil, traditional retailers represent 26% of the
market and in D/E classes this share jumps to 38%10. These numbers are not dropping in recent
years. In reality, the opposite is true and small retailers are gaining market share. This fact shows
that local retailers have some competitive advantage over large and global retailers.
Understanding marketing channels peculiarities in emerging countries is crucial, though.
Therefore, the next sections will present some distribution cases that some authors have studied
in emerging markets. The objective is to understand some patterns, difficulties and challenges
that can be replicated to the reality of this study. The cases have not the objective to be a
thorough discussion of all distribution models towards BoP, but only to present some particular
and innovative cases.
2.3.6.1 Hindustan Unilever Limited (HUL): Shakti Program (India)
The Shakti program was created as a response to operate in small rural villages. To reach
these villages, HUL had to overcome several problems, such as: limited per capita income and
lack of connectivity to the village which meant additional costs to operate there. These small
communities represented 500.000 villages and a population of approximately 500 million people
(RANGAN; RAJAN, 2007). The model was piloted in Nalgonda district of Andhra Pradesh in 50
villages in the year 2000.
The Shakti program, which means strength or empowerment, was based on a Self Help
Group (SHG) of 10 to 15 women that took micro-credit from banks and used that to pay for HUL
products. In the beginning, HUL partnered with three federations of SHGs, which sold HUL
products for their SHG members that sold the products directly to the outlets in their villages.
10
Latin Panel (2008)
78
This model, however, had to change since the incomes generated were very small and nobody
owned the enterprise which was formed by federations of groups.
In the second model developed afterwards, each person was an entrepreneur that
borrowed money from the SHG and bought for reselling the HUL products. With that model the
revenues, even still small, were sufficient for one person that was the owner of the enterprise.
Another huge difference is that the entrepreneurs sold now also directly to end users. To help
these women entrepreneurs, HUL had to hire Rural Sales Promoters, who were outsourced people
that supported women in their businesses.
HUL had also to partner with Marketing and Research Team (MART), a rural consulting
firm that specialized in developing and implementing rural marketing initiatives for social as well
as business organizations. This was necessary because there was a lack of credibility and trust by
local people, NGOs and Government in an endeavor of a multinational company. MART was
responsible for introducing Project Shakti to new districts.
Another important decision was to reduce the number of SKUs, so as to facilitate the sales
by the entrepreneurs. A large proportion of sales came from the smaller SKUs and particularly
from sachets, an innovative packaging solution targeted at low income consumers.
Besides that, HUL hired some women to be their social communicators and explain the
importance of hygiene and health. It was the Shakti Vani that used simple language and
sometimes pictures in meetings with the communities. To improve communication, the company
also created the iShakti. The objective of this portal was to empower the rural community by
creating access to information.
Shakti is a quintessential win-win initiative and must overcome challenges on a
number of fronts. It is a sales and distribution initiative that delivers growth, a
communication initiative that builds brands, a micro-enterprise initiative that
creates livelihoods, a social initiative that improves the standard of life and
catalyzes affluence in rural India. What makes Shakti uniquely scalable and
sustainable is the fact that it contributes not only to HUL but also to the
community it is a part of (RANGAN; RAJAN, 2007, p. 1).
79
In June 2009, there were more than 40.000 Shakti entrepreneurs11 and the project had
been extended to 12 states. A typical Shakti distributor sold products worth Rs 10,000-15,000
(around $250) a month, which provided an income of Rs 700-1,000 (around $25) a month on a
sustainable basis. While this may not seem to be a high income, it made an enormous difference
to women who lived in remote villages in dire poverty. In many cases, earnings from Shakti
helped them double their household income. Much of the additional income went to educating
children, and also to purchasing consumer durables such as television sets, which further expands
the rural market for such products. Some Shakti distributors -- whom the company calls
"entrepreneurs" -- invested the extra money in buying vehicles such as motor scooters that
allowed them to go into more villages.
The main success factors of Shakti program were their partnership with local enterprises
and NGOs and the use of women from the community to sell to the community.
Despite the apparent success of the project there are some criticisms. HUL’s Shakti
remains trapped in a resource-intensive, push-mode of expansion that, according to growing
critics, conflates “selling to the poor” with the broader challenge of sustainable development
(SIMANIS; HART, 2009). Apparently the lack of trust and commitment of the company makes
the turnover of entrepreneurs very high.
2.3.6.2 Mumbai Dabbawala (India)
The Dabbawala’s case is unique by its simplicity and at the same time efficiency. It’s a
typical case of a business model created by BoP people, in its majority illiterate, but that works
because it generates income and, at the same time, makes workers proud to be part of the
organization.
A Dabbawala (who carries the box) is a person in the Indian city of Mumbai whose job is
to carry and deliver freshly made food from home in lunch boxes to office workers. Indian
businessmen are the main customers for the dabbawalas, and the service often includes cooking
as well as delivery.
11
According to the company website visited in 14 June 2009:
http://www.HULshakti.com/sbcms/temp1.asp?pid=46802181
80
According to their website12, within this model, “more than 175,000 or 200,000 lunches
get moved every day by an estimated 4,500 to 5,000 dabbawalas”.
The system has many success factors:
1) Simplicity: Barefoot delivery men are the prime movers of the meals. The success of
the system depends on teamwork and time management. A simple color coding
system doubles as an ID system for the destination and recipient. There are no
multiple elaborate layers of management either — just three layers.
2) Organizational Structure: Everyone who works within this system is treated as an
equal. Regardless of a Dabbawala's function, everyone gets paid about two to four
thousand rupees per month (around 40-80 US dollars).
3) Commitment: Prince Charles, during his visit to India, visited them, but even he had
to fit in with Dabbawala’s schedule, since their timing was too precise to permit any
flexibility.
4) Knowledge of the consumer’s needs: Indian people's aversion to Western style fast
food outlets and their love of home-made food.
5) Execution: The system has an almost perfect punctuality and precision. According to a
survey, there is only one mistake in every 6,000,000 deliveries. On an average, every
box changes hands four times and travels 60-70 kilometers in its journey to reach its
eventual destination.
2.3.6.3 Cemex (Mexico)13
In December 1999, Cemex, the world’s third largest construction materials firm, based in
Mexico, launched Patrimonio Hoy (PH), a sales, distribution, and savings program intended to
serve Mexico’s large self-construction housing market. Under this program, participants enter a
savings and credit program, get assistance to plan construction work, and benefit from services
such as material storage, delivery and price guarantees for two years. This helps the company
reach new customers it could not serve before, while helping poor families to improve their living
conditions.
12
13
http://www.mydabbawala.org/ accessed in November 20th 2009.
Source: Prahalad (2005).
81
With PH, Cemex has benefited in ten years more than 200,000 families in 22 Mexican
states, as well as in Colombia, Venezuela, Nicaragua and Costa Rica14.
PH is a combination of savings and credit. Customers, called socios (or partners) get
together in groups of three people to get the credit from Cemex. The groups are small in order to
create a stronger relationship among partners and to enable an easier control and discipline of
payments. Each socio in the three member group takes a turn every month to collect money from
the other two members and remits a weekly payment to PH.
The distribution model from PH consists of a pull strategy and is divided into two parts:
a) Cemex sells the program door-to-door through promoters, who are in the vast majority
women. These promoters work on a commission basis that is based on the number of
socios they help to enroll and on the stay of the socio within the program.
b) Cemex partnered with their own distributors to make the delivery of the products to
customers. Therefore, it didn’t create a channel conflict with their distributors and also
offered an efficient delivery system for customers. Actually, socios could choose between
receiving delivery right away for immediate construction or receiving a voucher and get
the material later on when they are ready to construct. On-time delivery played an
important role in building trust.
The main success factors of PH are threefold: firstly, the program was able to create trust
among consumers with an efficient service and close relationship. This was possible because the
company invested heavily in understanding consumer behavior and needs. Secondly it was based
on partnerships with distributors, promoters and even community and thirdly an effective
combination of savings and credit with the use of Self Help Groups (SHG).
2.3.6.4 Wizzit (South Africa)
Banking is a sector that favors rich people. Poor people have little access to banking
worldwide. As some low income customers say: “banks are for rich people” or “banks eat the
money (because of the taxes)”15. To overcome this situation, Wizzit created a service of banking
14
15
Source: http://www.cemexmexico.com/se/se_ph.html. Accessed in Nov 20th, 2009.
Research “Financial Services for low income population”. 2005. Shopping Brasil.
82
by mobile phone in South Africa. The service is easily accessed and cheap (RICHARDSON;
CALLEGARI, 2008).
As Wizzit does not have branches, customers open account through field agents, called
WIZZkids. These agents “receive corporate clothing, marketing material and portable gazebos to
help grow their businesses. To become a Wizzkid one has to be an existing WIZZIT client and is
required to complete a training course and pass a test before becoming certified”
(RICHARDSON; CALLEGARI, 2008, p. 75). The service doesn’t have any monthly fees and is
priced in a model of ‘pay-as-you-use’. There is also no need to maintain a minimum balance. One
single mobile phone can be used for many WIZZIT accounts. The customer just needs his own
SIM card, which can be bought very cheaply (RICHARDSON; CALLEGARI, 2008).
This case shows an example of a different business model with online services and a
distribution model based on strong relationship, door-to-door and intense education of the
customer as well as the field agent. It is a BoP model based on consumption inclusion with great
scalability.
2.3.6.5 Sustainable Healthcare Foundation (Kenya)16
To prevent needless deaths and illnesses such as malaria and diarrhea by sustainably
improving access to essential medicines, an American lawyer and a Kenyan pharmacist founded
The HealthStore Foundation. This enterprise is engaging the poor into one sales operation,
through microfranchising of drugstores and clinics located in underserved rural areas and urban
slums in Kenya. The goal of this NGO is to prevent needless deaths and illness, providing these
areas with affordable, quality in stock medicine and to establish clinics located no more than an
hour’s walk from the people served. There are the selections of some franchisees who include
nurses or other health worker from communities, which can better understand and translate the
poor’s needs. The Foundation operates similarly to a typical franchisor providing a common
brand and logistics network, offering professional development and training and enforcing
compliance with rules and regulations through regular monitoring.
16
Source: UNDP. Case study: kenya child &family wellness shops: a model of sustainable health care for the most
vulnerable.
http://www.undp.org/gimlaunch/press/docs/KENYA%20HEALTHSTORE%20CASE%20SUMMARY.pdf
Accessed in August 18th, 2009.
83
This model leverages the creation of local drug distribution network and access to much
needed and affordable health care, while acquiring local knowledge and employing poor people,
who can contribute with ideas for new products or services. The financial self-sustainability
allows them to increase the impact of their reach. In 2008, the enterprise had 64 outlets across
Kenya and served about 400,000 patients. The shops and clinics provide the access, while
generating enough revenue to pay their nurse-owners and staff competitive annual salaries.
Franchisees must contribute $300 of their own funding to open a CFWshop, with the
opportunity to appeal to their own community for support if needed. HealthStore then lends to
franchisees the rest of the start-up capital- about $800. Franchisees must attend an intense
training session in which they master procedures and get help from HealthStore staff to set up
shops to ensure consistency, strong brand recognition and expertise in merchandise display, store
layout, and stocking procedures.
The success key of this model is local embeddedness and trust, because low income
consumers are suspicious until they are persuaded that they can rely on the business. This
strategy is used to address limited market information, both the company and the poor learn
mutually.
2.3.6.6 Coca-Cola System’s Manual Distribution Center
The Coca-Cola system’s Manual Distribution Center (MDC) model, which is currently
being implemented in various forms in some 25 countries around the world, offers an interesting
distribution example. It is first and foremost an approach created to solve a core business need for
the company. At the same time, it has the potential to make a positive contribution to some of the
Millennium Development Goals.
According to Nelson et al (2009), The Coca-Cola System (TCCC) uses the full range of
distribution methods in Africa. In the most developed, urban parts of the continent, the system
uses the more traditional model of supplying large retailers such as grocery stores, hotels,
universities, and other institutions using delivery trucks. However, for a large proportion of its
retail customers, particularly in East Africa, where there are mostly small neighborhood
restaurants or bars, corner stores, and one-person kiosks, the Coca-Cola system has adopted a
84
manual delivery approach working with small-scale distributors to deliver products to small-scale
retailers in densely populated urban areas. One of TCCC’s key bottling partners in Africa, CocaCola Sabco (CCS), has been at the forefront of innovation in this approach, known as the Manual
Distribution Centers model.
MDCs are independently owned, low-cost manual operations created to service emerging
urban retail markets where classic distribution models are not effective or efficient. Common
characteristics include:
• A central point for warehousing of product, with a manageable coverage area and
defined customer base (typically about 150 retail outlets).
• Distribution of product is mostly manual (e.g. by pushcarts) to keep costs at a minimum.
• Outlets served are typically low-volume with high service frequency requirements and
limited cash flow, requiring fast turnaround of stock.
Coca-Cola Sabco first developed the MDC model as a pilot, which created ten
MDCs in Addis Ababa, Ethiopia, in 1999. By 2002, it had implemented the
model on a broad scale throughout its markets in East Africa. Although the exact
number of MDCs changes on a regular basis, as of November 2008 there were
165 MDCs in Addis Ababa and 651 in Ethiopia as a whole, accounting for 83%
of CCS sales nationwide. Also as of November 2008, there were 152 MDCs in
Dar es Salaam and 412 in Tanzania as a whole, accounting for 93% of CCS sales
nationwide (NELSON et al, 2009, p. 12).
Since the model was first piloted in 1999, it has scaled after ten years to the point where
more than 80% of the company’s products were distributed through the MDC model in Ethiopia
and Tanzania.
Besides being an important distribution model, the MDC provides credit access,
information and technologies to small retailers. MDC created benefits for the business, since it
facilitated delivery in poor regions difficult to be reached. It allowed for small deliveries to
outlets and improved services to consumers. It has also contributed to the region’s development,
since it created jobs and entrepreneurial opportunities, promoted economic opportunities for
women and it catalyzed human capital development. Partnership with independently owned
MDCs is one of the most important key successes of this project.
85
2.3.6.7 Grameen Danone (Bangladesh)17
In October 2005, Danone and Grameen Bank decided to create a social business model in
Bangladesh. This company aims at maximizing social value – nutrition to the poor and poverty
alleviation – while being profitable enough to be sustainable. This project started in 2007 with the
opening of a first plant in Bogra producing a highly nutritional yogurt at a very low price (€6
cents).
The project aims at improving the diet of Bangladeshi children with a yogurt fortified in
micro-nutrients (iodine, zinc, iron and vitamin A). The first micro-plant (2500 tons capacity)
opened in Bogra, 250km north of the capital. Milk is collected locally and proximity sales are
taken care of by small shops in the surrounding cities and by the Grameen Ladies in the rural
areas.
In 2008, Grameen Danone sold 2 million yoghurts, essentially within a 40km radius
around the Bogra factory, representing a 40% penetration rate in the area’s villages Profits are
expected in the course of the year 2010. Investment in a second factory is planned for 2010.
The Danone Grameen business model is innovative in several ways:
The production is based in small factories that could use milk suppliers from the region
and also serve nearby consumers. “If the factory is small and produces food that is sold
immediately to the people that live nearby, they will think of it as their factory” (YUNUS, 2007,
p. 139). Actually, building small factories was a real challenge for a company (Danone) used to
producing in large plants. To accomplish building this kind of factory; Danone used a full range
of state of the art technology.
The distribution also had to be adapted. The weather and the impossibility to maintain an
acceptable refrigeration system demanded an efficient distribution, in which yoghurt left the
production line in the morning and ended up in children’s stomachs within forty eight hours.
To that end, they developed a distribution system using the “Grameen ladies” who are the
borrowers of the Grameen Bank, living near the factory. These women were a very important key
to ensure that the yoghurt remained tasty and healthy throughout the distribution and selling
17
Sources: Yunus (2007) and www.danonecommunities.com accessed in August 20th 2009.
86
processes, even without refrigeration. The ladies could deliver 50 to 100 cups of yogurt in four
hour shifts every day.
The main success factors of this distribution model are twofold: a close partnership
between an MNC and a local enterprise; and a door-to-door program using very committed
salespeople. This commitment is not restricted to the ladies, but starts with the CEOs of both
enterprises (Danone and Grameen), their managers, employees and suppliers. All of them had the
perception of ownership of the business.
2.3.6.8 Nestlé (Brazil)18
Nestlé, global leader of the food sector, expanded its operation in BoP markets in the last
years. In Brazil, from the R$ 13 billion sales of the company, more than R$ 1 billion came from
businesses at BoP markets.
To reach this market, Nestlé developed new products (such as Ideal, a powder milk),
products with regional flavor and small packages to allow affordability. Moreover, in 2006, the
company started to sell door to door, a completely different approach for a traditional MNC
company.
The program consists of partnering with some micro distributors that hire women in the
outskirts of the cities. These women sell Nestlé products in kits (they don’t sell just one unit of a
product). The advantage of this operation is that it gives low income population access to Nestlé
products and consequently to consumers that didn’t use to buy its products.
Nestlé is responsible for training the saleswomen in concepts of nutrition and health and
to develop the sales folders. At the end of 2008, Nestlé had 140 micro distributors under this
program, with 6 thousand women selling its products door-to door. This sales force made it
possible to visit 200 thousand households every fortnight.
The success factors of this program are based on the partnership with the micro
distributors, a comprehensive knowledge of BoP consumers and a different access to consumers
that previously couldn’t afford these products.
18
Sources: DEZEM, Vanessa. Aposta em baixa renda acelera crescimento da Nestlé. Valor Online. 3/26/2009.
87
2.3.6.9 Summary of Worldwide distribution cases at BoP
The table below summarizes the worldwide distribution cases, describing their main
distribution model and main success factors.
Table 2.6: Summary of Worldwide distribution cases at BoP
Case
Shakti Program
(HUL)
Mumbai Dabbawala
Main Distribution Model
Door-to-door
Cemex
Door-to-door and partnership
with distributors
Online and door-to-door
Wizzit
Sustainable
Healthcare Foundation
Coca Cola (MDC)
Danone-Grameen
(Bangladesh)
Nestlé
Door-to-door
Micro-Franchise
Micro Distributors – Small
Retailers
Door-to-door
Micro Distributors - Door-todoor
Main Success Factors
Partnership with communities,
local players and NGOs
Execution and commitment of
employees
BoP knowledge, Relationship,
Partnership and Credit
Technology Innovation,
Relationship
Social Embeddedness
Partnership
Partnership between MNC and
local enterprise and commitment
of stakeholders (main
executives, managers,
employees, distribution ladies)
Partnership with micro
distributors and Knowledge of
BoP
Source: Elaborated by the author
Besides the traditional channel, these cases bring some innovation in distribution models.
Some important points they present are the relevance of partnerships, knowledge of BoP market
and a good execution. The main point is to gain the trust of partners and of the community and
accessibility.
They also suggest that companies try, through these distribution models to create a higher
level of embeddedness, since in all the cases there is a closer and more personal relationship with
dealers/consumers. As defined before, social embeddedness helps to build trusting relationships,
which are so important in a distribution strategy. In the same way, in their multi case study,
Sanchez et al (2006, p. 25), found out that “those business activities in which embedded ties and
partnerships seem to be more relevant are distribution and marketing”. As it is quite costly and
88
difficult to create social embeddedness it might be a good solution to partner with local
companies as in the cases of Grameen Danone and HUL.
As with any other marketing tool it is important to differentiate the distribution model
when trying to reach BoP. An example of an unsuccessful approach is the case of Nike that:
Relied on its traditional distribution system in China to market its World Shoe
line for consumers in the so-called ‘tier three’ segment (population with
US$2,000 purchasing power parity). This meant that models for tier three, with a
price ranging from US$15 to US$22, were displayed together with premium
models, costing US$79 upwards, in large retail stores in major metropolitan
areas. Ultimately, the use of this distribution channel made it difficult to reach
the target market (SÁNCHEZ et al, 2006, p.25).
2.4
Strategy
2.4.1
Introduction
As discussed before, one of the main issues of BoP knowledge is to create a new and
integrated strategy within an innovative business model. As approaching BoP is quite different
from reaching more affluent markets, companies should innovate in their business models and
define new ways to go to the market. However, as stated by Johnson et al (2008, p. 52), “an
analysis of major innovations within existing corporations in the past decade shows that precious
few have been business-model related”.
The United Nations Development Program (UNDP), the British Department for
International Development, the World Business Council for Sustainable Development and others
are increasingly using the term ‘inclusive business models’ to describe core business approaches
that explicitly integrate low-income people into corporate value chains, as in the following ways:
Consumers: The development and delivery of products and services that improve lowincome households’ access to health, education, water and sanitation, food and nutrition, energy,
housing, information, financial services, etc.
Employees: Efforts by large companies to support the recruitment, training and
development of people from low-income households.
89
Producers, suppliers, distributors, retailers and entrepreneurs: Business linkage
initiatives that source from, distribute through, or sell to small and micro-enterprises and smallscale farmers.
One of the main components of a business model is the company strategy (AFUAH,
2004; SHAFER et al, 2005; CHESBROUGH et al, 2006; JOHNSON et al, 2008). Therefore,
strategy will be further analyzed in next section.
2.4.2
Strategy Concept
According to Jain (2004, p. 9), strategy can be defined as:
The pattern of major objectives, purposes, or goals and essential policies and
plans for achieving those goals, stated in such a way as to define what business
the company is in or is to be in and the kind of company it is or is to be.
The author continues stating that
Any organization needs strategy (a) when resources are finite, (b) when there is
uncertainty about competitive strengths and behavior, (c) when commitment of
resources is irreversible, (d) when decisions must be coordinated between farflung places and over time, and (e) when there is uncertainty about control of the
initiative (JAIN, 2004, p. 9).
According to Porter (1999, p. 63), “strategy is to create an exclusive and valuable
position, through a different set of activities”. In the same way Day (2001, p. 19) believes that a
company with a market orientation has the “discipline to make healthy strategic options and
implement them in a coherent and complete way and not be everything for everyone”. Several
authors have emphasized the importance of market orientation as an intangible resource in
developing a competitive advantage. (HYVÖNEN; TUOMINEN, 2007).
The elements for a market-oriented organization are:
•
Culture oriented to the market, with beliefs, values and behaviors that emphasize
superior value to the client and continuous search for new sources of competitive advantages. It is
important that the market orientation extends to all the organization through a culture that places
90
the client first. According to Day (2001, p. 22), “markets punish companies with arrogant and
insensible cultures”.
•
Specific abilities to feel the market, to have a good relationship with it and to have
a strategic view.
•
A structure that enables the whole organization to continuously anticipate changes
in the clients’ demands and in the conditions of the market. The characteristics that distinguish
structures of market driven organizations are:
•
Strategic focus on the market: Organization is structured to offer superior
value to the client.
•
Coherence of factors: All the factors of the organization (culture, abilities and
structures) complement and support mutually.
•
2.4.3
Flexibility: The structure has to adapt according to changes in the market.
Emergent x Deliberate Strategies
It is possible to differentiate between emergent and deliberate strategies. Emergent
strategies are “patterns or consistencies realized despite, or in the absence of, intentions”
(MINTZBERG; WATERS, 1985, p.257). It emerges in response to an evolving situation;
whereas deliberate strategies are realized as intended. They are brought through a process of
formulation followed by implementation. But when these planned intentions do not produce
desired actions, organizations are left with unrealized strategies (MINTZBERG, 1987).
A strategy to be considered deliberate needs to have at least three conditions satisfied
(MINTZBERG; WATERS, 1985):
•
There must have been precise intentions in the organization, so that there was no
doubt about what was desired before any actions were taken.
•
The intentions must come from the organization and not from individuals, which
means, they must have been common to virtually all the actors.
•
These collective intentions must have been realized exactly as intended.
91
On the other hand, “for a strategy to be perfectly emergent, there must be order –
consistency in action over time – in the absence of intention about it” (MINTZBERG; WATERS,
1985, p. 258).
Therefore, it is difficult to have a completely emergent or a completely deliberate
strategy. It is more reasonable to have tendencies in the directions of deliberate and emergent
strategies. Previous research (BARKI, 2005) argues that it is possible to notice both kinds of
strategies being used in BoP markets and that usually local companies use a more emergent
strategy.
The figure below, presents graphically the concepts of emergent and deliberate strategies:
Emergent
Strategy
Realized
Strategy
Deliberate
Strategy
Unrealized
Strategy
Figure 2-8: Deliberate and Emergent Strategies
Source: Adapted from Mintzberg; Waters (1985)
2.4.4
Resource Based View
This section will explore resource based view (RBV) of the firm approach, which is
considered the most important contribution to strategy in the last years (RAMOS-RODRIGUEZ;
RUIZ-NAVARRO, 2004).
One of the main criticisms to the Porter model is that it doesn’t properly answer the
question: “why firms differ?” (NELSON, 1991). Barney (1991) points out that firms in an
industry are heterogeneous in their strategic resources and that these resources might not have a
92
perfect mobility among firms. Moreover, resources drive value creation and are the pillars in the
building of a competitive advantage.
Resources may be considered as strengths that firms may use to develop and implement
their strategies. Firm resources include all assets, capabilities, organizational processes, firm
attributes, information, knowledge controlled by a firm that enables it to conceive and implement
strategies that improve its efficiency and effectiveness (BARNEY, 1991). For the resources to
have a potential to develop a competitive advantage, they should have four attributes (BARNEY,
2001):
•
Valuable – it exploits opportunities and/or neutralizes threats in an organization
environment. Although a resource may have added value to a firm in the past it may
not be so relevant in the future. So companies must always analyze whether their
resources continue valuable and important for the market. Furthermore, the question
of value is important for companies to link internal competences with customers’
needs.
•
Rare – resources not easily available among current and potential competitors.
Valuable, but common resources are just a source of competitive parity and do not
differentiate firms.
•
Imperfectly Imitable – When competitors don’t have the ability or condition to obtain
the resource for one or more reasons. Imitation can occur in at least two ways:
duplication and substitution. Duplication happens when the imitating firm is, after a
while, able to use the same kind of resources as the company it is imitating.
Substitution occurs when firms are able to substitute the resources for similar ones.
•
Organization – To fully realize the competitive advantage of its resources, a firm has
to organize itself to exploit them.
Resources in a company can be classified into three categories: physical (such as
technology, properties, location and access to raw materials), people (training, experience,
intelligence, judgment, relationship and employees vision) and organizational (hierarchical
structure, formal and informal planning, coordination systems and controls).
Among the most important intangible resources to create competitive advantages, are the
core competences. Prahalad and Hamel (1990) define core competences as being a collective
93
learning, especially of how to coordinate distinct production abilities and integrate several
Technologies. In the authors’ view, core competences:
a.
Allow access to a variety of markets.
b.
Should create a significant contribution to benefit customers.
c.
Should create a difficulty of imitation among competitors.
For some authors (RAMOS-RODRIGUEZ; RUIZ-NAVARRO, 2004; SEELOS; MAIR,
2007), the resource-based view is considered the dominant strategy perspective explaining firmlevel financial performance. However, only recently the discussion of how the resources can be
turned into competitive advantage gained voice (SIRMON et al, 2007). Sirmon et al (2007) argue
that the existence of rare, inimitable and valuable resources is not synonymous of competitive
advantage. The authors elaborated a framework for thinking about how to use and create value
from resources. According to them,
Top-level managers should view their firm as a system of resources and
capabilities, developing leveraging strategies that match their capabilities to the
market and environmental context in order to create value for customers and
owners (SIRMON et al, 2007, p. 287).
2.5
Conclusion of Knowledge Review
This knowledge review was divided into three complementary parts. The first one
discussed the evolution of BoP knowledge, the second one the definition and constructs related to
marketing channels and the third one discussed some strategy concepts.
As already seen, BoP literature is evolving from a selling to the poor view to a more
inclusive approach, with the growing importance of sustainability and innovation. However, the
most relevant novelty is the concordance that more than adapting parts of a strategy, the success
in BoP markets depends on revising the business model of the organization.
As the main purpose of this thesis is to describe marketing channels used in BoP markets,
marketing channels literature was reviewed. To enrich this part some BoP distribution cases were
described so as to evaluate if the constructs of the theory were identified in real cases.
94
As strategy appeared as an important facet of the theory on BoP and, in marketing
channels, the need to better understand the concept of strategy was evident. The RBV approach considered the most important contribution to strategy in the last years - was explored more
intensively (RAMOS-RODRIGUEZ; RUIZ-NAVARRO, 2004).
95
3
METHODOLOGY
‘Data don’t generate theory – only researchers do that’
(Mintzberg, 1979, p. 584).
3.1
Introduction
This chapter explains the reasons for adopting a qualitative research, more specifically the
grounded theory, and then it describes the process of planning, data collecting, sample definition
and research analysis.
According to Morgan and Smircich (1980, p. 491),
The choice and adequacy of a method embodies a variety of assumptions
regarding the nature of knowledge and the methods through which that
knowledge can be obtained, as well as a set of root assumptions about the nature
of the phenomena to be investigated.
3.2
Qualitative Research
Interpretivism inquiries arose in the late 19th and early 20th centuries as an opposition to
the positivism philosophy, arguing that the human sciences were radically different from the
natural sciences. Qualitative supporters claimed that human sciences aim to understand human
action while positivism defenders argued that the purpose of any science is to offer causal
explanations of social, behavioral and physical phenomena (SCHWANDT, 2000).
Qualitative research, rather than quantitative, is considered more appropriate for
examining new relationships, abstract concepts and describe new phenomena. In studying such
situations, an exploratory approach focused on theory building is most appropriate
(EISENHARDT, 1989; LONDON; HART, 2004). “Qualitative researchers study things in their
natural settings, attempting to make sense of, or to interpret, phenomena in terms of the meanings
people bring to them” (DENZIN; LINCOLN, 2000, p. 3).
96
Qualitative research is seen as subjective and exploratory and diverges from the
positivistic (experimental) view, which assumes their practice as the ‘truth’ that can transcend
opinion or personal bias (DENZIN; LINCOLN, 2000). However, the rapid social changes are
forcing the use of inductive strategies (related to qualitative methods), instead of starting from
theories and testing them (DENZIN; LINCOLN, 2000).
Moreover, some authors believe that qualitative researchers offer richer descriptions of
the social world and do not depend on the study of large numbers of randomly selected cases,
being more likely to confront the constraints of everyday life (DENZIN; LINCOLN, 2000;
BARR, 2004).
Qualitative methods provide the opportunity to identify and explain complex
relationships without having to pre-specify either the variables involved, or the
nature of the relationship between them […] Because the phenomenon of
interest is studied in context and from the perspectives of the participants, the
researcher has a more situationally grounded understanding of the results
(BARR, 2004, p. 167).
In social sciences and specifically in marketing, a more qualitative and subjective approach
for a problem or a more quantitative, positive and objective view can be used. To understand it
better, the figure below presents a continuum between the opposite methodological proposals.
Subjectivist
Approaches to
Social Science
Objectivist
Approaches to
Social Science
Core
Ontological
Assumptions
Reality as a
projection of
human
imagination
Reality as social
construction
Reality as a
realm of
Symbolic
discourse
Reality as a
contextual field
of information
Reality as a
concrete
process
Reality as a
concrete
structure
Assumptions
about Human
Nature
Man as pure spirit,
consciousness
being
Man as social
Constructor, the
symbol creator
Man as an
actor, the
symbol user
Man as an
information
processor
Man as an
adaptor
Man as a
responder
Basic
Epistemological
Stance
To obtain
phenomenological
insight revelation
To understand
how social reality
is created
To understand
patterns of
symbolic
discourse
To map
contexts
To study
systems,
process, change
To construct a
positivist
science
Some Favored
Metaphors
Transcendental
Language game,
accomplishment,
text
Theater,
culture
Cybernetic
Organism
Machine
Research
Methods
Exploration of
pure Subjectivity
Hermeneutics
Symbolic
Analysis
Contextual
Analysis of
Gestalten
Historical
Analysis
Lab
Experiments,
Surveys
Figure 3-1: Network of Basic Assumptions Characterizing the Subjective—Objective Debate
within Social Science.
Source: Morgan; Smircich (1980, p.492)
97
In the objectivistic approach, reality is a concrete structure, objectively defined and people
only respond to it. It is assumed that there is a unique reality, which is external to the researcher.
It is an objective phenomenon that lends itself to accurate observation and measurement. The
main objective of the researcher is to explain and predict the phenomena. The social world is as
concrete and real as the natural world. Experiments are the most appropriate methodology to
understand reality. The basic epistemology stance is to construct a positivist science.
On the other hand, the subjectivistic approach is an alternative view that considers reality
to be a projection of human imagination, as a social construction. Epistemologies of subjectivism
seek to understand how the reality is constructed (MORGAN; SMIRCICH, 1980; BANDEIRADE-MELLO; CUNHA, 2006). It assumes that there are multiple realities that are socially built
and modified.
Due to the fact that this study analyzes the executives view about distribution strategies to
reach BoP markets, which is a knowledge field that is still in its infancy, it was chosen a
qualitative approach. Furthermore, an exploratory methodology has been recognized as being
particularly useful for researchers interested in examining strategies in emerging economies
(HOSKISSON et al., 2000; LONDON; HART, 2004).
Next section will describe the methodology chosen (Grounded Theory) and the reasons for
that choice.
3.3
Research methodology: Grounded Theory
“Grounded theory methods consist of systematic inductive guidelines for collecting and
analyzing data to build middle range theoretical frameworks that explain the collected data”
(CHARMAZ, 2000, p. 509). The major difference between this methodology and other
approaches to qualitative research is its emphasis upon theory development (STRAUSS;
CORBIN, 2008).
The methodology is more appropriate to be used when there is an interesting phenomenon
without explanation and from which researchers seek to “discover theory from data” (GLASER;
STRAUSS, 1967; SUDDABY, 2006), which is exactly the case of this research. “Grounded
98
theory research is not a-theoretical, but it does call for an open mind and a willingness to have
faith in the data” (GOULDING, 2001, p. 23).
Grounded Theory is positioned in the middle of the continuum presented in the Figure
3.1 (BANDEIRA-DE-MELLO; CUNHA, 2006). It differs from the extreme subjectivism of the
phenomenology for three main reasons: (a) In phenomenology, the subjective experiences of the
subject are more important than the interpretation of the researcher; (b) differently from
phenomenology, grounded theory accepts multiple sources of data, and (c) whether
phenomenology studies are contextualized by existing theory, grounded theory assumes a critical
posture (GOULDING19, 1998, apud BANDEIRA-DE-MELLO; CUNHA, 2006).
The grounded theory approach has an ideal of not having a predetermined theory or
hypothesis to test. Although it is almost impossible to achieve this ‘open mind’ approach,
attempting to get closer to this ideal is important because preconceived theories or propositions
might bias and limit the findings (EISENHARDT, 1989). Despite that ideal of not being
‘contaminated’ by previous theories, it is considered impossible by some authors to maintain
neutrality, lack of subjectivity or to ignore previous knowledge in the subject (PARKER;
ROFFEY, 1997; SCHWANDT, 2000; SUDDABY, 2006).
Grounded theory is an interpretive process. Positivistic models of science encourage the
notion that researchers stand separate from objects of inquiry in order to minimize the degree to
which the act of observation interferes with or contaminates the observation. In interpretive
models, this assumption is not so firmly held. The researcher is considered to be an active
element of the research process, and the act of research has a creative component that cannot be
delegated to an algorithm (SUDDABY, 2006).
Grounded theory has gained strength in social sciences and according to Bryant and
Charmaz (2007, p. 47),
For a variety of reasons, Grounded Theory Method steadily gained in popularity,
initially in the social sciences and eventually well beyond, moving out into any
discipline where research involved contact with human subjects in specific
situations. By the late 1990s, surveys indicated that among published papers
19
GOULDING, C. Grounded theory: the missing methodology on the interpretivist agenda. Qualitative Market
Research: An International Journal, V.1, Issue 1, p. 50-57, 1998.
99
reporting on qualitative research, two out of three claimed to be using grounded
Theory Method.
3.3.1
Evolution of grounded Theory
“Like most difficult subjects, grounded theory is best understood historically”
(SUDDABY, 2006, p. 633). Grounded theory was ‘discovered’ by Glauser and Strauss in 1967,
as a means to empower qualitative research that was losing ground to a more quantitative and
positivistic vision (SUDDABY, 2006). It was intended as a methodology for developing theory
grounded on data which is systematically gathered and analyzed. The developed theory is
ultimately grounded on the behavior, words and actions of those under study and evolves during
the research process itself (GOULDING, 2000; GOULDING, 2001). The roots of grounded
theory can be traced back to the symbolic Interactionism (GOULDING, 2000).
Grounded Theory evolved from the tradition of Chicago Interactionism and the
philosophy of Pragmatism. The Interactionism view is based on the interpretation each one gives
to an action. The response that a person gives to an action depends on the meaning he/she gave to
the action. Pragmatists assume that knowledge is created through action and interaction; they are
concerned with processes; believe in the accumulation of collective knowledge and that
knowledge can be useful for practice or practical affairs. Knowledge and action both feed into
each other (CORBIN; STRAUSS, 2008).
Since mid 1980s, grounded theory developers started a divergence in their approaches to
the methodology. Although Glaser and Strauss still agreed in the relevance of generating theory
about a particular substantive area of activity, they had different views about the approaches to
develop this emerging theory.
Whereas Glaser selects an area (or organization, or activity) for study and allows issues to
emerge in the course of the research process; Strauss, with his new partner Corbin, are more
specific and prefer to identify a phenomenon or issue for study. Hence, for Glaser, researcher
enters the research with a complete open mind and the identification and specification of the
research occur only after the researcher has entered the research site. On the other hand, for
Strauss and Corbin, researcher may predetermine the general subject of enquiry before entering
the research site. Moreover, Strauss and Corbin advocate a more structured approach to data
100
analysis, while Glaser also prefers an analytical method which is more general in its frame of
reference (PARKER; ROFFEY, 1997).
Next table presents some differences between Glaser and Strauss and Corbin approaches:
Table 3.1: A comparison of grounded theory methodology orientations: Strauss and
Corbin vs. Glaser
Glaser
1. Two core questions:
• what is the chief concern/problem people in
the area under study?
• what category does the concern indicate?
2. The problem emerges and should not be
“forced” by the methodology. Categories and
their properties “emerge” through constant
comparison of incident to incident.
1.
2.
3. Can be difficult to operationalize.
3.
4. Generates concepts and their relationships to
4.
explain and/or interpret variations in behavior in
the substantive area under study
5. Produces a theoretical formulation or set of
5.
conceptual hypotheses. Testing is left to other
researchers interested in such work.
Strauss and Corbin
The research question is a statement that
identifies the phenomenon to be studied.
Researchers need help with the interpretation
process: procedures and techniques need to be
spelled out. Subcategories are linked to
categories that denote a set of relationships (i.e.
causal conditions, action/interaction strategies,
and consequences)
Easier to operationalize.
Generates an inductively derived theory about a
phenomenon comprised of interrelated
concepts.
Undertakes continual verification and testing to
determine likely validity of concepts and
relationships between them.
Source: PARKER; ROFFEY (1997, p. 221).
In this thesis, it is used more emphatically the Strauss and Corbin approach with a more
structured analysis that has a predetermined research question, which is what are the distribution
strategies that generates a satisfactory access to BoP markets in Brazil? Thus, the phenomenon to
be studied was already defined before the research: consumer goods distribution to BoP.
3.3.2
Grounded Theory in Marketing
Over the last few years the grounded theory has attracted increasing attention from
marketing academics (GOULDING, 2001).
Grounded Theory is conceived of a way of studying social actors as well as their
relationships, interactions and conflicts in an ever-changing world. In this sense,
it seems particularly suitable for marketing and sales research, as these areas
often necessitate research tools that are more accommodating of the complexity
101
and fluidity of person-to-person interaction than standard survey instruments
(GEIGER; TURLEY, 2003, p. 582)
However, still few studies in business administration in Brazil, and more specifically in
marketing, use the Grounded Theory Method (BIANCHI; IKEDA, 2008). The table below shows
some examples of studies in marketing that mentioned using this methodology. In this analysis, it
wasn’t done a critical evaluation of the effective use of the methodology, or in other words,
whether the research used the processes suggested in the grounded theory: theoretical sampling,
constant comparison and inductive coding (GOULDING, 2005). Furthermore, this analysis has
no purpose of being exhaustive, but just to highlight the possibilities of the methodology. The
number of marketing theses using grounded theory is much larger than the presented in the table
below. For instance, a search in Proquest20 offers 154 PhD and master dissertations in marketing
mentioning this methodology.
20
http://proquest.umi.com, accessed in 27 January 2010.
102
Table 3.2: Examples of marketing researches using grounded theory.
Work (Article/ Thesis)
Sales buy-in of marketing strategies:
exploration of its nuances,
antecedents, and contextual
conditions.
Revealing
and
understanding
professor-student
Relationship in marketing.
Rethinking Customer Solutions: From
Product Bundles to Relational
Processes.
An empirical examination of service
dominant logic: The theory of the
network.
The influence of information about
labour abuses on consumer choice of
clothes: a grounded theory approach.
Author(s) and Publication
MALSHE; SOHI (2009) Journal of Personal Selling &
Sales Management
Methodology
49 in-depth interviews with sales
and marketing professionals
Main points
explored the multifaceted nature of sales
buy-in—that is, the sales function’s
belief that marketers’ proposed strategy
is appropriate and has merit
with Explored the perspectives of marketing
professors about their students.
IKEDA; BACELLAR (2008)
- Revista de Administração
Mackenzie (Brazil)
TULI;
KOHLI
BHARADWAJ (2007) Journal of Marketing
10 in-depth interviews
marketing professors
In-depth interviews with 49 Proposed a new way of thinking about
managers in customer firms and 55 customer solutions.
managers in supplier firms and
on discussions with 21 managers in
two focus groups.
RANDALL
(2007)
– Forty four in-depth interviews
Development
of
an
inductively
Doctoral Thesis – University
generated theory of S‐D Logic to
of North Texas
include
constructs,
relationships,
outcomes, and hypothesis
VALOR (2007) - Journal of In-depth interview with 11 students proposed a model to explain the
Marketing Management
influence of information about labor
abuses on consumer behavior when
buying clothes.
ZILBER; LEX; PEREZ; 16 in-depth interviews.
Identified the organization factors that
DIDIO (2006) – ENANPAD
characterized companies as innovative.
– Brazilian
The perception of innovations by
electro
medical
equipments
consumers: a qualitative study with
the application of Grounded Theory.
Process and Meaning in 'Getting a GOULDING;
FOLLETT;
Tattoo'.
SAREN;
MACLAREN
(2004) - Advances in
Consumer Research
Fifteen in-depth interviews. These
were followed up with further
meetings and discussions in order
to capture the breadth of the
experience. In addition to this, one
of the researchers joined a
discussion list dedicated to extreme
body modification.
Explored the nature of customer
interactions and the development of
client/provider relationships in the tattoo
industry.
103
Work (Article/ Thesis)
Building and Sustaining
Buyer–Seller Relationships in Mature
Industrial Markets
Relationship in Food Distribution
Channel in Brazil: An exploratory
investigation
Author(s) and Publication
Methodology
NARAYANDAS; RANGAN Clinical field research methodology
(2004)
Journal
of
Marketing
LABAN (2004) – Doctoral 21 in-depth interviews
Thesis – FGV - EAESP
Grounded theory in sales research: an
investigation of salespeople’s client
relationships
Exploring the Phenomenon of
Customers' Desired Value Change in a
Business-to-Business context
GEIGER; TURLEY (2003)
A
grounded theory
consumption in Australia
of
FLINT;
WOODRUFF;
GARDIAL (2002) - Journal
of Marketing
beer PETTIGREW
Qualitative
Research
(2002)
–
Marketing
Implementing Marketing Strategies: NOBLE; MOKWA (1999) Developing and Testing a Managerial Journal of Marketing
Theory
Contemporary Museum Culture and GOULDING
Consumer Behavior
Journal
of
Management.
Source: Elaborated by the author
(1999)
Marketing
Main points
Explored the evolution of three
industrial buyer–seller relationships in
mature industrial markets
Explored the relationship development
process that takes place among the actor
on the food distribution channel in
Brazil
36 salespeople were interviewed Grounded theory as an inductive method
and five full days of observational of theory generation in business research
data collected.
is presented and critically evaluated
22 interviews, supplemented by
Explored the nature of customers'
observation of meetings with
desired value change and related
purchasing professionals inside
contextual conditions
participants’ organizations, tours of
facilities, and analyses of
documents provided by
participants.
Participant
observation,
non- Developed a substantive theory of beer
participant
observation
and consumption that describes the specific
interviews with over 400 people.
cognitive and emotional processes
involved in the selection and
consumption of particular brands of beer
amongst members of the Australian
culture.
Semi structured depth interviews in Developed a model of important factors
three different organizations
that influence the implementation of
marketing strategies from a managerial
perspective
Twenty semi-structured in-depth Developed three categories
interviews; observation and
a of behavior linked to experiences of
series of focus group interviews consuming heritage.
with a total of 33 people.
104
3.3.3
Reasons for the choice of Grounded Theory
Many are the reasons for choosing grounded theory:
Firstly, as suggested by some authors (GOULDING, 2000; CORBIN; STRAUSS, 2008),
grounded theory is indicated when a theme is still relatively ignored in the literature. Secondly,
the methodology is more appropriate to be used when there is an interesting phenomenon without
explanation and from which researchers seek to “discover theory from data” (GLASER;
STRAUSS, 1967; SUDDABY, 2006).
Thirdly, the study sought to have a detailed understanding of the issues underlying the
research questions; which only could be obtained through in-depth interviews. Finally, Grounded
Theory allows considering and managing many variables at the same time (VALOR, 2007), as it
was the case of this research that analyzed distribution for BoP in executives view, comparing
small and large manufacturers and also many perspectives of important factors that determine a
satisfactory distribution.
Furthermore, according to Carson et al (2001), three necessary characteristics of a
research problem that would be appropriate for Grounded Theory are:
1. The research should be interpretativist. This research was built in the perceptions of
executives about what define satisfactory distribution for BoP and because of that can be
considered interpretativist.
2. Research should be about complex social processes between people. This research was
based on the marketing channel network, which is a complex social process.
3. There should be virtually no existing theories about the phenomena, which was the case,
since there is a lack of marketing theories for BoP.
3.4
Research Design
This section is divided into four parts, in order to explain the research design adopted in
this study:
a) Definition of the sources of data collection;
b) The sample of the research and data collection;
105
c) The analysis of the research, which is based on asking questions, constant comparison
and coding; and
d) Development of a theory.
3.4.1
Sources of Data Collection
The grounded theory methodology allows many sources of data, including company
reports, secondary data, and even statistics, providing the information has relevance and fits into
the study (GOULDING, 2001; CORBIN; STRAUSS, 2008).
Owing to the characteristics of this research, it was chosen the following sources of data:
•
Interviews: 26 in-depth interviews with executives of global and local companies
were done. The interviews were held during the months of March 2009 to October
2009 and were basically semi-structured, with some predetermined set of open
questions, as suggested by Corbin and Strauss (2008).
•
Secondary data: For this research it was used three kinds of secondary data:
Published data: Articles in newspapers, magazines and internet were also
selected to be analyzed.
Documents: Whenever possible, reports and materials from the companies
interviewed were analyzed and also categorized.
Market data analysis: The researcher had access to a data panel from
Brazilian consumers collected by Latin Panel (one of the world’s largest
research institutes) and analyzed sales of the main consumption categories
of food, personal care and household cleaning products. The main aspects
analyzed were penetration of each retail format by social class and
evolution of adopted retail formats.
•
Observation: The researcher visited 2 low income regions (Sapopemba and
Osasco), accompanied by distributors so as to analyze the difficulties and
dilemmas in the point of sale, as well as, interviewed store owners in order to
understand their view of the supply chain.
106
3.4.2
Sample and Data Collection
SAMPLE
The main source of data used in this research was interviews. These interviews were not
selected randomly, but rather because they offered a variety of different approaches to explore
opportunities in base-of-the-pyramid markets (EISENHARDT, 1989).
As suggested in the literature (GOULDING, 2001), the interviewed were chosen as they
were needed rather than selected before the research began. Initially, the research started with the
most obvious places and the most likely informants in search of information, and afterwards it
adopted the snowball approach, in which each interviewed suggested people that could add new
information.
A theoretical sampling was used. This kind of sampling is concept driven. It starts with
data collection that leads to analysis, which leads to concepts and back to data collection in a
flow that only ends when there is saturation (CORBIN; STRAUSS, 2008). This involves staying
in the field until no new evidence emerges from data and is a result of the ongoing process of
theoretical sampling (GLASER; STRAUSS, 1967; EISENHARDT, 1989; GOULDING, 2001).
Theoretical sampling is especially important when studying new areas because it allows for
discovery.
Altogether, the research generated 23 hours of interviews. Interviews were conducted face
to face or by phone (in the cases of companies outside São Paulo). All this material was recorded,
transcribed; read line by line and codified, as further explained in the next section.
Initially, as the focus was on describing distribution strategies to BoP markets, the
researcher chose leading MNCs and Brazilian large companies that had an intensive distribution
to interview. Despite not being possible to identify differences in the distribution models of these
two groups of companies, it was possible to evaluate the differences those companies’
understanding of the BoP market.
The sample also included small manufacturers. The different approaches adopted by
larger and smaller companies allowed a new view of the possibilities of the market as well as the
difficulties and obstacles both had to transpose. The contrasting of large and small companies’
strategies was very stimulating and helped a lot in the analysis and elaboration of a substantive
theory.
107
Other than that, the researcher decided to interview some distributors as well, since these
companies are an important link in the channel’s structure. Moreover, to help in more theoretical
aspects of identifying the differences in distributing products to BoP and high income markets,
two specialists were also interviewed.
The interviewed companies were:
108
Table 3.3: Profile of interviewed companies
Company
Profile
LARGE MANUFACTURERS
MNCs
1. Cargill
Cargill is an American enterprise founded in 1865. It is an international
leader in agricultural, food, financial and industrial services and
products. The company has been in Brazil for 40 years and its sales of
the retail business (oils, olive oil, sauces and mayonnaise) were
approximately R$ 2 billion in 2008. The most important brands of the
company are Liza, Mayonnaise Gourmet, Mazola and Purilev.
2. Coca Cola
The Coca-Cola Company is one of the largest companies in the world
and the world´s largest beverage producer, founded in 1892 in the
United States. It holds more than 230 brands and over 3,000 products
which include soft drinks, juices, water, tea, coffee, milk, sports and
energy drinks. In Brazil the company sold in 2008 9 billion liters of
non-alcoholic beverages with net sales of R$ 15 billion.
3. Danone
Danone is an international enterprise and a global leader in fresh dairy
products, water, baby nutrition, medical nutrition. Danone came to
Brazil in 1970 offering products in the segment of yogurt.
4. Procter & Procter & Gamble is an American multinational corporation which
Gamble
started its operations in 1837 and produces a wide variety of consumer
goods. The company employs 138 thousand people in 80 countries,
reaching US$80.5 billion in sales. P&G came to Brazil in 1988,
acquiring Perfumarias Phebo and afterwards introduced its global
brands. In 2008, it had sales of over R$ 3 billion with more than 60
brands.
5. Unilever
Unilever, formed in 1929, became an international company and one of
the global leader working with consumer products in the segment of
food, beverages, cleaning and personal care products. The company
reached an international coverage, being present in more than 150
countries and employing 174 thousand people, which contributed for
revenues of €40.5 billion in 2008.
BRAZILIAN LARGE COMPANIES
6. Bauducco
Bauducco is one of the largest companies in the food market in Brazil.
Part of the holding Pandurata Alimentos, with approximately R$1
billion in sales in 2008. The enterprise is a pioneer in the market of
Panettones. Its product mix is composed of Colomba Pasquale and
wafer cookies. Works with the brands Bauducco, Visconti (for Low
income markets), Ovomaltine and Hersheys.
7. JMacedo
J. Macedo was founded in 1939 in Fortaleza, Ceará. In 2008, the
company was leader in the segment of domestic wheat flour and cake
mixtures. It operates also in the markets of pasta, cookies and desserts.
In 2008, the net sales of the company were of R$ 1.5 billion. Its brands
are: Dona Benta, Sol, Brandini and Petybon.
8. Mabel
Mabel started its operations in 1953. It is an important player in the
cookies segment. The company is from Goias state. It is the third major
brand in the cookies market and the leader in the West-center region of
Brazil. In 2009, it exported its products to more than 35 countries in 4
continents. In 2008, the company had net sales of R$ 480 millions. It
just works with the Mabel brand.
109
Company
9. Natura
Profile
Natura is the leading company in the segments of cosmetics and personal
hygiene. It is present in seven Latin American countries and in France. In
2008, it had sales of R$ 3.6 billion. The company controls the largest
door-to-door operation in Brazil, with more than 800 thousand sales
consultants over the world in 2008 (730 thousand in Brazil).
10. Yoki
Yoki sells over 620 products. Their main products are popcorns, natural
and industrialized condiments, snacks, teas, cake mixtures, desserts,
candies, soaps, juices, cereals, flours and pet food. It works with the
brands Yoki, Kitano, Yokitos, Mais Vita, Lin Tea, Tori and Chef Line. Its
net sales were of approximately R$ 950 thousands in 2008.
SMALL MANUFACTURERS
1. Arroz Come The company just sells rice. It has three brands: a premium one (Come
Tudo
Tudo), a medium (Carsil) and a low price (Que prazer). The company is
from Minas Gerais and has more or less 400 clients.
2. Café Caiçara The company’s main product is coffee. It also sells coffee filter, sugar,
cappuccino, colander; everything under the Caiçara brand. It operates in
the cities of Jundiai, Sorocaba and Campinas (on São Paulo State). The
company has been in the market for over 60 years and is the coffee
leading brand in the region they operate. It employs 50 people.
3. Farinha
It has sold corn flour for over 25 years. The product is commercialized
Rodrigues
only in Socorro and Bragança Paulista (two cities in São Paulo state). It
sells approximately 5 thousand kilos of flour per month. The company is
restricted to the owner, his father and his wife.
4. Feijão Dona The company sells rice and beans and has been in the market for more
Rosa
than 20 years. It has four different brands: The premium one (Dona Rosa),
the medium (Querido) and the low price (Chico and Banda Rei). The
company just sells in some low income neighborhoods of São Paulo city.
5. Leite Gege
The company has been in the market for more than 40 years and just sells
milk in some low income neighborhoods of São Paulo city. It has 70
employees and 22 trucks to distribute the product. It sells around 2.5
million liters of milk monthly.
WHOLESALERS AND DISTRIBUTORS
1. Danone
Exclusive Danone distributor. Sells to small retailers in the East region of
São Paulo city. Its portfolio is comprised of Danone products: Yogurt,
infant foods and water
2. Giro Trade
Distributor of the brands: Alcafoods (cereals), Nutrimental (infant food),
Barila (pastas), Niele (cosmetics) and Pepsico (with the brands Toddy,
Quaker, Kero Coco and Coqueiro). The company just sells in the state of
São Paulo, with a sales team of 35 people.
3. Kozzy
Distributor of the brands: Ajinomoto, Perfetti Van Melle, Bauducco, J
Macedo and Amacoco. It operates in São Paulo city. In 2009, the
company had 52 people in their sales team and 4 supervisors. Operations
started in 1997.
4. Peixoto
Second largest wholesaler in Brazil. Serves more than 90 thousand clients
with a sales team of more than 85 thousand people. The company has a
private label (Valor) and owns 350 trucks and vans. Sells 3,500 products
to 4 thousand of the 5.5 thousand cities in the country.
(Continue)
110
Company
5. RB
Distribuidora
Profile
Distributor of the brands Unilever, Sara Lee, Kimberly Clark, JMacedo,
Sukesh, Nutrimental and Gomes da Costa. Sells to 11 thousand clients in
Ceara state (Northeast Brazil). Considered by several of the interviewed
executives as a benchmark in distribution for BoP, owing to its capillarity
and relationship with small retailers.
SMALL RETAILERS
1. Supermarket Small supermarket in the region of Osasco city. It has 6 check-outs and is
Osasco
approximately 400 square meters in size.
2. Supermarket Small supermarket in the region of Sapopemba. The store has 8 checkSapopemba
outs and has been in business for 16 years.
SPECIALISTS
1. ABAD
Association that represents all wholesalers and distributors from Brazil.
(Brazilian
Wholesalers
and
Distributors
Association)
2. Consulting
Consulting company specialized in strategy and supply chain.
Company
TOTAL
10 Large Manufacturers
5 Small Manufacturers
5 Wholesalers/Distributors
2 Small Supermarkets
2 Specialists
24 Companies
Source: Elaborated by the author
Two of those companies were interviewed twice, with different executives, therefore in
total 26 interviews were made. All the interviews were recorded, transcribed and then included in
the software Atlas TI version 6.0. This software is frequently used for grounded theory
methodology (BANDEIRA-DE-MELLO, 2006). It allows the coding of all the material and to
create networks with the codes in order to evaluate conditions that are present on the
phenomenon.
So as not to identify positions of any of the executives/companies, the interviews were
codified. In the results analysis, the interviewed are shown as:
Mx: Interview x from a Large Manufacturer;
Sx: Specialist x;
Rx: Retailer x;
Dx: Distributor / Wholesaler x;
111
SMx: Small manufacturer x.
To assure confidentiality the numbers in the table above do not correspond to number x of
each interview.
The data obtained from Latin Panel were very useful to confirm information gathered at
the interviews such as the regional differences, the importance of small retail for BoP and of the
door-to-door channel in some categories.
DATA COLLECTION
The interviews with executives were the main element in which the substantive theory
emerged. As the analysis evolved, the questionnaire suffered some modifications in order to
identify some important issues and clarify some identified categories. The basic questionnaire
used is presented in Appendix 1.
The questionnaire basically tried to identify the perception of the executives about the
dilemmas and approaches to distribute consumer goods products to BoP markets. In order to
accomplish this objective a first set of questions sought to describe the distribution structure and
channels used by the companies. These questions had the purpose to identify the different ways
companies used to reach consumers. In this stage there wasn’t any specificity for BoP markets. It
worked also as an “ice break”.
Afterwards, interviewed executives were asked about their perceptions of the existing
differences to distribute to BoP markets comparatively to high income, and also to describe some
benchmarks. Interestingly, at this point most of the interviewed executive couldn’t present any
important difference related to distribution. Most of the answers were focused on the differences
in other types of strategies, such as product development and price. Although frustrating in a first
moment, these answers were of extreme relevance to support the idea that distribution was just
one of the pillars to reach low income consumers, and that companies that have an overall
strategy focusing BoP had better results in accessing the market.
The third set of questions centered on the experience of the executive/company in
distribution for low income markets. It was firstly asked the market share of the company,
comparing its market share in low income markets and high income. This allowed the
112
identification of the companies with more relative success at BoP. Secondly it was asked how the
company worked low income markets. At that point, a thick description was explored. Therefore,
the interaction was constant in order to get details and perceptions about the obstacles, difficulties
and mainly differences between high income and low income markets. For instance, many times
it was argued the interviewed executives: “If you sell to a small retailer. What is the difference
between selling to a small retailer in a slum or in the outskirts, and selling to a small retailer in an
affluent neighborhood?”. Here, many differences between distribution for low income and high
income markets started to appear.
The fourth set of questions tried to identify some insights of different approaches to BoP.
These were also questions that went deeper in the differences of BoP and high income markets.
Many times, however, those questions were already answered beforehand. Therefore, these
questions served almost as a check-list to see if any important point was missing.
Finally, before ending the interview, it was asked for the secret of success in distributing
products for BoP as a means of getting a summary of the interview and new ideas about the
strategies to reach the BoP market.
Although each interview covered the same broad topics, the researcher maintained the
ability to explore areas of special significance to an interviewee in depth. The goal of the data
collection was to understand the perspectives of interviewed executives in distinctive
characteristics of BoP markets and distribution strategies companies pursue to reach low income
consumers. The procedure is similar to that reported in previous research (ISABELLA, 1990).
Moreover, the set of questions had to be slightly adapted to small manufacturers, since
they sold mainly to low income markets and therefore the questions focused more in their
distribution and of their competitors than in the differences between low and high income
markets. For them, it wasn’t asked also about the market share of the company, because it was
always very small and companies didn’t have enough data.
Slight changes were also made on the questions for the distributors, in which it was not
asked about the market share of the company, once there wasn’t the purpose of defining their
success at BoP.
Accordingly, with specialists, the questionnaire was based on the distinctive
characteristics of BoP markets and the existing differences in marketing channels. As for small
retailers, a more unstructured interview was used, since the set was more informal and as a part of
113
field visit with distributors. Despite informal, they shed light to some important issues concerning
relationship in the marketing channel.
3.4.3
Analysis
Analyzing qualitative data is not easy and there is not a unique way to do it. As stated by
Corbin and Strauss (2008, p. 16), qualitative analysis “is not a process that can be rigidly
codified. What it requires, above all, is an intuitive sense of what is going on in the data; trust in
the self and the research process; and the ability to remain creative, flexible, and true to the data
all at the same time”. It can be understood that the researcher creativity is very important in data
analysis. The researcher has to have the ability to interpret data, give meaning to it and separate
what is important from unimportant.
Differently from other methods, grounded theory data analysis starts from the beginning
of data collection. The search for meaning through the questioning of data commences in the
early stages of data collection (GOULDING, 2000). The emphasis of grounded theory is not in
the way data are collected, but on how they are subsequently analyzed (GEIGER; TURLEY,
2003).
According to Creswell21 (2007, apud FREITAS, 2009), this process of simultaneously
collecting and analyzing data can be called ‘zig-zag’, since researcher collects data, analyzes data
collected, generates categories, go back to the field, analyzes again data, compares, creates or
confirms categories. This process continues until any new findings appear and allows generating
propositions and hypothesis to develop a theory. The figure below presents this idea.
21
CRESWELL, J.W. Qualitative Inquiry & Research Design: Choosing among five approaches.
Thousand Oak, CA: Sage. 2007.
114
Data
Collection
Data
Analysis
Zig Zag
Participants
Emergence of
categories
Open Codes
Selection of major
categories
Identification of
Major categories
Theoretical Sampling
Propositions or
Hypothesis
Theory
Figure 3-2: Zig-Zag. The process of Grounded Theory analysis.
Source: Freitas (2009, p. 116)
Many authors have different strategies to analyze data (CORBIN; STRAUSS, 2008).
Some key points in analyzing data are: asking questions, coding and constant comparison.
(SUDDABY, 2006; BRYANT; CHARMAZ, 2007; CORBIN; STRAUSS, 2008).
ASKING QUESTIONS
The use of questioning the data is a means to constantly think about the problem and
possible analysis. It is a way to think out of the box and dive deeper into the problem. Four kinds
of questions that can be asked are (CORBIN; STRAUSS, 2008):
a) Sensitizing questions: These questions look for what data might be indicating.
Examples of this kind of question used in this research were: How do executives
perceive BoP in their companies? What is the relevance of BoP for them? What is
really different in BoP approach?
b) Theoretical questions: They help to see the process and interrelate concepts. Examples
of this kind of question used in this research were: What is the relation between
company structure and development of strategy for BoP? What would happen if a
strategy developed for BoP were used for high income consumers?
c) Practical questions: They provide direction for theoretical sampling and help with the
development of the structure of the theory. Examples of this kind of question used in
this research were: Which are important companies/people that could help in this
research?
115
d) Guiding questions: They guide the interviews, observations, document gathering. In
the case of this research the guiding questions were related to the main strategies to
reach BoP used by manufacturers.
CODING
Coding is a major analytic procedure, or even, the core of grounded theory. This coding
has been reinforced by proliferation of softwares that support qualitative analysis. (BRYANT;
CHARMAZ, 2007).
In terms of analyzing the data itself, this usually starts with a ‘line-by-line’
analysis during which every line of the transcribed interview is searched for key
words or phrases which give some insight into the behavior under study
(GOULDING, 2001, p. 26)
The analytical process involves coding strategies; the process of breaking down
interviews, observations and other forms of appropriate data into distinct units of meaning which
are labeled to generate concepts. The movement from relatively superficial observations to more
abstract theoretical categories is achieved through the constant interplay between data collection
and analysis that constitutes the constant comparative method. In the coding process, a key
element is to identify a higher level of abstraction— higher than the data itself (GOULDING,
2001; SUDDABY, 2006).
Coding helps to gain a new perspective on the material and to focus further data collection
and may lead to unforeseen directions. Coding is the first step to theory development and the
emergent categories are conceptual elements of a theory (GLASER; STRAUSS, 1967;
CHARMAZ, 2000).
In this research, firstly the transcribed interviews were included in the software. Then, all
the transcriptions were read carefully so as to codify the appropriate parts of the speeches. In a
first analysis, it was conducted an open coding, which means “breaking data apart and delineating
concepts to stand for blocks of raw data” (CORBIN; STRAUSS, 2008, p. 195). Each part of the
interviews was assigned to an emergent open coding. In a first analysis, 99 codes were identified
116
along the material. These codes were further analyzed in order to find dualities and the number of
codes was reduced to 76. The first and second open codings are presented in Appendix 2.
Afterwards (or almost simultaneously), an axial coding was conducted, examining the
relationship between categories defined in the open coding (CORBIN; STRAUSS, 2008). This
stage of analysis produced 15 categories which are presented in Appendix 3. Finally, in a process
of selective coding (CORBIN; STRAUSS, 2008; BANDEIRA DE MELLO, 2002) those
categories were broken down and renamed, which generated the final 6 categories presented in
Appendix 4. This procedure is similar to that reported in previous research (BROWNING et al,
1995).
CONSTANT COMPARISON
According to Corbin and Strauss (2008), there are two different types of comparison
making: (a) constant comparisons, and (b) theoretical comparisons.
Constant comparison contradicts the myth of a clean separation between data collection
and analysis (SUDDABY, 2006). In constant comparison researcher compare data incident with
incident in order to classify data, and to seek similarities and differences (CORBIN; STRAUSS,
2008).
The constant comparative method of grounded theory means: (a) comparing
different people (such as their views, situations, actions, accounts and
experiences); (b) comparing data from the same individuals with themselves at
different points in time; (c) comparing incident with incident; (d) comparing a
category with other categories (CHARMAZ, 2000, p. 515).
In this research, constant comparison was done mainly between large and local
companies’ view of distribution strategies to the BoP market, as well as manufacturers’,
distributors’ and specialists’ view. This constant comparison analysis was the basis for
conducting the axial and selective coding detailed in last section.
Furthermore, sometimes theoretical comparisons were made. This occurs when it is
difficult to classify or define an incident. Then, theoretical comparisons can be tools to assist the
analyst to get a definition or understand a phenomenon (CORBIN; STRAUSS, 2008). The central
117
idea is that researchers constantly compare theory and data, in order to develop a theory that
emerges from the data (EINSENHARDT, 1989).
In this theoretical comparison, some codes and constructs appeared and showed the
importance of carrying out a deeper analysis of some constructs in the literature, such as trust,
relationship, time of relationship, continuity. It was also apparent that the presence of some
resources and competences made a great difference on the definition of a distribution strategy and
because of that the RBV theory was retrieved.
3.5
Development of a Theory
The ultimate goal of the grounded theory researcher is to develop theory which goes
beyond thick description. The development of theory that is grounded on the experiences of those
living with and creating the phenomenon is especially vital to the continued development of
organization studies as a field (SHAH, CORLEY, 2006).
It is quite important to differentiate description from theory building (BRYANT;
CHARMAZ, 2007). Description is the basis for more abstract interpretations of data and theory
development. It is also basic to conceptual ordering (CORBIN; STRAUSS, 2008).
Theory can be defined as:
Theory denotes a set of well-developed categories (themes, concepts) that are
systematically interrelated through statements of relationship to form a
theoretical framework that explains some phenomenon (CORBIN; STRAUSS,
2008, p. 55).
Furthermore,
The purpose of theory is to increase scientific understanding through a
systematized structure capable of both explaining and predicting phenomena
(HUNT, 1983, p. 10).
118
Developing a theory is complex. It involves interpretation and condensing raw data into
concepts, which should be arranged logically in order to explain a phenomenon (CORBIN;
STRAUSS, 2008). A complete theory must contain four essential elements (WHETTEN, 1989):
1. What: Which factors (variables, constructs, concepts) should be considered as part of
the explanation of the social or individual phenomena. Two criteria to decide which
factors are important are comprehensiveness (i.e., are all relevant factors included?)
and parsimony (i.e., are there some factors that could be deleted because they add
little or no value?)
2. How: Next it is important to define how the factors analyzed are related.
“Operationally this involves using ‘arrows’ to connect boxes’”( WHETTEN, 1989, p.
491)
3. Why: The theory should be able to explain the reasons of the interrelationships of the
factors. It constitutes the theory’s assumptions. While the ‘What’ and ‘How’ elements
describe, the ‘Why’ explains.
4. Who, Where and When: These elements contextualize the theory and define
limitations to the propositions generated in the theoretical model.
According to Goulding (2001), a theory should have the following attributes:
1- Should be a plausible statement of a series of relationships across concepts, and sets of
concepts which can be traced back to the data.
2- Should be conceptually dense
3- Should include many conceptual relationships presented in a discursive form which is
embedded in conceptual writing.
4- Should be seen as fluid, due to the fact that they should embrace the interactions of
multiple actors, and emphasize temporality.
The process of developing theory occurs in two basic stages: the descriptive and the
normative one. Within these stages it is possible to identify three different steps (CARLILE;
CHRISTENSEN, 2005):
1- Researchers observe phenomena and carefully describe and measure what they see.
2- Researchers classify the phenomena into categories.
119
3- Researchers explore the association between the category-defining attributes and the
outcomes observed.
This process proposed by Carlile and Christensen (2005) is very similar to the grounded
theory. The theory formulated in grounded theory is not a formal one, in the positivistic sense,
but a substantive one. A difference between formal and substantive is that, while the first one is
more generic and applies to a larger number of disciplines and problems; the last one is specific
for a group or situation. Another difference is that substantive theory explains a ‘reality’, turned
real by the subjects and not an absolute truth (BANDEIRA-DE-MELLO; CUNHA, 2006).
Substantive theory is especially important when a social phenomenon, in a specific area, is
insufficiently explained by general theories (BANDEIRA-DE-MELLO, 2002).
A substantive theory consists of categories, properties and dimensions. “Categories, and
the properties that define or illuminate the categories, are conceptual elements of the theory”
(MERRIAM, 1998).
The development of a theory demanded an effort of abstraction. Besides the importance of
some channels (such as small retail and door to door) most of the interviewed people declare that
there weren’t many differences between distribution strategies for BoP and high income markets.
It was just after some analysis and discussion with colleagues that the idea of differences and
mainly of the aspects that created a more robust distribution strategy appeared.
The substantive theory built in this work is based on the executives’ views on distribution
strategies to reach BoP markets. Therefore, the analysis unit of the research is the manufacturer
that is willing to access the market, always based on the speech of the executives. The elements
of this theory will be detailed in chapter 6.
120
4
BRAZILIAN MARKET OVERVIEW
4.1
Introduction
This chapter presents an overview of Brazilian Market. It doesn’t aim to be an exhaustive
analysis, but just to discuss some important issues of the economy, income distribution and
channel structure of the country, so as to better understand the macro-environment in which this
research is done.
4.2
Brazilian Socio-Economic Overview
Brazil is a country with a population of over 190 million people22. In 2008, the Gross
Domestic Product (GDP) of the country was of US$ 1.6 trillion with a GDP per capita of US$ 8.3
thousands23. It is considered one of the main emerging markets, being the “B” of the BRICs, term
coined to design Brazil, Russia, India and China, which are huge countries with high growth
potential. It is the ninth world GDP measured by purchasing power parity (PPP, 2007)24.
Though, Brazilian economy is one of the largest of the world, the income concentration is
still very high. In 2004, the richest 10% of households represented 45% of the income, while the
poorest 10% had only 0.9% of total income25. With that, the Gini index of the country was of
0.5486 in 2008, much higher than Russia (0.415), India (0.368) and China (0.47)26, indicating a
higher income concentration in Brazil.
Despite the high income concentration of the country, since 1994, Brazilian economy has
realized important achievements. Economic stability, with the end of high inflation rates, was one
of the main economic conquests that allowed a more sustainable growth. In 1993, the annual
22
IBGE (Brazilian Institute of Geography and Statistics) – October/2009.
Ibid
24
World Bank, in
http://web.worldbank.org/WBSITE/EXTERNAL/COUNTRIES/LACEXT/BRAZILEXTN/0,,menuPK:322351~page
PK:141132~piPK:141107~theSitePK:322341,00.html accessed on October 20th 2009.
25
Worldbank
26
Ibid
23
121
inflation rate was of 2477%. In the first semester of 1994 the inflation was of 759%; in the
second semester of that year it dropped to 18% and in the year of 1995 the inflation was of less
than 15%. In 2008, the inflation was of 5.9%27.
The strong reduction of inflation was very important to BoP markets in Brazil, since this
population hadn’t bank account and didn’t have any way to protect themselves against high
inflation.
Besides inflation reduction, other issues had an important influence in Brazilian population
income, such as28:
•
Growth of formal jobs: In 2003 the unemployment rate in Brazil was of 10.5%. In
2007, this number has dropped to 8.9%. In September 2009, the unemployment
was of 7.7%. This reduction allowed access to employment to many people and it
benefited low income population.
•
Social Programs: In 2009, Brazil had many social programs that helped poor
people. The most famous is “Bolsa Familia”, which offered money to families
with income below R$ 140 per person per month. The values offered in this
program varied from R$ 22 to R$ 200 and in 2009 it had already reached more
than 11 million people29. Despite many criticisms around the program because of
its donation condition and of not having a clear “exit door”, due to the fact that
people get used to the extra money and there isn’t clear policies to take them out of
poverty; this program was very important because of its reach, mainly in
Northeast, and its impact on economy, once there was extra money circulating in
the market.
•
Growth of minimum wages: The minimum wage had grown much more than
inflation in recent years. From January 2004 to October 2009, minimum wages in
Brazil had increased 47% in a deflated basis. In dollars, the Minimum wages had
increased from US$ 84 (May 2004) to US$ 245 (July 2009). This growth was very
important for low income population that many times has their salary indexed on
27
Source: Brazil Central Bank.
The objective is not to be exhaustive, but just to present some important changes in socio-economic variables in
Brazil.
29
http://www.mds.gov.br/bolsafamilia/ accessed in Nov 19th 2009.
28
122
the minimum wage. Next chart presents the evolution of the minimum wages in
R$ deflated.
500
480
R$
460
440
420
400
380
360
340
320
2009.10
2009.07
2009.04
2009.01
2008.10
2008.07
2008.04
2008.01
2007.10
2007.07
2007.04
2007.01
2006.10
2006.07
2006.04
2006.01
2005.10
2005.07
2005.04
2005.01
2004.10
2004.07
2004.04
2004.01
300
Figure 4-1: Minimum Salary Evolution
Source: IPEADATA
•
Women participation in Economy: Women participation in Brazilian workforce
had grown 42% from 1998 to 2008. This also has a great impact on economy
because it changes the family structure and it helps in family income.
With those changes, the income distribution, which is still very concentrated as illustrated
before, is improving. The figure below shows the increase on income by deciles of the population
from 2003 to 2008, starting with the poorest people. The growth taxes are decreasing as we go
from the first decile (58.8%) to the last decile – 21.1% (NERI, 2009).
123
58,79%
60,00%
53,37% 52,41%
47,14%
50,00%
44,49%
40,87%
36,80%
40,00%
31,59%
26,28%
30,00%
21,11%
20,00%
10,00%
0,00%
10
20
30
40
50
60
70
80
90
100
Figure 4-2: Variation of Average income per decile (2008/2003)
Source: Neri (2009, p. 41)
This also can be perceived in the reduction of the Gini index in recent years.
0,61
0,583
0,5886
0,5486
0,555
0,5623
0,5682
0,5711
0,54
0,5957
0,55
0,5937
0,56
0,6001
0,6004
0,57
0,5832
0,58
0,5994
0,59
0,6019
0,6068
0,6
0,53
Figure 4-3: Evolution of Gini Index – Brazil
Source: Neri (2009, p. 40)
According to the Brazilian Association of Research Companies (ABEP) based on the
socio-economic survey from the Brazilian Institute of Public Opinion and Statistics (IBOPE –
one of the major research companies in Latin America), the average income for the social classes
are presented below:
124
Table 4.1: Social Classes Division – Brazil in prices of December 200830
SOCIAL
CLASSES
A1
A2
B1
B2
C1
C2
D
E
MONTHLY FAMILY
INCOME (R$)
14.366
8.099
4.558
2.327
1.391
933
618
403
MONTHLY FAMILY
INCOME (US$)
8.256
4.655
2.620
1.337
799
536
355
232
1
DISTRIBUTION OF BRAZIL
POPULATION
0,60%
4,40%
9,10%
18,00%
24,50%
23,90%
17,90%
1,60%
1
Considered 1 US$ = R$ 1,74 (quotation from January 1st 2010)
Source: ABEP (Brazilian Association of Research Companies)
Brazil has also many income differences. Northeast is the poorest region of the country,
with the lowest per capita income and highest proportion of D and E classes, as it can be noticed
in the table below.
Table 4.2: Per Capita Income per Region
Northeast
North
Center
Southeast
South
2003
R$ 251,20
R$ 317,59
R$ 504,24
R$ 572,09
R$ 560,42
2008
R$ 357,99
R$ 429,99
R$ 713,74
R$ 708,82
R$ 720,09
Annual Growth
7,34%
6,25%
7,20%
4,38%
5,14%
Source: Adapted from Neri (2009)
4.3
Brazilian Marketing Channel Structure
As seen in the literature, manufacturers use many different ways to reach the consumer.
The channel strategy depends on the product, industry structure and company strategy.
Companies usually use more than just one channel strategy. It is rare the organization that just
uses one kind of distribution model.
30
In December 31st 2008, US$ 1 = R$ 2,33
125
4.3.1
Main Retail Formats used by Brazilians
4.3.1.1 Methodology of this section
The analysis of the following part was carried out based on a panel research from Latin
Panel, in which researchers visit homes nationwide weekly. The sample of the panel represents
82% of Brazilian households and 86% of the potential national consumption. The research
collects and documents the spontaneous purchasing behavior of Brazilian households for food,
personal care and household cleaning products, in a total of 94 categories. All cities with
populations over 10 thousand inhabitants are visited, except for the Northern region where cities
with over 200 thousand inhabitants are visited.
For this analysis the data were consolidated by year, category and channel from 2004 to
2008, in order to evaluate the purchasing behavior of several categories; in different channels;
regions, and with the target segmented by social class – according to the Brazilian Criterion.
4.3.1.2 Channel Representativeness Analysis
The chart below shows how over half the consumer goods purchasing volume of the
Brazilian population (59%) is done at supermarkets. The second most relevant channel is
“Traditional Retailing” (26%). Together these two channels represent almost 85% of sales in the
categories studied. Despite their strong presence in big cities, hypermarkets represent less than
5% of the purchasing volume.
126
Channels relevance per region - 2008
120,0
100,0
OTHERS
80,0
WHOLESALERS
60,0
DRUGSTORES
DOOR TO DOOR
40,0
TRADITIONAL
20,0
SUPERMARKET
0,0
BRAZIL
TOTAL
N/NE
CENTER WEST
EAST+IRJ
GREAT RJ
GREAT SP
INT SP
SOUTH
HYPERMARKET
HYPERMARKET
SUPERMARKET
TRADITIONAL
DOOR TO
DOOR
DRUGSTORES
WHOLESALER
S
OTHERS
4,9
4,0
4,0
0,9
3,8
11,2
4,7
6,8
58,8
35,5
72,4
68,0
59,0
57,5
68,4
73,4
25,8
49,3
13,7
23,3
26,2
17,2
14,6
10,4
4,2
5,9
3,7
3,6
3,4
4,5
4,0
2,3
1,9
1,4
1,0
2,0
2,9
3,1
1,9
2,0
2,6
2,5
3,6
0,8
0,3
5,1
4,2
1,9
2,0
1,3
1,6
1,4
4,4
1,4
2,2
3,1
Figure 4-4: Channels relevance per channel (R$).
Source: Latin Panel (2008)
However, wide variations by region can be observed. In the Northeast, for instance,
“Traditional Retailing” is the main purchasing channel, followed by supermarkets. In that region,
“door-to-door” sales (5.9%) are surprisingly higher than that of hypermarkets (4.0%). In the
Center West and the South “Traditional Retailing” is a lot less expressive, replaced by
supermarkets which represent almost ¾ of sales in those regions. In the Greater São Paulo, the
attention goes to the sales through hypermarkets and wholesalers/cooperatives, pointing to the
fact that in this region consumers tend to make their purchases in large stores. These two
channels are virtually as relevant as “Traditional Retailing”.
The country’s second largest metropolis (Greater Rio de Janeiro) does not have the same
behavior. In Rio de Janeiro, “Traditional Retailing” is very significant and is actually surpassed
only by the Northern/Northeastern regions.
The table below shows that, despite a small difference in the numbers, mainly in “other
channels” and “drugstores / cosmetic stores”, the analysis does not change much when data are
evaluated by sales volumes instead of value (revenues).
127
Table 4.3: Channels relevance per channel (volume)
BRAZIL
NORTH/NORTHEAST
CENTER WEST
EAST+IRJ
GREAT RJ
GREAT SP
INT SP
SOUTH
TOTAL
MARKET
HYPERMARKET
SUPERMARKET
TRADITIONAL
DOOR TO DOOR
DRUGSTORES
WHOLESALERS
OTHERS
100,0
100,0
100,0
100,0
100,0
100,0
100,0
100,0
4,6
3,2
3,8
0,9
3,5
10,7
4,3
7,0
57,1
29,5
74,0
69,0
59,1
55,9
64,6
74,1
24,7
48,5
12,8
22,4
25,5
14,8
12,5
10,7
4,6
11,4
0,7
1,3
1,8
4,3
4,5
0,7
0,1
0,0
0,0
0,1
0,3
0,2
0,1
0,1
2,4
2,3
3,3
0,8
0,3
4,7
4,0
2,0
6,9
5,2
5,4
5,6
9,5
9,4
10,1
5,5
Source: Latin Panel (2008)
As well as great differences in the purchasing behavior per region, expressive variations
can be seen when analysis is done looking at social classes.
70,0
60,0
HYPERMARKET
50,0
SUPERMARKET
40,0
TRADITINAL
30,0
DOOR TO DOOR
DRUGSTORES
20,0
WHOLESALESRS
OTHERS
10,0
0,0
TOTAL
BRAZIL
HYPERMARKET
SUPERMARKET
TRADITINAL
DOOR TO DOOR
DRUGSTORES
WHOLESALESRS
OTHERS
A/B
C
TOTAL
4,9
58,8
25,8
4,2
1,9
2,6
2,0
D/E
A/B
10,4
64,5
13,2
3,2
2,0
4,8
1,9
C
3,6
61,4
24,6
4,2
2,3
1,9
2,0
D/E
1,6
50,9
37,5
4,9
1,5
1,4
2,1
Figure 4-5: Channels relevance per social class (in R$).
Source: Latin Panel (2008)
As it can be seen in the data above traditional retailing has higher relevance in the lower
social classes. The inverse occurs with hypermarkets, clearly showing this format’s inadequacy
for low income families. Supermarkets and wholesalers are also weaker for lower income
households, whereas “door-to-door” has a higher relevance in the lower classes.
128
Regarding frequency, consumers go to traditional retailing stores once every three days, on
average, which demonstrates a potential for the development of a relationship between the
retailer and this consumer. This frequency is even higher in the lower social classes.
Table 4.4: Visits per year per social class
TOTAL
MARKET
TOTAL
A/B
C
D/E
HYPERMARKET SUPERMARKET TRADITIONAL DOOR TO DOOR DRUGSTORES
167,07
156,95
171,70
168,67
10,57
14,42
9,15
6,57
55,91
68,84
58,29
46,15
124,19
101,62
126,39
133,34
9,02
9,91
8,78
8,82
4,92
5,37
5,05
4,45
WHOLESALERS
OTHERS
8,04
9,94
6,72
7,15
16,11
12,21
15,72
18,51
Source: Latin Panel (2008)
4.3.1.3 Historical Analysis
In the analysis of the past five years (2004 to 2008), some antagonistic movements could
be observed. While supermarket channel showed an initial drop, to subsequently grow, traditional
retailing showed an inverse movement, growing in the years 2005 and 2006 and dropping in 2007
and 2008. The Hypermarket channel, however, has shown a constant fall all over those years,
going from 6.5% to 4.9%, while “door-to-door” showed a constant growth, going from 3.5% to
4.2%. The Wholesaler/Cooperative channel has also shown expressive growth, despite the fact
that its presence is still low.
129
70,0
60,0
50,0
HYPERMARKET
40,0
SUPERMARKET
30,0
TRADITIONAL
DOOR TO DOOR
20,0
10,0
0,0
2004
BRASIL
2004
2005
2006
2007
2008
2005
HYPERMARKET SUPERMARKET
6,5
56,7
5,7
52,5
5,3
53,3
5,2
55,6
4,9
2006
2007
TRADITIONAL
26,0
30,5
31,7
29,2
DOOR TO DOOR
3,5
3,6
3,8
4,0
DRUGSTORE
1,7
1,9
1,8
1,5
WHOLESALER
1,8
2,2
2,2
2,5
OTHERS
3,9
3,7
1,9
2,1
25,8
4,2
1,9
2,6
2,0
58,8
2008
Figure 4-6: Channels relevance per year
Source: Latin Panel (2008)
4.3.1.4 Summary of Retail formats used in Brazil
What can be noticed from the above data is a better fit of some channels for determined
regions, social classes and product categories:
•
Hypermarket is a declining channel, more suitable for higher income classes. Of very
little relevance to BoP population.
•
Supermarket is the most relevant channel in Brazil. Only in the N/NE regions it is
surpassed by the “Traditional retailing” channel. Following a drop in its presence in 2005,
supermarkets regained strength in the last three years.
•
“Traditional retailing” is very strong in BoP markets and in the Northern/Northeastern
regions. However, in the past years it has moved opposite to supermarkets and has lost
130
some of its strength. It can be described as a channel for frequent purchases, mainly for
perishables.
•
“Door to door” is a personal care products oriented channel. “Traditional retailing” is
more relevant in the lower social classes, but, different from this channel, it has grown in
the past years, due to a growth in the average ticket.
•
Contrary to Hypermarkets, the “Wholesaler/Cooperatives” channel has been gaining
presence in the past years. Despite that, it has little relevance, being a little more
expressive in the state of São Paulo and in the higher classes – clearly competing with the
Hypermarket format.
131
5
RESULTS
5.1
Introduction
This chapter presents the results of the field research. It has a more descriptive approach and
it is based in the categories created from the selective coding presented in Appendix 4 and
summarized in the figure below.
Section 5.2
Section 5.5
Satisfactory
Distribution
Success
Section 5.3
BoP Environment
Section 5.6
Direct Sales
Retailers
Institutional Voids
Competition BoP
market
Channel
Design
Wholesalers/
Distributors
Strategy
Execution of
Marketing
Channel Strategy
BoP DNA
Competences
Company
Structure
Operation
Marketing
Channel
BoP knowledge
BoP
knowledge
Chapter 5.4
BoP Market
Partnership
Relationship
Relationship
Figure 5-1: Categories resulting from the selective coding.
Source: Elaborated by the author
In the first part, the definition of a satisfactory distribution is presented. The category that
explains this part is “success”. In the second part, the marketing channels used by manufacturers
are described. To be more didactic, this part was structured based on the channel levels proposed
by Rosenbloom (1999). The category that explains this part is “execution of marketing channel
strategy”.
The third part presents the category “Relationship”. Using the same logic as for
“execution of marketing channel strategy”, the description of this category used the constructs
132
discussed in the knowledge review. The fourth part presents BoP environmental characteristics
and is explained by category “BoP environment”. The fifth part presents manufacturers’
strategies to reach BoP and is related to the categories “BoP knowledge” and “BoP DNA”. The
sixth and seventh parts are related to the open code of “innovation” that afterwards made part of
strategy, and address some views about innovation and dichotomy about scalability and micro
actions. Although those two concepts didn’t ‘survive’ to the construction of the substantive
theory, they seemed relevant when comparing with the existing literature about BoP.
In order to explain the ideas of this chapter, the transcribed statements of the executives
interviewed were copied. Sometimes, these excerpts might be duplicated, since they make part of
two codes. The statements were translated to English, with the attempt of maintaining fidelity to
the original idea.
So as not to identify the company, sometimes the products or even names of competitors
were changed to “X” or “Y”. It was also included, when necessary, for the understanding of the
situation, the question made by the researcher. In these cases, the question is always initiated with
the word “interviewer” and the answer with “executive”.
5.2
Satisfactory Distribution
This section aims at defining what is a satisfactory distribution and how the interviewed
companies might be evaluated in their access to BoP.
Firstly, the definition of what it is to have a satisfactory distribution came out of the
interviews, when they were asked about a benchmark company that operates at BoP and the
reasons why it is considered a benchmark. Most of the interviewed executives’ first answer was
related to companies that had a good numeric distribution. Or in other words, companies that are
able to access almost 100% of their target market. In that sense, companies that sell directly to
small retailers and companies with a good partnership with distributors were the ones they most
recalled. The following statements help to understand this point.
Interviewer: Why do you think Company X has a good distribution for BoP?
Executive: Because it is cheap and we can find it anywhere (M8).
133
Coffee makers are very regional but they are in the entire marketing channel
(M4).
Companies that do the best job in low income markets are those that sell directly
to small retailers, exactly because of the capillarity (M3).
Company Y has a good distribution. Its portfolio is adequate for small retailers
and they do a good job in the Northeast (M6).
Secondly, the size of the company market share in low income markets comparatively to
higher income markets was also used. Although this variable didn’t come from data, it was
considered relevant to define the success of a company in BoP. If a company has a higher market
share in low income markets, it is deduced that it is more oriented to this market and therefore it
has proper strategies to reach BoP (at least in comparison to their competitors).
The table below shows a preliminary attempt to identify how the analyzed companies are
perceived by their executives taking into account those two dimensions. Based on those
perceptions, the satisfactory access was defined. The more “stars” the more satisfactory the
access. As it was not possible to differentiate the distribution of the small manufacturers
analyzed, all of them are integrated as if they were just one company.
134
Table 5.1: Executives perceptions on the dimensions that define satisfactory distribution2
Comp
any
M1
M2
M3
M4
M5
M6
M7
M8
High numeric distribution1
Market share in BoP markets1
Our potential is 300 thousand
points of sale, and we reach
almost all of them with at least
one product.
***
We reach around 100 thousand
points of sales and the potential is
for 350 thousands.
**
We are in about 1/3 of Brazilian
point if sales.
**
We must have the right product, and the
difficulty in reaching BoP is that I need to be in
some places that I am not used to.
**
We estimate that we are in 1/3 of
the point of sales.
**
We reach 90% of the market.
****
In some products we have 90% of
reach.
****
Out of 350 thousand points of
sales we reach approximately 100
thousand.
**
Out of 500 thousand points of
sale, we reach approximately 120
thousands.
**
Satisfactory
Distribution
**
I have a higher market share in low income
markets
*****
***
Our market share in Brazil is of 30%. I imagine
that we have something around 50% in high
income classes and 20% in low income.
**
Our share is much higher in high income
markets.
*
We have a 55% market share. In low income
markets, this figure is about 40%.
***
It depends on the category. We have some
products oriented to BoP with a high share.
****
I have a 15% market share and in low income
we represent approximately 10%.
**
**
*
****
****
**
We have a 7% market share. This share is very
***
well balanced among social classes, but it is
higher in low income classes. That is because we
have an aggressive price, mainly in some
products.
****
M9
We are everywhere. If you go to a We have a higher penetration in medium for low
****
slum, we are there.
income.
*****
****
M10
We reach around 100 thousand
Our products are basically oriented for the C and
***
points of sales and the potential is D classes. We reach the self-service retailer, but
for 360 thousands.
we have difficulties with the informal retailer.
**
****
SMs
Have a good reach in their region.
Sell basically for low income.
*****
*****
*****
1
Excerpts from the interviews. In two cases, the researcher called interviewed executives again to have a
better statement, since it wasn’t possible to get the information from the first interview.
2
The number of ‘stars’ indicates a higher presence of the variable.
Source: Elaborated by the author
135
5.3
Marketing channels
5.3.1
Introduction
This section describes the marketing channels that manufacturers use to reach BoP
consumers in the perspective of executives interviewed and it concludes with an identification of
the most suitable marketing channels to reach BoP, according to interviewed executives. In order
to describe the marketing channels used by manufacturers, it was used the structure presented in
Figure 2-5, which is replicated below.
Level Two
Level Three
Level Four
Level Five
Producer
Producer
Producer
Producer
Sales Agent
Wholesale
Wholesale
Retail
Retail
Retail
Consumer
Consumer
Consumer
Figure 5-2: Channel structures for consumer goods.
Source: ROSENBLOOM (1999, p.23).
Consumer
136
5.3.2
Level Two - Direct to consumers
This channel is basically represented by companies that sell directly to consumers with a
door-to-door operation31. According to interviewed executives, this marketing channel is being
used more intensively by manufacturers to reach the BoP population. This could be confirmed in
data analysis from data panel presented in last chapter. This channel has several strengths and
weaknesses to operate at BoP. The most important strengths pointed out by executives were:
a. It is more convenient for the consumer.
In small retail, consumer has to pay cash and has to go there to get the product.
Door to door is a differentiated sale (D4).
b. It can be an extra channel.
Door to door operations get many sales from third line brands. The salesperson
goes to the consumer’s door and he/she can pay after 30 days, so the consumer
chooses our brand. In small retail, the consumer gets the cheapest product (D4).
What is extraordinary in the door-to-door channel is that when there is any
problem in economy, the door-to-door channel sells very well (M9).
c. It reaches BoP and stimulates relationship and trust.
I will tell you something: poor people are those that purchase the most through
door-to-door (D4).
Interviewer: Why doesn’t the consumer purchase at the small retail, since it is
cheaper over there?
Executive: Because of the friendship with the salesperson (D4).
On the other hand, the most important weaknesses were:
a. It is seen as an expensive and complex channel.
Door to door is only for extremely profitable categories (M7).
31
Although web sales could be theoretically an important direct to consumers channel, it was not considered in this
work as it is not representative for BoP.
137
Yakult has taken years to build its base and you need an orientation to be able to
work (door-to-door) because you need to have this culture. We don’t have this
culture so it is extremely complicated (M3).
It is difficult to control and there is a high risk of robbery (D1).
The equation of the door-to-door model doesn’t work [because it is too
expensive] (M6).
b. As the cost is high, it is important to have a larger portfolio.
The question is “how this operation [door-to-door] may be feasible? (…) Nestlé
has the portfolio for that, to dilute costs. I don’t have. For me it is complicated
because of the costs (M7).
c. The final price is higher for the consumer.
The final price is higher for the consumer. If you get the price I offer to the doorto-door salesperson and compare to the price of the small retail, the price is
almost the same and the salesperson still includes his/her margin (D4).
Summing up, interviewed executives considered this channel as costly and complex, but it
offers the possibility to establish new relationships with BoP consumers, to offer an additional
convenience and to reach scattered and difficult places.
5.3.3
Level Three - Direct to Retail
Level Three might be divided into two main possibilities: sales from manufacturers to
large and medium retailers and sales to small retailers.
5.3.3.1 Large & Medium Retailers
The data analysis from Latin Panel, described in chapter 4, indicates that large retailers
are not the most appropriate place for BoP to buy their products. It is a format distant from their
reality not only because they are not located near poor population, but also because they don’t
dialogue very well with this population in terms of communication, assortment and even services.
138
Nevertheless, except from one large manufacturer interviewed, large retailers, represented by
Walmart, Carrefour and Pão de Açúcar, account for approximately 20% of their sales.
The hypermarkets we have in Brazil serve higher income classes. They are
located in richer neighborhoods (M6).
Negotiation with large retailers is very tough and in many interviews it was considered the
less profitable channel. Owing to that, many small manufacturers don’t sell products through this
channel, and those who sell have many difficulties to operate continuously with them.
Large retailers want everything at the same time. If a product is not on shelf, he
immediately puts another in the same place. Relationship is based on volume
and profitability. At small retails in the outskirts, relationship is friendlier
(SM2).
Interviewer: If Carrefour, for instance, came here and asked for tons of your
products, would you sell to them?
Executive: The problem with Carrefour is that it has a high cost […] Carrefour,
Walmart and Pão de Açúcar have rigid contracts and the cost is high. […] If I
include this cost in my price, it will be expensive for them. If I don’t include, it
will be difficult for me (SM4).
Despite the fact that many manufacturers consider this channel as a ‘necessary evil’, large
retailers are considered very important as a shop window for the manufacturer’s portfolio.
Hypermarkets offer the possibility to expose a mix richer than any other channel. The next
statements help to clarify this point.
There is something very important in the largest retailers. Hypermarkets as a
whole, allow us to work the brands. I am talking about products, price and point
of sale exposition (M6).
Large retailers are a shop window for me. But it is an expensive shop window
(M7).
With the growth of the BoP market, the largest retailers in Brazil have operations and
formats oriented towards BoP. For instance, Walmart has “Todo Dia” and “Balaio”, Carrefour
has “Dia%” and Pão de Açúcar has “Comprebem”. These formats are still new and with a high
expansion potential.
139
Is there a price war today? Yes, but it is not sufficient to motivate a person to get
a bus and to purchase in a Carrefour which is 2 km far. The average ticket is R$
15 and it is not worthwhile. The consumer loses the economy on the bus fare. As
a consequence we see two phenomena. Large retail expanding to low income
markets as it is the case of Carrefour with Dia%, Walmart with Balaio in
Northeast and the expansion of the Cash and carry format (M1).
One of the threats of my business is the expansion of new formats like Dia% and
Balaio, because these stores are affecting the medium retailer sales (D1).
Moreover, many interviewed executives declared that there are some medium retailers
that have good operations at BoP. For instance, in São Paulo city, there are Nagumo, Ricoy and
Andorinha, to name a few. Most of these medium retailers were small stores that grew and turned
into local companies, very important in their region. Owing to that, some interviewed executives
believe that these retailers have a better knowledge of BoP markets.
Guanabara in Rio de Janeiro, Ricoy in São Paulo, Bretas in Minas Gerais; these
retailers understand very well low income consumers (M1).
However no different strategy to reach large and medium retailers by the analyzed
companies could be perceived. Some of the manufacturers sell directly to them and some through
distributors. They are considered just as medium retailers and the only thing that changes is the
product mix offered.
Summing up, large and medium retailers are served by large manufacturers with a similar
strategy. The difference for BoP is that there are some medium retailers that have a strong
operation in low income markets and therefore offer a better access to this population. Large
retailers have more recently developed new store formats to be closer to this consumer. Possibly
in a near future, large retailers will be more representative for BoP, but they are still not
considered as an important channel for this market. On the other hand, small manufacturers just
exceptionally sell to large and medium retailers, which have a low representativeness in their
business.
140
5.3.3.2 Small retailers
Due to all the difficulties to sell in a large country as Brazil with over one million points
of sales - in its majority small firms - just a handful of companies, mainly in the beverage sector,
sells directly to small retailers.
I can serve this small retail directly if I am a Coca Cola, a Souza Cruz (British
American Tobacco). I can reach the one million points of sales because I have
aggregated value. I don’t need wholesalers or distributors. (S1).
While this channel demands a huge and much more complex structure for large
companies, selling directly to small retailers is the only feasible channel for local companies. But
even for small local companies it is considered important to have an efficient distribution so as to
keep low costs. The advantage of selling directly to small retailers is that you have “more
potential to turn your clients into loyal ones” (SM4).
Usually there are two kinds of direct distribution. They are not mutually exclusive and
companies may have both modalities:
a) Pre-sale: The company first sells the products and makes the delivery afterwards.
Usually local companies deliver within 24 hours, since they are close to their clients.
As they (clients of the company) are regional, I deliver in one day (SM4).
I visit the clients in my motorcycle and afterwards I load my Kombi and do the
freight with my Kombi full. I don’t make small deliveries; otherwise I work to
pay for fuel (SM1).
b) Prompt Delivery: Sale and delivery are made simultaneously. In other words, the
salesperson visits the retailers and delivers the quantity asked at the same time. The
visits are made with the car full of products and the client doesn’t need to wait.
Because of its convenience, prompt delivery is considered a source of competitive
advantage.
Small retailers are more loyal, because the traditional wholesaler doesn’t have
prompt delivery and the Cash & Carry is very difficult for him to access (D1).
Manufacturer X is a benchmark, because they sell using their kombis. They call
it prompt delivery. They sell and deliver at the same time (M10).
141
5.3.4
Level Four
Level four may be divided into three main possibilities: wholesalers, cash and carry and
distributors.
5.3.4.1 Wholesalers
Wholesalers are seen as the channel that supplies the market with volume. It doesn’t give
much support to the small retail and usually retailers buy from them based on quotation. Who has
the best price wins. Because of that there is not a great relationship neither with manufacturers
nor with retailers. It is just a transactional relationship without any kind of partnership.
I don’t think that the wholesaler channel is constructive, as it is just transactional
(M6).
With Wholesalers we have the difficulty of the portfolio, it is a transactional
model. They just buy what is good for them. As we have known brands, it helps
to have a higher volume of sales with wholesalers (M4).
Because of those characteristics almost all the companies analyzed which worked with
wholesalers have the strategy of reducing their importance.
Wholesaler is a market supplier and not a demand creator, so I needed to create a
channel called distributor, an exclusive distributor that will just work with our
brands in the categories we compete (M1).
There were much more wholesalers before. Now we have reduced them, because
it is not worthwhile. Now we work more just with distributors (M1).
We are seeing a major migration in the marketing channels, from people with a
wholesaler vision to people who operate as distributors. In the Northeast, for
instance, we have many clients that are distributors who were wholesalers before
(M7).
A wholesaler just wants to purchase at the last minute and bargains a lot as
regards price (M10).
142
Despite that, wholesalers are very important to reach BoP markets. Because of the large
size of the Brazilian market, wholesalers are an excellent alternative for some regions and some
products.
The strength of wholesalers is more in the outskirts of the city (where BoP
population is the large majority) (D2).
Wholesalers are an extremely necessary channel in a country like Brazil. With
its capillarity, it is almost impossible to live just with distributors. You are not
going to reach all the traditional markets, only wholesalers can do it, because
they sell a larger portfolio (M6).
Wholesalers are more important in the Northeast because the access is more
difficult (M10).
There is also, in some places, the figure of the mini-wholesaler, which is a small
wholesaler that sells in distant or unsafe regions. These mini-wholesalers are a clear example of
lengthening the channel in a market in development as it was proposed by Jaffe and Yi (2007).
I sell also through mini-wholesalers in regions with safety concerns (SM2).
It seems that wholesalers have a great pulverization but don’t establish partnerships.
Therefore it could be an important channel for BoP due to its capillarity, but manufacturers prefer
distributors that create a strong link with them and with small retailers. For products with higher
awareness and high turnover, this channel is considered more appropriate. In other words, for pull
strategies wholesalers can be an important marketing channel because consumers demand the
product and then small retailers look for wholesalers that practice the best price.
The store needs this product. There is a high awareness owing to the intensive
media that pulled the distribution of this product. I don’t need anyone taking the
product to the small retailer, because he buys directly from the Cash & Carry
which is miles away (M1).
As we have known brands, it is easier to have higher volume of sales through
wholesalers (M4).
143
5.3.4.2 Cash and Carry
As analyzed in Chapter 4, Cash and Carry is the format that is growing the most among
grocery stores in Brazil. All the three leading retailers in the country have important Cash &
Carry operations: Walmart with Maxxi and Sam’s Club, Carrefour with Atacadão and Pão de
Açúcar with Assai. Besides, the Dutch company Makro is the leading company within this format
with annual net sales of R$ 5 billion.
According to interviewed executives, cash and carry is a relevant channel to reach BoP
markets in two situations: Firstly, it is a store format that is becoming more adapted to this
population owing to its prices and location.
Cash and Carry is a store format that is not extremely distant; it is easy to access.
We have cash and carry stores very well located. Hence, it is a good
consumption alternative that seeks price discounts. This format is getting sales
from hypermarkets and not from the small retail (S2).
More and more, cash and carry stores are fragmenting packages. Consumers can
buy in a cash and carry just one liter of milk, as in any grocery store (S2).
Carrefour bought Atacadão for a great reason: Expansion model to reach BoP
consumer (M1).
Cash and Carry understands very well BoP consumers (M1).
Secondly, this channel is relevant for the small retailer for many reasons:
(a) Assortment: The retailer can find in the same place a great number of products;
From what we know, approximately 60% to 70% of Cash and Carry sales go to
small retailers and small food service dealers, as people who sell hotdogs in
streets or pizza for delivery (S2).
(b) Credit: Payment can be done, most of the times, in 40 days; which is a great credit
benefit and many times higher than any wholesaler.
(c) Delivery: Retailers can take the merchandise with them and don’t have to wait for the
delivery of the wholesaler / distributor.
Small retailers purchase in Cash & Carry. He pays more, but has the
merchandise in the moment (D2).
144
(d) Fractioning: Small retailers can purchase just one unit of a product.
(e) Informality: Cash and Carry is a great channel for informal companies to buy their
merchandise. Informal retailers can supply their products without any fiscal problem.
This might be more relevant with the new initiative of the Government discussed
before referring to the Electronic Invoice.
Cash and Carry has this role (of selling to the informal retailer). The industry
doesn’t reach those retailers, but they go to the cash and carry. They buy as if
they were consumer and resell the products (M10).
Who buys in the Cash and Carry format? The informal retailer that is not able to
buy even from wholesalers (M1).
The great trend is the cash and carry. One of the advantages is that with the
electronic invoice, it is more difficult for the small retailer to buy directly from
the manufacturer. This small retailer doesn’t even have an email (SM2).
5.3.4.3 Distributors
According to interviewed executives, distributors play a key role in reaching BoP
markets. Except for the companies that sell directly to consumers, all the interviewed large
companies use distributors to go to the market. But, even those companies that sell directly to
retailers, use distributors in dangerous regions.
If I want to launch a new brand, I can’t sell through wholesalers because they
don’t have time to develop a brand that doesn’t yet exist. Wholesalers want to
get to the store and sell exactly what the retailer asks for. He is a market supplier
and not a demand developer. Hence, I needed to develop a new channel, which
is the distributor. An exclusive distributor who is going to operate just with our
brands in the categories we compete (M1).
I deliver even R$ 10. If the retailer asks, I deliver. I have to attend all possible
clients. This is the most important request from manufacturers that I have (D6).
There are areas of high risk that we use sub-distributors (M5).
All the functions of the intermediaries discussed in the literature review, were mentioned
by the people interviewed and these functions were extremely valorized: Market coverage, sales
contact, storage, sales processing system, market information collection, client support,
assortment, fragmentation, credit and consultancy. As wholesalers have a transactional bias, they
145
don’t practice all these functions, whereas distributors are seen as an extension of the
manufacturer and give a better support to the retailers.
I am used to selling my product for R$ 1.00 and my client (small retailer) is used
to paying that. But one day he is buying things in Atacadão and he sees my
product selling for fifty cents; he is going to buy there. However, I say to him
‘OK, but if you don’t sell everything the problem is yours’. There is the good
side, but also the bad side. We give exchange guarantee. If he buys in the Cash
and Carry, the problem is his (D3).
If you don’t fragment the products, you don’t sell to the small retailer (D3).
Even though distributors have a higher price (than wholesalers); if the difference
is small (2% to 3%), owing to the service they offer, they are going to make the
sale (M1).
If the validity of the product expires, the distributor exchanges it (M3).
Some of our distributors have specialized consultants that offer category
management projects (M6).
Distributors are considered as an extension of our business (M8).
Distributors purchase our entire portfolio. They offer a better service, because
they have a focus in our business. They are an extension of the industry (M10).
According to one executive manufacturer, differentiated distributors have a strong
leadership, since personhood is quite important. Those distributors that have a participative
owner are differentiated.
Why not take someone from the industry to the distributor and say like that: ‘he
takes the same culture from the industry to the distributor’. But it is not like that.
The rhythm is different. The guy has to treat people from a lower level and that
have to be treated a little better […] The great difference between the good and
the bad distributor has to do with people; in the willingness of people (M8).
Differently from wholesalers, distributors help manufacturers in a push strategy, since
they take the products to a large number of small retailers and aren’t just concerned with the
selling in but also with the selling out of the products. As stated by some executives:
Distributors are more relevant in products that the brand needs to be developed
or products that the manufacturer needs a great execution in the point of sale
(D1).
146
Wholesalers just want to sell the best products. Distributors have to have a larger
portfolio (D6).
I need dedicated people for my brands, selling my products. I can’t let the store
buy whatever it wants (M1).
However, some interviewed executives believe that distributors need to be more
professionalized and manufacturers should develop them in a closer partnership.
We have around 200 distributors. Many times, they have a low level of
professionalization (M3).
God gave me the blessing to raise this business, with a lot of intuition. I took few
courses. It is more the day-to-day experience that taught me things (D3).
There are all kinds of distributors. There are those more developed, more
professionalized and those less developed and professionalized. There is no
homogeneity (M6).
Distributors can be divided into three categories:
•
Completely exclusive: just sell products of one company “Distributors just sell our
brand because we have a strict pattern of point of sale execution” (M3). There are
just a few companies that have exclusive distributors and the reasons are twofold:
it is difficult to have sufficient scale so as to be interesting for the distributor to
work with just one company and both, distributors and manufacturers, in general,
don’t like to have a great level of dependency.
•
Exclusive in the category: Distributors that don’t sell competitors brands, but
operate with different companies. “If we see that the dependence of the distributor
with us is growing, we help him to work with other companies that have a similar
work and could be a good complement for the distributor” (M6).
•
Exclusive of one Category: Sell just one category, but from different competitors.
One good example is Personal Care and the distributors known as DECs (Category
Specialized Distributor). These distributors operate with Procter & Gamble and
Unilever. This kind of distributor will be further analyzed in section 5.8.
147
5.3.5
Conclusions of Marketing Channels
According to the opinions of the interviewed executives described above, marketing
channels may be divided into three categories:
Differentiated Channels: These channels have a high pulverization, are close to BoP
markets and understand low income consumers. Usually there is a high involvement from
manufacturers and a higher degree of relationship in the marketing channel. The best examples of
differentiated channels are door-to-door operations, sales directly to small retailers and sales
through distributors.
Independent Channels: These channels have a high level of pulverization, but don’t
create a strong partnership with manufacturers. Therefore, they are more appropriated for a pull
strategy. The advantage of these channels is that they have the highest reach factor. On the other
hand, these channels don’t give support to small retailers with the intensity they should. The best
example are wholesalers and on a lower level, cash and carry format.
Channels not oriented for BoP: Channels with a low pulverization and not appropriate
for BoP, because they are not well located for this population and do not have a proper value
proposition for this market. Hypermarkets are the best example of this category.
The figure below presents an illustrative view of the three categories explained.
148
Differentiated Channels
Producer
Level Two
Level Three (a)
Level Four
(a)
Producer
Producer
Small Retail
Distributor
Producer
Level Three (b)
Considered very appropriate, but
costly and complex
Consumer
Considered very appropriate, but
costly and complex
Consumer
Small Retail
Medium Retail
Consumer
Consumer
Considered very appropriate, and
gaining share
Depending on the retailer it can
be appropriate
Independent Channels
Level Four
(b)
Producer
Wholesaler
Small Retail
Consumer
Considered appropriate, but the
lack of partnership reduces its
relevance
Level Four
(c)
Producer
Cash Carry
Small Retail
Consumer
Considered appropriate, and
gaining share
Level Five
Produ
cer
Whole
saler
SubWholesaler
Small
Retail
Consu
mer
Channels not oriented for BoP
Level Three (c)
Producer
Large Retail
Consumer
Considered appropriate, for
scattered and/or unsafe places
Not considered appropriate, with
the excpetion of the new formats
(Dia%, todo Dia and Comprebem)
Figure 5-3: Channel structure for BoP markets.
Source: Elaborated by the author.
Another important finding concerning marketing channels is related to the discussion of
channel length depending on market development. As seen in the knowledge review, according to
Jaffe and Yi (2007), in the process of a market development, one can see at first a lengthening of
marketing channels, since more intermediaries enter the distribution system and afterwards,
owing to higher levels of efficiencies and even vertical integration, there is a shortening of
marketing channels.
In Brazil, both behaviors could be noticed. In some scattered and difficult to reach places,
some companies use sub-distributors in order to sell to small retailers, in a clear demonstration of
channel lengthening. In more mature regions, some manufacturers declare that they are willing to
diminish the number of partners, to work with less distributors and eliminate wholesalers in a
strategy of diminishing channel length. When there is a channel length, there is a higher tendency
of the end-price for the consumer to be higher, suggesting again that inefficient markets create
the poverty penalty.
149
The Northeast region has the characteristic to be served by local wholesalers.
We sell to the main cities in the states and those mini wholesalers take the
product to the countryside. They sell to very small stores, with high credit risk
and fractionated delivery. The cost would be very high for us. Those companies
are able to put a margin over the price; because no one reaches the places they
go to (M4).
The store might buy small quantities. The delivery cost is high and the store is
also informal. For those stores we are using sub-distributors (M1).
It is the same for high income neighborhoods (execution in point of sale). But
for high income neighborhoods it is easier, as the retailer is more prepared.
There is not a distributor as an intermediary (M3).
5.4
Relationship
This section describes the relationship in marketing channels, which was one of the most
important elements that appeared in all the interviews. The category “Relationship” in this study
was based on the sub-categories: “Partnership” and “Relationship”.
As relationship is a complex variable, - and to be more didactic - the description of this
category will be based on the constructs presented in the knowledge review. The constructs are:
power usage, time of operation, shared values, idiosyncratic investments, supplier competence,
trust and commitment.
5.4.1
Power Usage
Undoubtedly, manufacturers play an important role in the channel structure and compared
to the majority of retailers, wholesalers and distributors they have more power. This power is
more balanced with large retailers, where it can be perceived as a codependence.
With their power, manufacturers lead the channel management. They, most of the times,
define the partners, what is going to be sold, where and how. Manufacturers train their
distributors and look for partners which are dependent on them. Indeed, distributors are their
extension to reach the market.
Interviewer: In your opinion, who in the marketing channel has more power?
Executive: The manufacturers. No doubt about it; they control the channel. If
you think about control, distributors would be the channel node with less power.
150
In recent years, retailers have associated themselves to gain strength and develop
purchasing grocers’ alliances, but in my opinion they are losing focus (S2).
Interviewer: Do you control the marketing channel?
Executive: Of Course. We have a relevant brand, good commercial policies. We
have a margin that allows working the package architecture [different packages
for different channels] (M5).
Furthermore, manufacturers want to partner with distributors in which they will be
relevant.
If I am not important to the distributor, being the supplier that brings knowledge,
products and makes him earn money, the distributor will sell other brands that
are not mine (M8).
Manufacturers’ power which can be translated in channel control is very important in a
market that is developing and still needs professionalization and direction, as is the case of BoP
markets.
Therefore, some companies found out that it was very important to develop their
marketing channels using their power and knowledge. These manufacturers used the reward
power to develop close partnerships and consequently achieve their objective of reaching BoP
markets in an effective way, which means, selling to a large number of point of sales and helping
those point of sales to sell more.
So, even though we sold the product with a low price, it was difficult to maintain
such an accessible price in the point of sale. Because of that, we wanted to
control the channel (M3).
It was also observed that distributors are an important node in this control. They are the
link between manufacturers and small retailers and therefore must be aligned with the
manufacturers.
Interviewer: Owing to your strength, do you believe that you control the
marketing channel?
Executive: No, we control the distributor very well. And the reason for that is
because he [distributor] has a business model in which he ‘buys’ the cause. Even
151
though he is not economically dependent, he ‘buys’ the cause […] When you go
to a wholesaler or a cash & carry, the issue of control gets very distant (M3).
As it was discussed in the literature review, power is an important antecedent of
commitment. When the member in the marketing channel uses the reward power there is a
greater propensity of commitment in the relationship. However, when it is used a coercive power,
there is a higher chance of creating a conflicting relationship. The two statements below from the
same distributor present these ideas.
He (supplier) has a good relationship with us, because we helped the company to
build its brand in São Paulo (D5).
Those brands with more market awareness and that are well accepted in the
market, are very good to sell. The volume comes easier. But there is also the
other side of the coin: The sales targets are much higher […] it generates more
conflicts because it’s more complex (D5).
However, there is a limit in this dependence and power level. There is an ownership
feeling among small distributors and even small retailers that inhibit some collaboration level.
This creates a difficulty for a higher level of professionalization, because distributors and small
retail owners understand that no one should interfere in their business and they continue to
manage it with few changes and/or innovations.
We make large investments in training, not only of the owner, but also of the
importance of having all the team trained. We give them a training kit. There are
businessmen that make the most of this opportunity and become more
professionalized. But it is their company. We offer packages, tools for them to
work better. Some get with m ore strength, others with less (M6).
Moreover, the relationship with wholesalers is more transactional and there is not this
strong perception of manufacturers’ power, once wholesalers can buy on one day from one brand
and on the other from its competitor.
With the wholesaler, we have the difficulty of portfolio. It is a transactional
model, in which he buys what is good for him and not necessarily for me (M4).
152
Summing up, large manufacturers have a greater power over distributors and use it to
create a closer relationship and develop them. On the other hand, large manufacturers have less
power over wholesalers and usually use coercive power since it is a more transactional operation.
Concerning large retailers, there is a more balanced power and negotiations are tougher.
Regarding small manufacturers, the use of power couldn’t be noted.
Once a channel member (for instance, distributors) is less developed, he has a higher
propensity to have a lower level of power and to have/accept a higher interference from the other
channel member (for instance, manufacturers).
The table below identifies the degree of power perceived in the relationships analyzed.
The more the number of “stars”, the more intense is the degree of power that was noticed. This is
a qualitative analysis based on the potential ability to control the decision variables in the
marketing strategy of another member in a given channel at a different level of distribution (ELANSARY; STERN, 1972).
Table 5.2: Importance of Power Usage in the relationship
Relationship Large Manufacturers – Distributors
Relationship Large Manufacturers – Wholesalers
Relationship Large Manufacturers – Large Retailers
Relationship Large Manufacturers – Small Retailers
Relationship Distributors – Small Retailers
Relationship Small Manufacturers – Small retailers
Power
Usage
*****
*
**
***
***
*
Source: Elaborated by the author
5.4.2
Time of operation
Time of operation appeared in many occasions, indicating that for BoP it is an important
variable. That might be explained by the perception of small retailers and even from BoP
population that they are many times exploited by companies. In these cases, time is an important
indicative that shows reliability of a partner. As discussed in the knowledge review, despite not
being in the Morgan and Hunt (1994) model, time of operation is an important antecedent of trust
in other models (ANDERSON; WEITZ, 1989; GOODMAN; DION, 2001).
153
As already discussed, long term relationships can turn into trusty relationships. For a
population (small retailers) which is suspicious, time is a very important facet to build trust. The
next comment helps to understand this concept:
Relationship is a consequence of continuity. When you practice a model with
frequency, those products that we sell, the client waits. (Small) Retail starts to
believe. Believing, he waits and, by waiting, he trusts. Then you have a virtuous
circle (D1).
Time of operation was described by interviewed executives as an important antecedent of
trust, and it allowed the creation of a competitive advantage for small manufacturers, due to:
a) A strong relationship with clients.
I work in the region for 30 years. So I know the father and the mother of the
client. I am even invited to baptismal ceremonies. If there is any problem, the
client phones me (sales director) directly (SM2).
b) A strong relationship with consumers, that creates brand loyalty and the perception that
the product is of good quality.
We have a good market share in the region owing also to time of operation. We
have been here for many years. For more than 20 years (SM4).
c) A good distribution network, since it allows small manufacturers to know in detail the
region and all its clients.
We have the knowledge of the region. I have been delivering merchandise ever
since the 1980s (SM1).
From the above analysis, it becomes clear that time of operation is important in the
relationship with small retailers. They appreciate this long term relationship and it is perceived as
an important antecedent of trust. However, although some manufacturers have a long term
partnership with several distributors, time of operation didn’t appear so strongly in the dyad
manufacturer-distributor.
154
Applying the same logic used in the power analysis, the table below shows the degree of
importance of time of operation in the relationship dyads.
Table 5.3: Importance of Time of Operation in the relationship
Relationship Large Manufacturers – Distributors
Relationship Large Manufacturers – Wholesalers
Relationship Large Manufacturers – Large Retailers
Relationship Large Manufacturers – Small Retailers
Relationship Distributors – Small Retailers
Relationship Small Manufacturers – Small retailers
Time of
Operation
***
*
**
****
*****
*****
Source: Elaborated by the author
5.4.3
Shared Values
A manufacturer-distributor relationship is based on exclusivity and it is easy to perceive
the strength of shared values among partners. Usually distributors are seen as an extension of
manufacturers and therefore should have some shared values for a long term partnership.
Distributors have a business model in which they ‘buy’ the cause. Even though
he is not economically dependent, he buys the cause. Distributors think: ‘If I do
everything they (manufacturers) are saying I will have a higher profitability’, so
he even insists on doing everything, so it will be more interesting for him (M6).
Even though there is a relationship based on exclusivity between distributors and
manufacturers, there is no clear dependence, since most distributors work with different brands in
different categories. Shared values might create a win-win situation and therefore establish a
trusty and long term relationship.
It becomes clear that those shared values are very important to diminish a perception of
power imbalance. As discussed before, when a power imbalance exists, the member with higher
power tends to take advantage of it and exploit the low power channel member, creating a lower
propensity for collaboration (ANDERSON; WEITZ, 1989).
The objective of many manufacturers is for distributors to think like them, so they are
more than just an extended arm of the supplier. Distributors are seen as an extension of the
manufacturer. With this kind of relationship, it becomes difficult to differentiate who works for
155
the distributor and who works for the manufacturer. In these cases, it even gets hard even for
retailers to identify the differences between both.
This is a success criterion: you can’t identify who is from our company and who
is from the distributor. The language is the same, the analyses are the same, and
the intelligence is the same (M1).
Nevertheless, so as to have this identification, it is important that both parties understand
the objectives, needs and realities of the other one. Because of that, a transparent relationship is
an important dimension to create shared values.
[A good supplier] understands the role of the distributor; what he can execute.
He valorizes that and has adequate commercial policies for the distributor (D1).
On the other hand, relationship between large manufacturers and retailers are still distant.
In this case, it is hard to find examples of shared values between them. As in the problem of the
chicken and the egg, lack of trust is a barrier to sharing values as much as the fact of not having
shared values inhibits the possibilities of trust between partners.
[…] because when you offer a package of ‘things’, he [small retailer] says: ‘This
is my store’ and he hinders us (M6).
An exception might be the relationship between small manufacturers and small retailers.
Many times, both have grown together and help each other in their survival. One depends on the
other. Small manufacturers are an important supplier of small retailers and small retailers are the
most important clients of small manufacturers.
Many times the client waits. Waits even for the time we are going to visit him.
Large retailers want everything on time. If a product is missing, he puts another
one in its place. He does not wait. Relationship is based on volume and
profitability. In a small retailer of the outskirts, relationship is friendlier and
because of that this small retailer tends to be more loyal (SM2).
In table below, the degree of importance of shared values in relationships is analyzed.
156
Table 5.4: Importance of Shared Values in the relationship
Relationship Large Manufacturers – Distributors
Relationship Large Manufacturers – Wholesalers
Relationship Large Manufacturers – Large Retailers
Relationship Large Manufacturers – Small Retailers
Relationship Distributors – Small Retailers
Relationship Small Manufacturers – Small retailers
Shared
Values
*****
*
**
**
**
****
Source: Elaborated by the author
5.4.4
Idiosyncratic investments
Many manufacturers invest a lot in developing distributors in order to professionalize
them and also as a way to demonstrate that they rely on the partnership and consequently they are
committed with the relationship. Besides, with those investments, manufacturers get more
relevant for distributors.
Distributor is treated as an extension of our business. We are concerned with
training, product orientation, and point of sale execution. We train salespeople
from distributors and create incentive campaigns, because you have to be
relevant for the distributor. If I am not the most important supplier, offering
knowledge, product and profitability, he will sell more from other manufacturers
that he has in his portfolio (M8).
Training and development of distributors take time and a lot of investments and because
of that, it is harder for a manufacturer to change distributors every time.
We have no interest in terminating the contract with the distributor, because
training another one is more difficult. We have invested a lot (M3).
We make a huge investment in training. Not only of the owner, but about the
importance of having the team trained. We talk about the best way to train and
pay salespersons (M6).
Interviewer: And for you, isn’t there a problem to be concentrated [in few
distributors]?
Executive: No. As long as he is professional, no. There were two lines of
thought: the first one that said ‘I don’t want anyone very large, because I want to
control’. However, after some time, it is necessary to make some investments in
operation; technology; people training and then we started to partner with only a
few companies” (M5).
157
Although the idiosyncratic investments are higher in the relationship between large
manufacturers and distributors, it is possible to perceive these investments also in other levels of
the marketing channel. For instance, large manufacturers make relevant investments in large
retailers when they negotiate their contracts.
Profitability of large retailers is the lowest, because of the annual contracts, the
investments and promotions that are very expensive (S1).
Manufacturers and distributors that have more intense work with small retailers also make
some idiosyncratic investments in this channel. These investments may be in financial support to
renovate a store or in an incentive campaign with the channel.
We have a loyalty program in São Paulo that encompasses 30 thousand points of
sales. This incentive program gives points and pays those retailers that execute
the strategy closer to what we define (M5).
Table 5.5: Importance of Idiosyncratic Investments in the relationship
Relationship Large Manufacturers – Distributors
Relationship Large Manufacturers – Wholesalers
Relationship Large Manufacturers – Large Retailers
Relationship Large Manufacturers – Small Retailers
Relationship Distributors – Small Retailers
Relationship Small Manufacturers – Small retailers
Idiosyncratic
Investments
*****
*
***
***
***
*
Source: Elaborated by the author
5.4.5
Supplier Competence
Due to their size, power and knowledge, manufacturers are considered as the partner with
more competence in many activities, such as product knowledge, sales techniques, point of sale
execution and systems.
Sometimes, manufacturers have some employees working exclusively for the distributors
as they have more competence in some activities. It also allows distributors to focus on their core
business: selling to retailers.
158
Depending on the size of the distributor, I might have two professionals working
there: one internally and another externally. The first one manages and sells to
the distributor, establishes the price table, takes care if there is a contest for
salespeople and other things, while the second one is in the streets, training
salespeople. Usually we help them to hire salespeople also (M1).
Owing to their category management knowledge, large manufacturers are also considered
to have the competence in point of sale execution. For suppliers that is so important that they
train and control distributors’ operations in point of sales.
I have a total excellence pattern: how the check-out must be, how the store has
to be, how the display and products must be exposed. We are going to execute
all that and require from him [distributor] (M1).
Cadbury Adams did something very interesting with their and distributor’s sales
force […], an employee of Cadbury is always with his distributor doing an
advisory job of product exposition (S2).
This competence is valorized by the distributor and has two important consequences. On
the one hand, it strengthens the relationship between manufacturers and distributors and on the
other hand, it allows that distributors to also transfer this knowledge to the point of sale and also
strengthens their relationship with small retailers.
We learnt a lot of management category with Company X. What we have learnt
we transfer to our clients. We make the retailer understand his store, how to
expose the products (D1).
When the industry transfers knowledge to the distributor, he is going to talk to
us. So there is a global communication (R1).
This same competence of helping retailers to buy and expose better can be observed in the
relationship between large manufacturers and small retailers. The only difference is that it is
harder for large manufacturers to do it efficiently with a large number of retailers, scattered all
over the country.
The idea is that training is adjusted according to the channel. I offer a kind of
training to a small point of sale. Those small points of sale that don’t have
potential to develop, I offer a different portfolio (Manufacturer that sells directly
to small retail).
159
The employee from Coca Cola came and brought a picture of how to display the
products in the refrigerator. So we are going to practice this layout (R2).
Moreover, valorized manufacturers are those that have good sales to the consumers. In
that sense, companies with an effective strategy towards BoP are considered to have more
competence. For instance, small manufacturers can also be identified as having important
competences, such as product quality, branding and/or good price-performance.
Always sell my product, because the consumer is more loyal, because of the
color of the beans. My beans are always whiter than my competitors (SM4).
Another important supplier competence is consistency. It is not only important to access a
BoP market. Small retailers demand consistency, which means receiving products and visits from
sales people on a regular basis. Small manufacturers and some distributors analyzed are able to
visit weekly almost all their clients. This gives the consistency necessary to create a trusty
relationship as well as it helps small retailers to manage their cash flow.
Regularity and frequent visits are important for high and low income markets. However,
small retailers in BoP regions have a feeling of abandonment, that no one visits them.
Furthermore, as they mix the cash flow of their businesses with their personal budget, regularity
is important to help them to plan and use properly their expenses. If there is not a good visit
frequency, money will be used for personal needs instead of purchasing merchandise for the
store.
Interviewer: How many times do you visit a small store, which is far away?
Executive: Once a week. There are stores that we visit once a week and those
that we visit twice.
Interviewer: Even the very small store?
Executive: Those that are very small, we visit fortnightly. But usually it is
weekly (D3).
However, this consistency is not only required from small manufacturers or distributors.
Large manufacturers that have consistent commercial policies are also valorized.
160
That manufacturer had consistent commercial policies. The sales director had
worked in the company for 30 years. The clients on the other side like it. They
also valorize consistency on the industrial side (S1).
It is this kind of consistency. It is to be firm in the decisions. It is commercial
decisions that are respected because they are respected by the company. Many
times, the company creates commercial conditions which are disrespected. So,
on the other side, the distributor realizes that there is a way out. One of the main
competences is consistency [of commercial policies] (S1).
The informality of many local stores creates a different kind of relationship in the
marketing channel. Besides demanding a different sales professional profile, it requires some
flexibility from the seller.
This flexibility may be understood in many dimensions, such as on credit, delivery and
sales to informal retailers. As discussed before, flexibility is one of the elements of competitive
advantage of small manufacturers.
The following excerpts explain more the dimensions of flexibility
Interviewer: What is a fast delivery? If a retailer asks merchandise for you today,
when do you deliver?
Executive: Maximum until tomorrow.
Interviewer: Can it be even on the same day?
Executive: Yes (SM3).
Interviewer: Do you also receive checks from third parties?
Executive: When the quantities of merchandise are small, clients pay in cash
(SM1).
One of the trends is the growth of the Cash & Carry model, because with the
electronic invoice it is very difficult for a manufacturer to sell directly to the
small retailer. Mainly because many of these retailers don’t even have an email
(SM2).
On the other hand, large manufacturers have difficulty to access this small informal retailer.
To reach these people is the great secret. I am not talking about the consumer,
but retailers. Retailers that serve these consumers, he doesn’t want formality in
this kind of business. There is no open (formal) company (M10).
161
Table 5.6: Importance of Supplier Competence in the relationship
Supplier
Competence
*****
*
***
***
****
****
Relationship Large Manufacturers – Distributors
Relationship Large Manufacturers – Wholesalers
Relationship Large Manufacturers – Large Retailers
Relationship Large Manufacturers – Small Retailers
Relationship Distributors – Small Retailers
Relationship Small Manufacturers – Small retailers
Source: Elaborated by the author
The table below presents a summary of all the concepts discussed above and their
importance on the dyads of the marketing channel.
Table 5.7: Importance of the antecedents of trust and commitment in the relationship
Relationship Large Manufacturers
– Distributors
Relationship Large Manufacturers
– Wholesalers
Relationship Large Manufacturers
– Large Retailers
Relationship Large Manufacturers
– Small Retailers
Relationship Distributors – Small
Retailers
Relationship Small Manufacturers
– Small retailers
Power
Usage
****
Time of
Operation
***
Shared
Values
*****
Idiosyncratic
Investments
*****
Supplier
Competence
*****
*
*
*
*
*
**
**
**
***
***
**
****
**
***
***
***
*****
**
***
****
*
*****
****
*
****
Source: Elaborated by the author
5.4.6
Trust
In the channel structure, trust is a central element and could be observed many times in
the interviews. For instance, in a commodity market if there is a trend to lower prices, the
manufacturer in a trustworthy relationship may warn its clients.
When you perceive that there is a trend of declining prices, you warn your client.
You don’t let him buy a lot; otherwise there will be a problem (SM4).
Small retailers are not used to receiving attention. They usually feel that they have to do
everything by themselves, without any help. Usually in BoP market it is a low income person that
opened a small retail which might have grown and established itself in the neighborhood. So the
162
profile of these owners is of people with low formal education, that disbelief any initiative from
manufacturers, because they think they will be exploited.
[Small retailers] are diminished even in the name: they are small. So everything
that goes to them is small. The only thing that goes in a big way is the price
(D3).
Only when he came and gave me attention, did I put him in first place. He
became my personal friend, because of the attention he gave me. He visits me
twice a week. Sometimes he comes Saturdays or Sundays. He is crazy, but he
comes (R1).
To reverse this situation of mistrust and disbelief, persistence, continuity and frequency
appears as important variables. The regularity creates trust and trust creates loyalty. The next
statement of a distributor, which was already analyzed, is copied again due to its relevance to
clarify this idea.
Relationship is a consequence of continuity. When you practice a model with
frequency, those products that we sell, the client waits. (Small) Retail starts to
believe. Believing, he waits and, by waiting, he trusts. Then you have a virtuous
circle (D1).
Our employee stays sometimes inside the store, fixes our products in the store
and comes back every week, until the store owner enters the scheme. It is
laborious, but it works… it works a lot (D2).
Every fortnight I am there. The client knows me. That creates trust (D6).
We have the tradition of maintaining always the quality of the products, always
serving the client on the right day; at the right time […] we are always
maintaining the regularity of our visits (SM4).
Another good example of the importance of regularity and time to create a strong
relationship could be seen in a field observation where a salesperson from a wholesaler was
trying to sell some products for a client he was visiting for the first time. He could sell one kind
of product, but when he tried to offer other products, the retailer said “hey wait. You can’t just
arrive here and sell everything…” and not satisfied he continued “I want the telephone of the
supervisor and of the manager. Otherwise you disappear and how are we going to be?”.
When there is this regularity and frequency, retailers trust distributors and are loyal.
163
Competition is strong. A small retailer is more loyal, because the traditional
wholesaler doesn’t have structure and doesn’t reach them and Cash & Carry is
very distant and a retailer has difficulty to get there, because he doesn’t have a
car (D1).
When you start to serve a new client, he does not trust you to begin with. But
when you serve him well with punctuality, and you don’t make any mistakes, or
if you have any problems you open up to him ‘I am with some issues, I will not
be able to serve you’; from that moment on, you have complete freedom (D3).
On the other hand, if, for any reason, the distributor misleads the retailer or doesn’t serve
him properly, the problem will be seen as a personal one and the distributor will not have a
second chance. He will be marked for ever.
[Small retailer talking about a salesperson from one distributor]: “if it depends
on me, he doesn’t sell here anymore. Because he knew I was alone, I was with
difficulties, there was a promotion offered by him in the tabloid, and he didn’t
give me support. This point has already marked him. It is the kind of person that
is rejected (R1).
The relationship between manufacturer and distributor is also based on trust. There is a
mutual dependence and trust is one of the main pillars. On the other hand, relationship with
wholesalers is just transactional, since there is not any exclusivity. As explained before,
wholesalers give capillarity whereas distributors make a good job in the point of sale.
Danone is trust. This is fundamental. It is 18 years and we are monitored
everyday. There is always an inspection on the street, here in the office. Every
two months people from SENAI (Industrial Learning National Service) come
here to make an inspection (Danone Distributor).
As seen in the above statement, there is trust, but it is a “controlled trust”. Manufacturers
are always trying to develop their distributors, but with two eyes in their operation.
We work to develop our distributors. It is a hard work to instruct people and
improve everything. There is an area where the internal inspector goes, so we
look at the work that those distributors are making in the point of sale (...) We
demand a good execution from the distributor. He has to be in the point of sale
according to our execution pattern (M3).
164
Depending upon the size of the distributor I might have two people working
there: one internal and one external. The first one manages the operation, selling
to the distributor, analyzing how much the distributor will buy from us,
establishing the price list, if there will be a contest among salespeople, while the
second person will help externally, training the sales team. Usually, we even
help to hire their sales team (M1).
Moreover, sales structure has an important role in defining trust in the relationship. The
literature review presented the difference between trust developed based on FLE (Frontline
Employees) and MPP (Management Policies and Practices). In the first case, the contact person
(usually salesperson) creates the relationship and people trust him. In the second case, people
trust on the practices of the company independently of the sales contact.
Both are important in the relationship between distributor and retailer. However the first
one (FLE) seems more relevant.
What is relationship? Who serves you better? It might be weird, but what comes
first is the friendship with the salesperson. Second is delivery. In some cases we
can see delivery as punctuality and in other cases as products in good conditions,
the delivery person that leaves the product at his door and goes away. And in
third place are financial conditions (M5).
I believe that the salesperson’s relationship is extremely important. He is the one
who creates a bond with you. He brings promotions it is he that gives support to
you. We learnt a lot with other supermarket owners, in which people said ‘it
works everywhere but not in my store, because the salesperson is not good’
Today the strongest link is with the salesperson (R1).
If the salesperson changes the brand he works with, small retailers will continue
with him (SM2).
However, everything is not so easy and unidirectional. In other words, even with the trust
established, there is not necessarily a blind and unconstitutional loyalty. Sometimes, if there is a
good opportunity, some retailers buy products on promotion from other wholesalers, even though
they will not have any support.
[Distributor to a small retailer buying in a Cash & Carry] OK. You can buy
there, but if there is a surplus and you want to replace, you go to the Cash &
Carry also. There is the good side, but also the bad side. We sell with
replacement guarantee, the client doesn’t lose. If you buy from the Cash & Carry
it is your problem (D3).
165
5.4.7
Commitment
Commitment is strongly related to trust. Committed partners are willing to invest in
specific assets to have long term benefits (GUNDLASH et al, 1995). The importance of
commitment in relationship among agents of the channel structure is clear. For instance, to
improve sales, many times incentives and prizes are used by manufacturers to stimulate
wholesalers and distributors.
We teach them how they can have a better use of the product, with point of sale
visibility and correct price32
We have promotions and take merchandising material; we have some meetings
with them. We have made a Junina Party33 with distributors. The regional
manager goes there and thereby causes further motivation (M10).
However, in a transactional model, typical of wholesalers, there is a lack of commitment,
which leads to mistrust.
There is always this thing of demanding a little bit more of commitment (with
wholesalers). And commitment would be more transparent if commercial
policies were not just the policies of the end of the month (when companies give
discounts) (S2).
5.5
BoP environmental characteristics
In a first and superficial analysis it might be understood that there are few differences
between distributing products for BoP markets and high income populations. This can be
extracted from the answers of the interviewed executives that declared:
1.
To distribute for BoP, companies use the same channels, in other words, to reach
BoP, manufacturers sell through wholesalers, distributors and retailers. The only difference is that
there is a predominance of small retailers in this market and that was confirmed in secondary data
analysis from the Latin Panel. As stated by one interviewed person:
32
Roberta Sant´Anna: Marketing Director of Unilever in an interview to the newspaper “O Estado de São Paulo”.
Saturday. August 1st 2009. O Estado de São Paulo. Pg. B13.
33
Festa Junina: Traditional party of Brazilian culture.
166
We don’t have a distribution model for low income consumers. We have a
model to distribute to small stores (M1).
2.
Price is still seen as a critical success factor, and to be price competitive is a must.
Low income is low income. It is low out of pocket (M4).
3.
Another aspect that comes to light is that to serve low income consumers properly,
companies try to offer the right product portfolio. The products have to be adapted to
consumers’ needs and affordable for their budget restrictions.
I have the product with the lowest price (M8).
For a point of sale of lower social economic level, we offer a smaller package
(M5).
This first analysis is very similar to the drivers to success discussed by Dawar and
Chattopadhyay (2002). According to them, serving low income consumers is a matter of adapting
companies’ strategies on the marketing mix, i.e., product, place, promotion and price.
However in a deeper look it is possible to extract from the data some relevant insights.
First of all, BoP markets have some environmental characteristics that imply in different
distribution strategies.
1.
Capillarity: Points of sale are fragmented and it is harder, and more costly to
serve them. Sometimes, this capillarity demands different marketing channels and is considered
one of the greatest challenges companies face to reach BoP markets. For instance,
The Northeast has a characteristic of being served by mini-wholesalers. You sell
in the states capitals, and those mini-wholesalers distribute in the small cities,
because no one reaches the places they go (M4).
In large geographic areas, you are not able to have only direct sales (because of
the cost). Then you need a larger channel. You might have a distributor together
with a wholesaler (S1).
In the company, there is not a greater idea than increasing the number of points
of sales we reach; and I can compare that with product launching or acquisition
167
of a new company. This is the most important idea that we have worldwide
(M1).
Our challenge is to have a more capillary distribution (M10).
It can be argued that any large country (for instance, United States) face this problem of
capillarity. However, in an emerging market, it is amplified, because it occurs in conjunction with
next obstacle: institutional voids.
2.
Institutional Voids: One of the main concerns in distribution in Brazil is safety.
Always, when talking with companies about distribution in slums or some poor regions, there
was the concern with safety. One of the distributors interviewed spent more or less 0,6% of his
net sales with safety. This was a recurrent issue.
We live in a country that you have to adapt yourself. Thieves sleep in the
mornings, wake up in the afternoon and they go to work at night. In the most
dangerous places, in order to avoid problems, we always try to go in the
mornings (D3).
In extreme cases of violence in slums, we sell to a distributor that serves those
slums. People who are born in slums and continue to live there and can walk to
such places without being robbed (M5).
The greatest challenges that I have are robbery and delinquency (SM2).
I have a driver who refuses to go to some regions. There are some routes which
are difficult to find drivers (D5).
Another important issue is the distance between cities in Brazil. And it is not only the
distance, but the lack of infrastructure for transportation. This point is very relevant because it
demands distribution efficiency and higher costs.
For instance, the state of Pernambuco has from point to point 800 km. So if I
have a distribution center in Recife (Pernambuco´s capital) and I have to deliver
merchandise to the other extremity; how can it be viable to send a truck? It is
800 km to go; and worse, 800 km to come back empty (M1).
3.
Informality: In Brazil, there are still many points of sales that are informal and it
is more difficult for MNCs or large companies to sell to them. Many times these companies have
to use distributors to reach this small informal retail.
168
They (small manufacturer) are very aggressive in price, but there is an enormous
informality with a high level of fiscal evasion (M7).
For some large manufacturers, mainly MNCs, owing to their policies, even their
distributors can’t sell to informal dealers.
My distributor can’t sell directly to the informal retailer. The store might buy
small quantities, the delivery cost is high and also it is informal. For those stores
we are using sub-distributors (M1).
The informal dealer is not our focus (M1).
We cannot allow the distributor to sell to informal retailers (M3).
As explored before, this same informality is considered by large manufacturers as a great
differential of small companies. The following statements help to describe better the relevance
given by large companies to this issue.
Company X comes from Goias (state in the Central-Western region of Brazil)
and sells here in São Paulo with a better price than us (company is in the state of
São Paulo). I don’t know the magic they do. That is not possible; it doesn’t make
sense (M8).
The practices from an MNC are very different from a local company that wants
to grow at any price, assuming fiscal risks. But he is in the same category as I
am; he is the ‘me too’ (M4).
For C classes, fiscal evasion is a very important issue (M5).
It is difficult to compete with those companies, because they are informal. When
we see their price in the point of sale, the accountability doesn’t close (M3).
4.
Regional Differences: As many other large country, companies in Brazil have to
face huge regional differences. That point is not different from an affluent large country, but it is,
as stated by executives interviewed another challenge to be faced.
So, for each large region, you have a portfolio, a different talk. Sometimes, the
same portfolio, but with a different promotion (M9).
I am going to tell you two states that specifically, have a large incidence of
wholesalers: Minas Gerais and Mato Grosso. In those two states, you don’t have
good distributors (M8).
169
In Rio de Janeiro there is a strong movement from retailers so as not to let
companies to print prices in the package, but in Northeast and São Paulo, we are
being able to do that (M3).
Bahia is an interesting fact: in the segment we operate, the state has a legislation
that protects factories from there (M4).
I am the only national company [in my segment]. So, I have to have a different
regional operation (M7).
5.
Consumer Characteristics: According to interviewed executives, low income
consumers have some peculiar characteristics that have to be considered in the development of
distribution strategies. One of the most important characteristics raised is the relevance of
relationship.
Relationship: Relationship was a central element in all the interviews. According to
interviewed executives, low income consumers tend to create a strong social network, in which
one helps the other. This importance given to relationship has many impacts on business
operations.
For instance, communication that enhances word-of-mouth and prioritizes face to face
contact, such as personal sales and sales promoters have a higher success tendency. Owing to
that, door-to-door channel or even small retailers might have a source of competitive advantage
in the relationship with their consumers. Even though they have a limited budget, low income
consumers sometimes accept to pay higher prices on behalf of the relationship, which brings a
new idea for the reasons BoP pays more for the same product. Besides the market inefficiencies,
poor may pay more due to social networks. That could be confirmed in the next statement
presented below:
Consumers buy door-to-door because of the friendship with salespersons. She
(consumer) knows it is more expensive, but buys with the salesperson because
she trusts the products and the salesperson… in the market it is cheaper, but the
validity is on the limit (D4).
It is not just about pricing. Consumers have the desire to have a good relationship with
people who serve them.
170
[Low Income Consumer] is very demanding… treat us (small retailer) as a
supermarket, or even more demanding than the large retail. Here, daily he has
contact with the owner, he knows his name. Sometimes when he is upset with
something, he doesn’t even want to talk to the manager. On the other hand, in
the large retail there isn’t this contact (R1).
Moreover, relationship is considered basic to create a closer link with the consumer. The
worldwide cases demonstrated also that companies that are more embedded in the communities
with a strong link with the populations achieve good results (SEELOS; MAIR, 2007; YUNUS,
2007). In the interviews, this same aspect appeared, demonstrating again the relevance of
relationship. Next statement shows the experience of one executive that was able to build a strong
relationship with one community.
Some work that I conducted myself in Latin America with the real involvement
of the community and working in pro of the community. The effect exists and
the emotional link created between the community and the brand is in a
dimension never seen before by any brand (M6).
Importance of Dignity: BoP demonstrates a high concern with maintaining their dignity
and not to be treated as dishonest. As they are poor, low income consumers many times feel that
they are being considered as ‘second class citizens’. The camouflaged, but intense, racial and
income prejudices increase this feeling. This can be observed in statements such as “I am poor
but I am clean” or “I am poor but I am honest”; in a clear demonstration that low income people
are always trying to prove that they deserve credit.
Therefore, to build a trust relationship, according to interviewed executives, companies
should understand that low income consumers want to be recognized and when purchasing they
want to be well served. Services that valorize this population might be a source of competitive
advantage.
Importance of Value Proposition: Brazilian BoP consumers are more demanding than
some years ago. With the consumption growth they are getting more used to purchasing a wider
assortment of products. Furthermore, information is more spread out and low income consumers
know their rights better.
171
Last year we made a critical change in our price. We were criticized a lot,
because some competitors were doing crazy things. But the movement continued
normally and our clients continued to buy from us. They said: ‘I will not change
those butchers and their respective meat for anything’. So, our service is not so
bad, it is not so dirty, more or less clean and organized (Small Retailer).
There is a perception among interviewed executives that BoP consumers are demanding
and can’t make mistakes:
Low income consumers are more demanding than high income consumers
because their money is counted and they have to buy a good product at the
moment they have the availability to buy. Furthermore they can’t make mistakes
(M8).
However, that is not only a characteristic of BoP consumers. Small retailers also use the
same logic:
Small retailers can’t make mistakes when they purchase, because they have a
great problem of working capital. It works based on the owner’s logic […] He
thinks: ‘I have to buy a condensed milk. It is expensive but it is better to have
Leite Moça (leader brand)’ (M4).
This doesn’t mean that price is not important. As one small manufacturer points out “In
this neighborhood (low income) to sell the product one has to have a good price” (SM4).
However, even this producer has in its product mix a premium product. “In brand X we have a
higher price because there is always a loyal consumer (that perceives and wants a higher quality
product)” (SM4).
According to interviewed executives, low income consumers also want good quality
products and services. Due exactly to their lack of dignity, low self esteem and high prejudice
against them, BoP consumers don’t want just low quality products or “products made for poor
people”. As a distributor declared “low income neighborhoods also like good things. So, in the
beginning of the month, when they receive their salary, the first things they are going to buy are
leader brands’ products. As the month continues and the money starts to finish they substitute the
leader brands for B-brands”.
As BoP consumers have a limited budget, their income has to be maximized in their
purchases. Consequently, these consumers look for products that yield more. For instance a
172
coffee maker interviewed believes that “in the outskirts, extra strong coffee sells more because it
yields more”.
In this respect, still smaller packages are seen as an important alternative for BoP markets:
“[with the smaller package] we can have a more intensive strength. It is what we call mono
portions. It is a natural trend of the market” (M8).
Furthermore, some products might have another function or even a higher relevance. For
instance, one of the executives interviewed declared that one of the products that Brazil’s largest
wholesaler buys is powdered milk. This happens because in some poor places of the country,
retailers buy 50 kilos of the product and sell it in cups of powdered milk. This cup “might feed 10
people for a week. Spoon by spoon, people use the powdered milk. So this kind of milk turns into
an essential product”.
The table bellow presents a summary of Brazilian environmental characteristics,
mentioned in the interviews that manufacturers have to face in order to develop strategies to BoP.
Indeed those environmental characteristics are not new and were already discussed by many
authors (DAWAR; CHATTOPADHYAY, 2002; PRAHALAD, 2005; KHANA; PALEPU,
2006).
Table 5.8: Environmental characteristics of Brazilian market
Environmental
Characteristics
Capillarity
Institutional Voids
Informality
Regional Differences
Consumer
Characteristics
Description
• Brazil is a vast country with many small cities and small retailers scattered
over the country. Smaller cities have usually a lower income population and
many MNCs and large companies have difficulties to reach those places and
consequently a relevant portion of BoP market.
• Robbery is a problem companies have to face.
• Distance and lack of transportation infrastructure is another concern for large
manufacturers.
• Many small retailers are informal; consequently MNCs and large companies
have difficulties to sell to them.
• Moreover, many small manufacturers are also informal and owing to that have
a cost competitive advantage
• Different regions might have different legislations
• Different regions have different behaviors that demand different marketing
strategies
• Importance of relationship
• Importance of dignity
• Importance of value proposition
Source: Elaborated by the author
173
5.6
Manufacturers’ strategies to reach BoP market in Brazil
5.6.1
Large Manufacturers’ strategies to reach BoP market in Brazil
To build a proper strategy for BoP, interviewed executives believe that, first of all, it is
essential to understand this market.
I think that, more than anything else; the company needs a team that understands
what BoP consumers want (M8).
For me, the most important competence (to reach BoP markets) is to have people
that know or have experience with BoP (M5).
One important point is to understand this consumer. He is not as obvious as it
might appear (M1).
They (benchmarking company) really understand the main issues of BoP (D1).
Interviewer: What defines success for BoP?
Executive: To understand this consumer (M1).
However, this BoP knowledge was only applied more recently by multinationals and large
companies:
The company entered Brazil just looking at ‘la crème de la crème’… now the
company is understanding that we have to go towards that direction (BoP
market) (M1).
The market, in general, starts to look at BoP as a great opportunity (M7).
There was a kind of skepticism (about BoP markets) (M5).
Until five years ago, the priority was to gain market share and C class was not as
relevant as it is nowadays. The company had success in this focus, but the
market has changed (M5).
To better understand the BoP market and its peculiarities, MNCs and large companies
invested a lot in research, many times using non-traditional methodologies such as field
observation. For instance, interviewed M1 described three research programs the company used:
a) Living - In which employees lived for one day in a slum;
174
b) Working – Employees worked in a store as if they were sales attendants;
c) Shopping Trip – In which employees go shopping with consumers to understand their
shopping habits.
These kinds of researches were also used by M3, M5 and M6, indicating that there is a
great distance between large companies and BoP consumers even though their employees are, in
their majority, Brazilians. Actually, managers and directors from large companies come from
upper classes and, many times, are as distant from BoP consumers as their counterparts from
developed countries. As a matter of fact, they are foreigners in their own country.
It is very difficult because it is very distant from our reality and we start to create
some myths… People from our office are from the upper classes and have a lot
of difficulty to wear BoP shoes (M3).
It is easier to think of someone like you. Our employees are not from lower
classes, so it is difficult them to feel and act as if they were BoP consumers
(M1).
With all the investments made in researches, executives from large companies believe that
they understand the market quite well.
I think we have a good knowledge, even regional, of Brazil. We have researches
of how a low income consumer of the Northeast think, for example, how long
she stays in a store, how many products she consumes, how much is her income,
what she can buy… (M1).
On the other hand, large Brazilian companies might have the opposite movement. Some
of them started selling predominantly to low income classes and are now trying to strengthen
their operation in high income markets:
Nestlé had elitist products and is now creating mass products. Here is the
opposite, we had first mass products and now we want them to be more elitist. I
need to bring aggregated value to the business… We have to pay attention
because the BoP market still pays our salaries and makes it possible to do what I
want to do (M7).
The brand, recently, got more awareness in higher classes. During all the
company’s life we sold more to C, D and E classes. Now we are giving more
175
attention to some products (Premium products) and we are reaching the higher
class (M2).
However, in the first case, people who manage the company at the present moment are
from upper classes and have the same difficulty to understand lower income populations. Most of
them were hired from MNCs and think as MNCs, creating a distance from the company origins.
Consequently, they have a similar business model as MNCs.
One point that appears to differentiate companies with success in the BoP market is how
the knowledge is disseminated inside the company among all departments and employees and,
more importantly, how the BoP market is incorporated in the company’s strategy. In that sense,
one of the interviewed executives spontaneously declared the relevance of what she called a
DNA BoP, which would be the knowledge and commitment to operate at BoP.
When we perceived that the organization had that (BoP understanding) a little
bit more inside their DNA, the business unit (for BoP) closed and all the
products for low income consumers started to enter automatically in the
innovation funnel (M6).
Commitment, understanding, that is a profitable market, this has to be in the
DNA of the company (M6).
Another manufacturer agrees with that point of view, and, as a matter of fact, presents a
corresponding term: “the company’s blood”.
[to have success] BoP market has to become a priority of the company (…)
There are some companies that succeeded much more in BoP market, because
they understood that earlier and had already this market in their blood (M5).
However, the difficulty is that most of large companies’ employees come from higher
classes and have difficulty to put themselves in the poor man’s shoes, so the culture has to
breathe BoP in order to internalize the needs and peculiarities of the market.
It is very difficult because it is very distant from our reality and we start to create
some myths… People from our office are from the upper classes and have a lot
of difficulty to wear BoP shoes (M3).
176
It is easier to think of someone like you. Our employees are not from lower
classes, so it is difficult them to feel and act as if they were BoP consumers
(M1).
Just a few large manufacturers implemented changes in their organizational structure to
better approach this market. The most common change, used by MNCs and large companies, was
to strengthen the Northeast region where the greater proportion of the population is from low
income segments. Just one of the studied companies created a new area just to operate with BoP
markets.
In 2002 we created a business unit for BoP. The scope was Latin America and to
provide knowledge and innovation. This unit operated until 2005. It was
important to enrich our knowledge about low income markets that was not in our
DNA. We needed to communicate this knowledge so as to be part of our day-today operation and from the discussions of working teams. At the moment it
accomplished the objectives of creating a knowledge base and of managers and
directors to have the curiosity to understand that BoP is a different target with
different needs. The company realized that it was more inside our DNA and the
business unit was extinguished (M6).
From the above discussion, it becomes clear that unless BoP is incorporated in the
company’s culture, it is very difficult to create a coherent strategy. Moreover, it becomes very
hard to implement the strategy, as employees will probably continue with their prejudices and
myths and will not be able to produce good results.
It is not what guides our strategy. It is not a company oriented to BoP markets
(M3).
5.6.2
Small Manufacturers’ strategies to reach BoP market in Brazil
Large companies still have to face a competitive and fierce market. In almost all studied
markets, executives from large companies complained about the number of small competitors.
Many times, large companies were national leaders, but couldn’t beat local companies in some
places.
177
As interviewed executives declared, there are in Brazil more than 800 companies that
produce yogurt, 700 brands of cookies, 300 of olive oil, 200 mills, an “infinity of low-priced soft
drink brands”. Most of them are small, local and just sell in a small region.
Sometimes in the same region, I compete with different players. For instance in
the segment we work, I compete with a brand in São José do Rio Preto which is
very strong over there. When we go to Bauru this brand doesn’t exist and I have
to compete with another one which is also very strong in that city (M7).
This can be more complicated. Distinct neighborhoods inside one city can have different
local brand leaders:
(…) Every place is a different brand. São Miguel Paulista (district of São Paulo
city) is a brand, here (another district) is another brand; in Santo André (city of
the Greater São Paulo) is a third brand (D3).
As there is a proliferation of brands, it is difficult for a large company to beat all of them
and many times even to notice that they exist.
Many times they work below the radar. If a brand starts to grow from nothing,
there is an enormous delay until we notice it because it is regional… I depend on
the interest of the salesperson that works in the region to report this competitor
(M1).
However, this fierce competition is not a “privilege” of large companies. Small
manufacturers also face many local companies that compete for the same market.
We have more than 9 brands of my product in the city. There are a lot of
competitors. If it was not for that, I could produce and sell 4 to 5 times more
(SM1).
Formerly there were just one or two competitors. Now you can go to any
grocery store and you will find 5, 6, 8 different brands. So it divided our sales a
lot (SM4).
According to interviewed people, local companies have some competitive advantages:
178
1.
Low prices due to a smaller structure and informality. For instance, many small
manufacturers have just the owner doing all major management functions. They don’t have
marketing or human resources structure. Furthermore, there is a common understanding that most
of them don’t pay all the taxes.
There is a very important issue. Our company has 2.500 employees. To pay for
this structure you need an equivalent margin. These guys don´t have anything. In
one company, you have the owner that defines the package, what is going to
change… (M7).
Most of the companies that grew did that because they didn’t pay all the taxes…
because it is difficult to have a medium company in Brazil and to do everything
in a correct manner (M5).
Our company comprises my father, my wife and I. We don’t have employees. I
buy the raw material, clean the product, process and package it manually. I am
also responsible for the delivery. I do all by myself. I don’t have employees
(SM1).
2.
Access: Besides price, small manufacturers usually have a good distribution,
which implies in a more comprehensive access to low income classes. Since they operate in a
small region, it is easier and cheaper to have an intensive distribution in their specific area. This
can be done directly or even through wholesalers and distributors. Moreover, small companies
are more structured to operate with prompt delivery, which can be considered a source of
competitive advantage.
Company X has 70% of the market in Minas Gerais (one of Brazilian states). I
am a national leader with 50% of the market and this company has 70% in
Minas Gerais. It is already the second company of the market and is just
operating in Minas Gerais. But he doesn’t sell through wholesalers or
distributors. He goes directly to the small retailer. Company X has 200 sales
agents in the state and they do a great ‘ant job’ (M7).
Another advantage they have is their Distribution Center which is close to their
sales region. Whereas I take two, three days to deliver the merchandise, he
delivers in 24 hours (M7).
I deliver in one day (SM4).
I have logistics in this neighborhood. The only product that has logistics here is
mine (SM3).
179
A good distribution doesn’t necessarily mean an efficient distribution. Local companies
access a large number of small retailers in their operation area in a rapid way. However, in some
cases, as there is not a structured system of routinization, this doesn’t indicate that it is cost
effective.
Interviewer: What is the minimum sale that you request?
Executive: There is not a minimum request.
Interviewer: You said that the delivery might be in the same day, how do you
define your route?
Executive: Who defines my route is the client. The invoice is according to the
requests. There are trucks that go with one invoice, two, three invoices… (SM3).
3.
Brand image: Some of the companies that grow, start to have a good brand image
in the local region and then compete in a different and more aggressive level with large
companies.
When they (local companies) are just competing regarding price, we are not
worried. When they get to the marketing, then we get concerned (M1).
[Competitive advantage of local competitors] First thing is price. The second is
that there are already brands with good product acceptance (M5).
4.
Relationship: Sometimes, these companies are able to have a better relationship
with small retailers and even with the community, since they are closer and “speak the same
language”.
Brand X started to grow, started to advertise and to talk to this young (low
income) and started to enter his house. So Brand X started to be “cool” and
became much closer to this guy regarding his day-to-day life. The relevance of
Brand X to this young consumer is much greater than to that of an upper class
young consumer (M5).
Mr. Milton (owner of a supermarket) is a person that I have known for a long
time. I buy from his store. I know him very well… I also know the buyers from
Mr. Milton’s store for more than 20 years. I have a good relationship with them
(SM1).
180
This good relationship could also be identified in a large company, but a Brazilian one
that started and grew in a BoP market.
An MNC director never visits a store director. We go. Our sales supervisor and
regional manager talk to store directors from Carrefour and Pão de Açúcar. Even
our sales promoter talks to them. And this makes a difference (M10).
5.
Credit: Besides the closeness in relationship, these companies also may have a
better credit offer. In the same way that the retailer has the virtual wallet with their consumer, the
local company can extend its credit with the retailer in a way which is hard for MNCs and large
companies to provide, because of all the strict policies they have.
Sometimes they (local companies) have better commercial conditions, because
they give better extended credit terms (M5).
Furthermore, small companies are more flexible and can receive payments in a more
informal manner:
I receive checks from third parties. When there is not much merchandise, they
(retailers) pay in cash. They pay on my ‘fortnight voucher’. They pay the old
voucher and I note down the new one (SM1).
This flexibility can also be perceived in the way they deal with delinquency, which tend to
be more flexible.
When you see that the client is going through a difficult period, you have to
understand. When the client is a trickster then you have to stop (delivering)
(SM4).
6.
Good alternative: With all the above mentioned, the local company turns into a
good alternative for the retailer and for the population. It is a low-price, well distributed and
friendlier brand. It turns into a good value option and the brand can have a good acceptance.
They (local companies) are the value brand of the small retail (M6).
181
The consumer has a doubt between my brand and the local one, and he thinks,
the local one is much cheaper and ‘it fits my pocket’. Furthermore the local
brand is “cool” and talks to me, I will buy it (M5).
The competitive advantages discussed above differ from the three reasons stated by
Khana and Palepu (2006) for the success of local companies, which were:
-
MNCs have to face the same institutional voids local companies confront.
However, local companies and their executives are much more adapted to operate
in precarious circumstances;
-
Companies from emerging markets can tap talent and capital in developed
countries, and
-
Many multinationals are reluctant to tailor and adapt their strategies to the needs
of the emerging markets.
Khana and Palepu (2006) have a more managerial approach. Nevertheless, two essential
points that were not addressed by those authors are a) the distribution advantage local companies
have, owing to their proximity to the market; and b) the relationship local companies are able to
establish with local communities and local retailers, which creates a higher level of commitment
and enriches their brand awareness. Furthermore, local companies many times adopt some
practices (such as fiscal evasion) that MNCs and large companies cannot accomplish and also
have quite a small structure that makes their prices very low and available for consumers.
However, as for fiscal evasion, MNCs, large companies and government are taking some
measures in order to reduce it. For instance, in the beverage sector, companies are obliged to have
an outflow measurer equipment so as to declare all the production for tax payment. Another
Government initiative is the obligation of all companies to operate the Electronic Invoice which
will make it much more complicated for the companies (even small) to practice fiscal evasion,
because it will be easier for the Government to link the sales of the retailers with what they
bought from manufacturers, wholesalers and distributors.
Summing up, it is possible to verify that local companies have in their low-cost an
important competitive advantage. But it is not just about price. They also have a good distribution
and a better relationship with the retailers and consumers in their region. As stated by one small
company:
182
Executive: I believe in my product. I make a good product and have a
distribution which is good, with a relatively quick delivery.
Interviewer: What is a quick distribution?
Executive: Maximum until tomorrow.
Interviewer: Can it be on the same day?
Executive: Yes (SM3).
On the other hand, it is possible to identify some competitive disadvantages of small
manufacturers:
1.
Financial Resources: Large companies have much more financial resources and
are able to invest a larger amount of money in their operation.
Company X has a capital larger than I. My capital is small. Company X is a
large company. I am small. I can’t invest a lot (SM1).
2.
Product Portfolio: Small companies have a restricted mix of products and have to
compete against a more complete solution of larger companies.
Company X is larger than I. It has spices, packaging, many things… It sells
more than 100 items (SM1).
3.
Dependence of small retail from the region they operate: A large part of the
sales volume of these local companies is sold to the small retailers in the region. If those retailers
suffer from the competition of a new large retailer, the small manufacturers will also lose sales.
Local companies usually have difficulty to sell to large retailers owing to the costs and rigidity of
their contracts.
I have already sold to Pão de Açúcar, to Carrefour, but I am not able to do that,
because I don’t have price and my production is also small. It is hard to sell to
large retailers (SM3).
4.
Scale: Large companies are able to have scale of production, which is very
difficult for small companies to produce.
183
We produce 80 thousand liters per day, while Company X produces 3 million
liters. That is leadership (SM3).
5.
Communication: Small companies don’t have resources to communicate widely
their products. Even sales promotions in the point of sale are rare.
6.
Business Administration: Small companies don’t have the condition and
knowledge to use business tools that could help them in management.
We don’t have sales graphics. We are a small family company (SM3).
5.6.3
Marketing strategies to reach BoP markets
As distribution is part of an overall strategy to reach BoP markets, this section describes
how manufacturers adapt their marketing mix strategy for BoP. In relation to the marketing mix
adaptation, the most relevant strategies that interviewed executives presented are described in the
following table.
184
Table 5.9: Marketing Mix Adaptation
MARKETING MIX ADAPTATION
“What we have done is to reduce the costs: let’s take out everything
that doesn’t add to the benefit. It delivers the same benefit, but, for
instance, the package is less attractive” (M3)
“You need a proper portfolio, an adherent portfolio. It is not enough
to have 1 or 2 SKUs, you have to have a portfolio, otherwise you
will not give your distributor, your wholesaler or the Cash & Carry
enough strength […] and it has to be profitable for all the supply
chain: manufacturer, distributors and small retailers” (M6).
“You have to offer the proper portfolio to the point of sale, knowing
that this portfolio will help him” (M5).
“Have the right product. Many times the local company is much
better than us” (M1).
“The best thing our product has is the certainty. We are a family
company and make a serious product […] In relation to quality, I
can assure you that the product is excellent” (SM3).
Price
Affordable
“For a small point of sale, without a great potential we will offer the
price
smaller product that costs 50 cents” (M5).
“You have to have the right product, the right price” (M1)
“Low income is low income. It is out of pocket” (M4)
“In order to sell to the East region (low income) you need to have a
good price” (SM4).
Promotion Talk the right “This year all the communication that we are doing, mainly the
language
communication with mothers, is based on low income classes”
(M5).
“There were many initiatives, different communication. So we had
different contents, different media strategies” (M3).
Place
A
high “The difficulty with BoP markets is that many times I have to reach
capillarity.
places that I was not used to access. And I have to make these
Distribution is people (distributors) to get there, because I will not reach those
fragmented.
places” (M1).
“The challenge is to have a more capillary distribution. I want to see
if we learn more about that” (M10).
“We have this orientation of capillarity, of increasing numeric
distribution” (M3).
“Your logistic capacity, your ability of reaching the small retail”
(M4).
Product
To have the
right product,
with
the
benefits
that
low
income
consumers
value.
Source: Elaborated by the author
In this idea of marketing mix adaptation, some companies created new brands so as to
compete in BoP markets.
Because our market is divided in two: 35% is from A/B classes and 65% from
C/D/E. Our brand had a premium price, that couldn’t be affordable and we lost
market share to some competitors with lower quality. Our product is a
commodity and many times price is the most important decision factor. So we
185
created a second brand exactly because of that. It is better to lose to the right
pocket than to the competitor. Our second brand is growing a lot in this category
(M8).
However, for a large company it is not enough to create just one new product for BoP,
because that will not be sufficient or even financially efficient to change the distribution model
because of a limited portfolio. This indicates the need to have a strategy aligned to the objectives
of the company. Adapting the product mix may be interesting but it is not sufficient.
Furthermore, differently from what was stated by Dawar and Chattopadhyay (2002), some
companies start to try to understand and create segmented approaches at BoP. Perhaps it is an
evolution from the strategy definition for this market.
So we started to segment, to understand the profile of low income consumers by
shopping behavior, by desires, consumptions and everything else (M6).
One of our projects is to segment (…) which is to look at the end consumer and
offer different products (M9).
5.7
Dichotomy between scalability and micro actions
Another important finding was the dichotomy between scalability, so essential for BoP,
and micro actions, which still seem one of the ways used by some companies to reach some
communities. It became clear in this study that, many times, scalability starts with micro actions.
This was perceived already in the analysis of secondary data, where some distribution
models underlined this dichotomy as it is in the case of Shakti (HUL), Healthstore and Nestlé.
Even though it wasn’t the purpose of this research, this idea appeared again in some interviews as
for instance the Activia Day presented below:
We had a Kombi van and two operations: The first day we distributed folders
indicating the day that we were going to the community to sell the products
directly, or we announced ourselves by the use of the van loud speakers and
afterwards we came back selling the product (Danone).
When describing these local actions, large companies don’t do it alone, but in partnership
with NGOs. This practice is aligned with the knowledge review, in which it was identified new
186
business models for BoP that large companies co-create with NGOs models to reach BoP
(BRUGMAN; PRAHALAD, 2007; SEELOS; MAIR, 2007).
It is scale. Today the focus is that of partnership. We have a project that started
with five pilots and we are in those communities with an NGO that gives all the
teaching know-how and then we train young people […] We train these young
people so that they can work with us or even with one of our clients. Walmart
and Carrefour are also entering the project because they need trained people
(M5).
Besides partnering with NGOs, some companies go a step further and enter directly in a
community creating a close and direct relationship with them. This model, if not the same, is
close to the idea of co-creation with communities supported by Simanis and Hart (2009).
Some work that I conducted myself in Latin America with the real involvement
of the community and working in pro of the community. The effect exists and
the emotional link created between the community and the brand is in a
dimension never seen before by any brand (M6).
Now we are doing this sales project in Rio de Janeiro, in which we are with an
NGO that we are teaching nutrition [for the population] (M3).
Nevertheless, even though it might have good results, it is not easy to enter a community
and to start a new relationship. As analyzed before, trust is an important antecedent for
partnership and some initiatives failed because they couldn’t create a link with the community.
It is funny, because when we tried to join small retailers it was very hard. It is
more difficult to join small retailers than drug dealers. They don’t speak to each
other. What we started to see is that we had to join not competitors’ retailers. We
had a grocery store, with a lan house, a bakery and other non competitors. So,
we started to say: ‘you are all in the same segment which is an open air shopping
mall. Why don’t you talk together?’. But we started to see that there wasn’t any
dialogue. They live in the same community, in the same place but don’t talk to
each other. And talking about grocery stores that could have a synergy and we
proposed ‘let´s buy together to have more bargain power with wholesalers’.
They said: ‘No, that´s impossible’. I think that if retailers talked more to each
other, they would gain strength (ABAD – Brazilian Distributors Association).
Despite not being the mainstream of distribution for BoP, local actions appear as an
approach used by some companies to reach some communities. These local actions let the
187
companies closer to consumers both physically and emotionally and therefore are very important
for building trust.
However, only in a few interviews those local actions could be perceived, indicating that
they are still exceptions initiatives of some companies. Nevertheless, by the optimistic view of
those that succeeded, it might be a different approach to distribute products and services for BoP.
Moreover, these initiatives are aligned with the recent business models designed to reach BoP.
5.8
Innovation
Innovation is a domain full of concepts, theories and discussions. This section aims at
presenting two concepts related to innovation in BoP markets and afterwards to discuss some
innovations that could be observed in the research.
Emerging markets offer great opportunities for disruptive innovation, which challenge
industry incumbents by offering simpler, good-enough alternatives to an underserved group of
customers (CHRISTENSEN et al, 2006). Disruptive innovation is more applied to new products.
As a rule, mainstream customers are unwilling to use a disruptive product in
applications they know and understand. At first, then, disruptive technologies
tend to be used and valued only in new markets or new applications; in fact, they
generally make possible the emergence of new markets. (BOWER;
CHRISTENSEN, 1995, p. 45).
In another view, it is possible to identify that the development of emerging economies and
its growing relevance to companies and markets, introduced a new approach to innovation.
Global companies, as General Electric, are creating a process of reverse innovation, in
opposition to the glocalization approach.
With glocalization, companies develop great products at home and then
distribute them worldwide, with some adaptations to local conditions. It allows
multinationals to make the optimal trade-off between the global scale so crucial
to minimizing costs and the local customization required to maximize market
share (IMMELT et al, 2009, p.56).
On the other hand, under reverse innovation,
188
Almost all the people and resources dedicated to reverse innovation efforts must
be based and managed in the local market. These local growth teams need to
have P&L responsibility; the power to decide which products to develop for
their markets and how to make, sell, and service them; and the right to draw
from the company’s global resources. Once products have proven themselves in
emerging markets, they must be taken global, which may involve pioneering
radically new applications, establishing lower price points, and even using the
innovations to cannibalize higher-margin products in rich countries (IMMELT et
al, 2009, p.56).
These concepts of reverse and disruptive innovation are in accordance to the BoP
knowledge examined before, since they believe that emerging markets are fertile places to
develop new products and applications that could later be transferred to other markets. Likewise,
in the most recent researches of emerging markets, it is suggested to co-create the business model
with local partners and/or the community, in spite of reaching these markets with a central,
preconceived strategy,
In this research some innovations could be identified and linked with the concept of
reverse innovation, which is wider than disruptive innovation and better accommodates
innovation rather than product. Some examples of these innovations are:
•
Using the knowledge from Egypt and Morocco, one multinational company is creating the
figure of sub-distributors to reach the smallest possible store. It is an arm of the
distributor. This a typical case of lengthening the marketing channels so as to reach
scattered and/or difficult places, as suggested by Jaffe and Yi (2007). This solution that
probably wouldn’t be developed in rich and structured countries, make sense to many
emerging countries. Even though, it is not a great innovation, since there are many
examples of the use of sub-distributors in Brazil, one of the future projects of one of the
interviewed distributors is also to create sub-distributors to amplify its coverage.
•
In the personal care segment, several large companies which were competitors partnered
to create a specialized distributor in the category. The category of personal care as a
whole was not developed. In the small markets the grocery was very well developed,
however cleanness and hygiene had only a small exposition with two or three basic
options. Then companies started to identify that a manufacturer alone could not do this
job of valuing the personal care products. The entire category should develop in the
channel, mainly because these products involve a buying experience, in which variety,
exposition, visual merchandising are very important. Then the DECs (Category
189
Specialized Distributors) were created, with the concept that main manufacturers should
work together to improve the category. Main competitors now distribute their products
through DECs.
•
Door-to-door is not a new channel to distribute products. However, it was always seen for
just a few categories: “the great door-to-door model in Brazil, I would say that there are
three businesses: Avon, Natura and Yakult” (M8). The use of door-to-door is an
innovation for food companies such as Nestlé, Danone, Vigor and because of that it can
be seen as an innovation. The main target of these companies in the door-to-door channel
are low income consumers.
•
Some companies start to create partnerships with NGOs and communities and are getting
some good results out of these partnerships. “I personally developed some jobs in local
communities. The effect that exists, the emotional link that creates: it is a dimension never
seen by any brand” (M6). For instance, Coca Cola created a partnership with an NGO to
train and develop young people in technology information. This initiative has two
objectives: to be more relevant to the community and develop people to work in the trade.
•
Danone also created a marketing action with the community.
We developed a marketing initiative that we called ‘Activia Day’. On this day
we brought nutritionists to create healthy consciousness in the population.
Besides there was a conference and an individual consultancy. We did a raffle
and there was a space for children. So what did we do? We communicated
strongly using local means, like street posters, local radios, etc. Before doing
that entire job, we visited the stores [in the community], told them about the
service we were offering. So, we would increase our sales, develop our product
and help the community. Do you want to be our partner? When we do our
action, we are going to say: You can find Activia in store A, or store B. To
advertise your store, you have to buy our product, expose the way we
recommend with the right price. Then many retailers agreed and we developed
the action in the community […] As a result, we had some communities, where
sales doubled (Danone executive).
The difficulty here and the greatest challenge are to establish long lasting initiatives. In other
words, a one shot attempt might not provide the expected results. The point is how to have
continuity and create a long range relationship with the community.
190
6
A SUBSTANTIVE THEORY FOR DISTRIBUTION TO BoP
6.1
Introduction
This chapter aims at presenting the substantive theory that emerged from data. The
process of identifying the major categories that are associated to a satisfactory distribution was
not linear. It followed the process of interviewing, coding and constant comparison presented in
Chapter 3. From the analysis of the categories developed in the selective coding, presented in
last chapter, three major categories emerged, with a central role in defining satisfactory access to
BoP markets: willingness, execution and relationship.
Since the first interview with one distributor, which was followed by a field observation,
one important element that appeared was “relationship”. The relationship between the distributor
and retailers induced to the idea of its relevance, because in the stores that the salesperson had a
better relationship, sales were “easy”. On the other hand, for customers that still weren’t known,
the difficulty to sell was huge, as it was mentioned before the retailer that told the distributor’s
salesperson: “hey wait. You can’t just arrive here and sell everything…” .
Several questionings came up from this point: is relationship important in the entire
marketing channel? What is the role of trust? And more importantly, is there any difference for
high income markets, since relationship is a key element in the marketing channel literature.
With those questionings, the constant comparison process started. Firstly, with the
literature identifying the main constructs of relationship and secondly with other companies. In
other interviews, some distinctive elements for relationship in the base of the pyramid appeared.
Most of the executives agreed that in low income markets relationship is friendlier and depending
on salespeople. Marketing channels at BoP also needed a higher level of support. Moreover,
relationship confirmed to be a strong element in distribution in the entire marketing channel,
since it was mentioned as relevant by manufacturers, distributors, specialists and retailers.
As the research advanced, it got clear, that although important, relationship was not
sufficient. BoP was still a new market for the majority of the large manufacturers. Hence, the idea
of understanding the peculiarities of the market and the consumer arose as an important element.
Moreover, it seemed that, companies that reported a higher success at BoP, didn’t have
191
necessarily just a distribution strategy. It was much more about having an aligned overall
strategy, in which, BoP was inserted.
This point evolved to the notion of the relevance of understanding the company structure
to develop strategies for BoP. The interviews suggested that some companies were more
advanced in defining those strategies than others. The knowledge about BoP was important, but
didn’t explain the whole story. It was when one interviewed executive, from one large
manufacturer, declared that the company had already the BoP market in its DNA, that the
concepts of knowledge and BoP DNA could be joined into a more abstract idea of willingness,
which was the commitment of the entire company in developing strategies for BoP.
Still, in the strategy field and in the constant comparison process, the BoP literature
suggested that innovation is an important element that differentiates some successful cases at BoP
(for instance, Wizzit and Shakti from Unilever). Although some innovative and successful
initiatives were mentioned in the interviews, innovation didn’t appear as a strong element in the
substantive area analyzed.
In the process of interviews analysis, it drew also the attention for the many obstacles
pointed out to distribute consumer goods products in Brazil. Safety concerns, logistics, cost
structure and difficulty to offer credit were the main concerns identified by executives. This
notion was aligned with the BoP literature, mainly with the concept of institutional voids
presented by Khana and Palepu (2006).
Moreover, the testimony of some executives, suggested the idea that the channel design
should be defined based on those institutional voids. For instance, in more dangerous or scattered
places, sub-distributors might be used. Again, this concept was aligned with the propositions
stated in the literature, mainly by Jaffe and Yi (2007). Therefore, based on those peculiarities of a
BoP market, it arose the major category of execution.
The definition of those three major categories was done through the line-by-line analysis;
constant comparison among interviews and between interviews and literature, and through the
coding process explained in section 3.4. Moreover, it allowed understanding the existing
differences in distribution among the interviewed companies and also it shed light to the reasons
for the competitive advantage of small companies that have a straight relationship with the
marketing channel, basically sell to BoP markets and have a flexible and good execution.
192
Next sections will further explain the three major categories, their properties and
dimensions.
6.2
Willingness
Willingness is a major category that came out from the coding analysis and is a
consequence of two properties that were already analyzed: BoP market knowledge and BoP
DNA.
The first property of willingness is BoP market knowledge. Companies that deeply
engage in the BoP market usually are more capable of thoroughly understanding the potential of
the market and its peculiarities and consequently have an advantage on developing appropriate
strategies.
This knowledge of demystifying low income as a block. We start to understand
the richness of the consumer; we start to have a lot of insights. When we started
announcing these differences, to involve the managers and directors, it was
possible to generate lots of insights (M6).
The knowledge about BoP market and BoP consumer is seen by interviewed executives as
a first step to develop strategies for this market. MNCs and large companies realize that they lack
this knowledge and therefore invest in marketing research so as to better understand this market,
as it was already explored in chapter 5.
What defines the success of a product is knowledge. During years, we tried to
produce powder detergents that didn’t produce foam, because we know that
foam doesn’t clean; it doesn’t make any difference. During years, I fought
against the consumer. He/She wants foam. In Brazil, detergents have to produce
foam (M1).
However, it is not only the market knowledge that defines the interest of a company in
reaching the market. For instance, there are companies that know the potential of BoP market but
still are not willing to have a strong operation there.
193
It is not a company oriented to low income markets (M3).
I think that many companies say they are focusing BoP, but they don’t have that
in their ‘veins’ (M5).
Therefore, another important property is the company’s commitment to operate at BoP
markets that is impregnated in the company’s culture.
Interviewer: What are the resources and competences a company has to have to
distribute for BoP markets?
Executive: First of all it is the commitment. The understanding that it is a
profitable market. This is in the company DNA (M6).
It is not I saying. The company is seeing that is over there that we must go [BoP
markets], it is how to satisfy [BoP] consumers (M1).
This company commitment was defined before as BoP DNA. As discussed in the
knowledge review, one of the elements for a market oriented organization is culture oriented to
the market, with beliefs, values and behaviors that emphasizes superior value to the client and
continuous search for new sources of competitive advantages. In BoP market that is not different.
With another dimension. As analyzed in the results, most of large manufacturers’ employees
come from higher classes and have difficulty to put themselves in poor men’s shoes, so the
culture has to breathe BoP in order to internalize the needs and peculiarities of the market.
While BoP is not incorporated in the company’s culture, it is very difficult to create a
coherent strategy. Moreover, it becomes very difficult to implement the strategy, as employees
will probably continue with their prejudices and myths and will not be able to produce good
results.
Therefore, the BoP DNA allows that the company understands and realizes the potential
of the market and its employees absorb the differences in approach and the needs of BoP market.
Furthermore, the BoP DNA allows the company to have a strategic alignment. It means that pure
product adaptation or new marketing channels not aligned with the overall strategy have a lower
success propensity.
The large quantity of spontaneous comments from interviewed executives about the
relevance of other strategies as product, price and communication indicates that marketing
channels can’t be seen just as a strategy unlinked with the business model. On the contrary, the
194
distribution strategy was considered as one part of an integrated strategy aligned with the
objectives of the company.
Based on those two properties – Market Knowledge and BoP DNA – it was defined the
first major category to establish satisfactory distribution strategies for BoP: willingness, which
means the effort, knowledge and enthusiasm a firm has to operate at BoP markets. Higher
willingness degrees indicate more success possibilities for a company. One comment from an
interviewed executive from his professional experience in different companies shows the
importance of willingness.
You got a very interesting point: I came from two different companies. The first
one used to go to slums and was always at the Rocinha (an important slum in
Rio de Janeiro), so people understood what C and D classes wanted.
Professionals were qualified, but people from the base helped. When I came to
the other company located in São Paulo, professionals from the office were very
well educated. Once I wanted to hire a person from a ‘second-line’ university
and the president didn’t allow this. He had a PhD at Harvard and just wanted
people with the highest possible educational formation. The world of the
professionals was just São Paulo and Morumbi (High income neighborhood in
São Paulo) (M5).
From the above comment, it is noticed that different companies have different perceptions
about BoP market. These different perceptions induce to different strategies and as interviewed
executives declare, the propensity to define and execute proper strategies for BoP is much higher
in those companies that incorporate BoP in their DNA, really understand and want to compete in
this market.
In order to clarify the ideas presented, next figure presents the interactions of the
categories and sub-categories so as to create the major category of Willingness.
195
Competition BoP
market
Strategy
BoP DNA
Competences
Company
Structure
Willingness
BoP knowledge
BoP
knowledge
BoP Market
Figure 6-1: Properties of Willingness
Source: Elaborated by the author
Moreover, the figure below presents the interrelation of willingness’ properties: BoP
BoP
Knowledge
knowledge and BoP DNA, identifying their dimensions.
Potential Willingness
Low Willingness
High Willingness
Latent Willingness
BoP DNA
Figure 6-2: Properties and dimensions of Willingness
Source: Elaborated by the author
Low Willingness is characterized by a low level of commitment and low BoP knowledge.
There is not a structure dedicated to the subject or even an aligned strategy toward BoP. Global
196
companies entering emerging markets are a good example of this position, once they were
concerned just with the higher tiers of these markets (KHANA; PALEPU, 2006).
We don’t have a specific orientation like: ‘I want to reach low income
consumers’ (M4).
Potential34 Willingness occurs when there is a higher BoP knowledge, but still with a low
level of commitment. Large Brazilian companies or even MNCs with a long period of time
operating in the country might be in this position. Usually there is a bottom-up pressure to
operate at BoP and it can happen when professionals from other companies bring new ideas.
Then, we started doing researches, ethnographic studies and things started to
change. So, you start trying to change something. So, I think that when those
large companies began to delve into low income markets, things started to
change a little (M5).
Latent35 Willingness is characterized by high BoP DNA and low BoP knowledge. This
case is typical of an MNC or large company that understands the importance of BoP markets for
their business, but still don’t have the appropriate knowledge to design the right strategy. In these
cases, the urge for understanding the consumer and the market can cause a restructuring of the
firm, with the creation of a BoP business unit, as it was the case of M6 described before36.
High Willingness occurs when there is a high commitment and a high BoP knowledge.
Even though as an emergent strategy, local companies are usually positioned in this quadrant.
Also, large companies and MNCs that understand and are really oriented to the BoP market have
this high willingness.
Figure 6-3 presents a preliminary attempt to relate willingness to satisfactory distribution.
It is an attempt to operationalize the major category of willingness, using the data from the
research. This procedure is aligned with the suggestion of Goulding (1998):
34
Capable of being or becoming.
Present but not visible, apparent.
36
At the moment of the research, M6 was considered as “high Willingness” because it had already created the
knowledge and commitment to operate at BoP.
35
197
Grounded theory has a built-in mandate to strive towards verification through
the process of category “saturation” which is achieved by staying in the field
until no further evidence emerges. Verification is done throughout the course of
the research project, rather than assuming that this is only possible through
follow-up quantitative data. The developed theory should also be true to the
data, it should be parsimonious (GOULDING, 1998, p. 52).
The figure and table below show how the interviewed companies might be mapped in
relation to willingness to operate at BoP markets, based on the speeches of the executives. This
view might be biased and because of that is more illustrative than definitive. In this figure, the
small companies were considered together, as it wasn’t possible to differentiate their knowledge
and commitment. In this case the knowledge is high as they are all companies that have been
operating almost exclusively in BoP markets for a long time and therefore incorporated a vast
amount of knowledge. BoP DNA is also high, since they are embedded in low income
communities.
BoP
Knowledge
M2
Potential Willingness
M1/M
5/M7
M6/
SMs
High Willingness
M8
M3
Low Willingness
M9/
M10
Latent Willingness
M4
BoP DNA
Figure 6-3: Evaluation of willingness of interviewed companies
Source: Elaborated by the author
198
Table 6.1: Evaluation of willingness of interviewed companies
Comp
any
M1
BoP Knowledge1
BoP DNA1
“We have three research programs to improve
low income consumer behavior knowledge of
our employees”.
****
“It is easier to think of someone like
you. Our employees are not from
lower classes, so it is difficult them
to feel and act as if they were BoP
consumers”.
***
“Now we are modifying some
products to reach higher classes”.
****
“It is not a company oriented to low
income markets, but when you speak
about a strategy for Northeast, then
OK, we have something”. (**)
“We don’t have a specific orientation
like: ‘I want to reach low income
consumers’”.
*
“We woke up to that (BoP markets)
recently”.
***
“Commitment, understanding, that is
a profitable market, this has to be in
the DNA of the company”
*****
M2
“We have always served classes C, D and E”.
*****
M3
“People from our office are from the upper
classes and have a lot of difficulty to wear BoP
shoes”.
**
“There are details that we, from large urban
centers, don’t know”.
*
M4
M5
M6
M7
The company has different strategies for low
and high income according to their needs.
****
“We had a business unit for BoP […] When
this business unit accomplished the objective
of transferring the knowledge of this market
[…] we closed the business unit”.
*****
“Interviewer: Do you think you can have a
differentiation because of your local
knowledge? Executive: Yes, I think so”.
****
M8
Perceives a good knowledge.
***
M9
“It’s a new market for us. We are still
learning”
**
“First important thing is to know the consumer
[…] We know this consumer each time better”.
***
“We have the knowledge of the region. I have
been delivering merchandise ever since the
1980s”.
*****
M10
SMs
“We have to pay attention because
the BoP market still pays our salaries
and makes it possible to do what we
want to do”
***
“Interviewer: In your company, is the
BoP market considered relevant?
Executive: Without any doubt. BoP
represents 65% of our market”
****
“We want our brand to be accessible
to everyone”
****
“We have a great potential to grow in
low income markets”
***
Almost all of the sales are for low
income people
*****
Source: Elaborated by the author
1
The number of ‘stars’ indicates a higher presence of the variable.
Willin
gness1
***
****
**
*
***
*****
***
***
***
***
*****
199
Considering that the main purpose of this research is to identify, in the perception of
executives working in the market, the conditions associated to a satisfactory distribution for the
BoP market in Brazil, the next chart aims at relating the willingness to operate at BoP with a
satisfactory distribution; suggesting a positive relation between the two variables. The Y axis is
defined by the description presented in Table 5.1; and the X axis is defined by the analysis
presented in Table 6.1. Again, this is just a preliminary attempt to operationalize the major
category of willingness.
Satisfactory
Distribution
SMs
M9/
M5
M8/
M10
M3
M6
M2
M1/
M7
M4
Willingness
Figure 6-4: Willingness as a condition associated to satisfactory distribution.
Source: Elaborated by the author
6.3
Execution
Execution is a major category that is based on the marketing channel operation. Similarly
to any market, execution is very relevant to reach BoP. The main difference is the complexity of
this distribution in a capillary, non-structured and informal market. In BoP execution has
different contextual conditions, such as:
•
Institutional Voids.
•
Capillarity of the market.
•
Informality.
200
•
Regional Differences
Owing to those obstacles, it is often more expensive and more difficult to get into these
markets consistently, with the right frequency and still giving the support to develop the
marketing channel. Therefore, execution is an important resource to create competitive advantage
within distribution strategies. As an interviewed executive declared:
When you ask the small retailer who serves you better, he will answer that firstly
is the friendship with the salesperson. Secondly, it is the delivery. Sometimes we
can understand delivery as punctuality and in other cases delivery of products in
good conditions […]. Lastly, there are the financial conditions (M5).
Next figure presents the interactions of the categories and sub-categories that form the
major category “Execution”. The BoP environment dictates the definition of the channel design
of the company and also the manner to establish the operation in the marketing channel. In order
to better explore the concept of operation in the marketing channel, next pages will explore five
properties of this category: channel design, logistics, sales structure, cost structure and
commercial policies (see appendix 3).
Direct Sales
Retailers
Channel Design
Wholesalers/Distri
butors
Competition BoP
market
Execution of
Marketing
Channel Strategy
BoP Environment
Institutional
Voids
Operation
Marketing
Channel
Figure 6-5: Properties of execution
Source: Elaborated by the author
OPERATION IN MARKETING CHANNEL:
The main subcategories that define “Operation in Marketing Channel” are: channel design,
logistics, cost structure, sales structure and commercial policies.
201
Logistics
Cost Structure
Operation
Marketing Channel
Flexibility
Sales Structure
Credit
Commercial Policies
Avoid channel
conflict
Channel Design
Support to small
retail
Figure 6-6: Properties of Operation in Marketing Channel.
Source: Elaborated by the author
1. Channel Design: The first important decision of a distribution strategy is the channel
design, which means how the marketing channel will be structured. As discussed before, there are
marketing channels more and less appropriate to operate at BoP. As this point was thoroughly
discussed in last chapter, it won’t be further analyzed here.
2. Logistics: The capillarity of BoP markets intensifies the importance of efficient logistics.
Moreover, small and distant retailers usually buy small portions and limited units of products. As
argued by one of the specialists interviewed:
What I notice is that maybe there is just one factor that changes when you talk
about high and low income populations: it is the size of the truck. Nowadays, a
truck to go out from a distribution center has to be well balanced in terms of
volume/kg (…) Today the logistics are very important in the wholesaler /
distributor margin to supply those small markets (S2).
Large and small manufacturers pointed out the importance of an efficient logistics, which
is related, in their opinion, to reaching a larger number of people. Large manufacturers try to
reach some far locations in a hostile transportation infrastructure that makes costs high and
delivery late. Despite being close to their clients, small manufacturers also need to have an
efficient logistics so as to create a competitive advantage of fast delivery, as well as not to let the
202
cost to be very high, as margins are normally very low and an increment of transportation costs
might be fatal.
There are areas that are more difficult to reach. For instance, there is a city in
Minas Gerais that we have to go to Cuiaba (capital of the state of Mato Grosso)
and from there you still have 1500 km of dirt roads. Therefore, it has a different
price table (M2).
[…] difficulty of distribution as it is very difficult to reach some places. In the
state of Bahia, for instance, there are only 120 kilometers of two-way highways,
which is nothing. So all the roads over there are terrible (M1).
Companies that access BoP markets also have to know exactly the unsafe places where
they cannot go, or the right time they can enter a slum.
There isn’t a month that our trucks are not robbed. And there are some routes
that are difficult to find a driver that wants to go (D5).
There is the mess of a slum. Sometimes we deliver the product in a commercial
point and someone gets the product then takes it on foot to the slum (M9).
There are some regions that I don’t enter [because of robbery]. There are regions
that have 2 or 3 supermarkets that I don’t serve, because it is a risky area (D6).
Besides reaching those places, differentiated companies are able to do it fast. For instance,
one of the interviewed distributors had as one differential prompt delivery. In this aspect, some
small manufacturers can also have a competitive advantage, as they are close to their market and
can deliver, even small orders, in 24 hours, which is quite impossible for a large manufacturer.
3.
Sales Structure: As thoroughly described, salespeople from companies operating
at BoP have to approach small retails where people without formal education prevails and that
demand a simple communication. Sometimes salespeople with a high educational background are
not able to talk the same language as these small retailers that feel more comfortable with “people
like them”. Furthermore, as small retailers are scattered, each region or each community has its
own language codes. Owing to that, salespeople chosen by interviewed distributors are preferably
203
from the community and might have a similar level of formal education as small retailers. This
allows a higher empathy and it becomes easier to build a friendly relationship. Thus, the sales
structure should consider this type of salesperson profile. This idea is similar to one of the
principles Prahalad (2005) proposes to develop new products for BoP markets. According to him,
the lack of formal education demands a simplified work for the employees. Even though this idea
was related to product development, it can be transposed to sales management.
You can’t hire a person with a PhD in the best university. It has to be a person
from the region that talks the clients’ language (D2).
Our best salesperson for small retailers is a warrior. He visits 40 clients in one
day. He is a simple and humble person. His language is that of the outskirts; it is
different. In high income neighborhoods, the salesperson is studying in college.
In low income clients, the service is quick. But fast service doesn’t mean, lack of
relationship. On the contrary, he has relationship, but is quick (D6).
Another point about sales structure is that most large companies interviewed have
different regional structures and different marketing channels for large, medium and small
retailers. With that they may have a decentralization of their operation, gaining in flexibility and
in relationship.
So we have the structure of the key accounts that is responsible for the five main
clients that we have in Brazil […] and all the rest stays in the hands of our
regional structure. (M8)
As trust depends on time of operation and in the relationship with salespeople,
interviewed companies try to motivate them and mainly to avoid large turnovers. Therefore,
engaged employees that feel valorized might be a source of competitive advantage.
This type of salesperson usually has a low level of formal education, so I think
that for these people the turnover is always high (M3).
Moreover, as small retailers in BoP markets have a lack of formal education, sometimes,
manufacturers create different structures to serve them with different brands so as to reduce
cannibalization, as the owner of this small retailer doesn’t manage his portfolio very well and is
more concerned with price of products than product mix administration.
204
We usually have two different distributors […] so as not to offer both our brands
to the small retailer with the same salesperson. In this kind of retail the person
will buy based on price. In high income neighborhoods there is a good sense and
discernment from the buyer to understand the differences between brands. The
guy from the bakery in low income neighborhoods has R$ 50 to spend and he is
going to buy the cheapest products (M8).
Summing up, the major dimensions of sales structure are twofold: salespeople’s profile
that must be adequate for their interlocutor and the sales organization that has to be adapted to
serve scattered regions with different needs.
4. Cost Structure: The management of the cost structure is another challenge mentioned by
interviewed executives. To distribute to BoP markets, companies need to distribute their products
in an environment of informality and lack of infrastructure. Therefore margins are low and costs
have to be maintained under control. Next statement is an excellent portrait of how the
environmental characteristics impact on cost structure.
In the United States, the volumes are so high that any percentage that you get
from the business justifies a dedicated sales team. In countries as Italy, if you
have people in Milan and Rome you get the entire country. You don’t need
people in Naples and Sicily, because the concentration is huge in two points. In
Chile it is the same thing, where you just need people in Santiago. However, in
countries as Russia, China and Brazil this concept doesn’t make sense. We don’t
have either the volumes of the United States or the concentration of a small
country. Therefore, we needed to structure a clear channel division, but we
learnt that it creates a higher cost and it doesn’t offer the needed results (M1).
So as to minimize the impacts on cost structures some companies create solutions, usually in
the sense of lengthening the channel as suggested by Jaffe and Yi (2007)
The Northeast has a characteristic to be served by mini-wholesalers. You sell in
the state capitals, and those mini-wholesalers distribute in the small cities,
because no one reaches the places they go, it would be very costly (M4).
I want my distributor to reach some low income dealers; it will have a cost that
will not compensate. Hence, we developed the sub-distributor. My distributor
will find someone that is not even working with our categories to distribute our
products (M1).
205
Besides, depending on the marketing channel chosen, costs might be higher. For instance,
door-to-door channel is a very expensive one and consequently is more appropriate for high
margin products.
[In door-to-door channel] you have to take the products to the house of the
saleswoman. You have expenses with car, logistics and staff. When she needs
something on the street, you have to send a sales promoter to accompany. You
also have difficulties in receiving the money (D4).
As low income has, by definition, a limited budget, it is quite important to be cost
effective so as to be competitive in the market. As analyzed before, to reach BoP it is not
necessary to have the best price, but the market demands a cost effective structure.
Company X has an excellent distribution, but are they able to sell their product
to small retailers at an acceptable price for the consumer with the heavy
structure they have? (S1).
Both logistic efficiency and cost structure are related to the discussion that poor people pay
more for the same products. Although, this is studied, at least, since the 1940s, the hurdle
infrastructure and difficulties to access BoP markets, still make this market less efficient and
consequently, low income consumers pay this poverty penalty.
Owing to the regional differences, and the importance of the Northeast region for BoP
market, many companies are reanalyzing their structure and creating business units or even
factories in the Northeast to better serve this region and mainly to reduce their cost structure and
consequently to be more competitive.
Our problem is that the product is a commodity and the further you go, the more
expensive you are (M8).
Furthermore, as the cost to serve small retailers is high, mainly when a company operates
nationally, it is harder for some categories to operate efficiently in low income markets due to
their small margins. In these cases, regional and local companies are a great threat.
206
[The success secret to serve properly low income] is to know where you want to
operate. There is no way in a country with Brazil’s dimensions to think that you
are going to adequately operate for all BoP market. You have to have the right
product and focus in the regions you want to operate. I think that the model of
the coffee industry (with many regional brands) applies very well. When you
think about cigarettes and drinks that have a higher margin it is possible to
deliver nationally directly to retail. In the same way, Nestlé and Unilever have
higher margins and can also operate properly in these regions (M4).
5. Commercial Policies: According to interviewed executives, commercial policies play a
key role in distribution. There are many facets to build strong commercial policies that are
described below:
Credit: As declared by several interviewed executives, credit can be a source of help to a
non professionalized and non qualified small retailer that still needs support to run his business.
The credit has to be given in the exact term so as for him (small retailer) to sell,
receive and pay, otherwise, as he is disorganized, the money ends up in other
destinations. In that way, we help the small retailers’ survival (D1).
One of the key points (to help small retailers) is credit (M6).
Flexibility: As discussed before, small manufacturers usually have a source of competitive
advantage as they are more flexible, in the payment conditions as well as in their delinquency
management, as it can be observed in the statements below (that were already explored):
I receive third party checks. When there is not much merchandise, they
(retailers) pay in cash. They pay on my ‘fortnight voucher’. They pay the old
voucher and I note down the new one (SM1).
Sometimes they (local companies) have better commercial conditions, because
they give extra time to pay (M5).
When you see that the client is going through a difficult period you have to
understand. When the client is a trickster then you have to stop (delivering)
(SM4).
Furthermore, large companies are less flexible and have rigid commercial policies that
don’t accept delays in payment.
207
MNCs are much more rigorous with credit when they serve directly small retail
(M4).
Avoid channel conflict: One of the main objectives of good commercial policies is to
avoid channel conflict, allowing similar conditions for all the channel members to be competitive.
For the wholesaler I give 5% discount. For the distributor I give 15% discount
and he has to work with my entire portfolio (M4).
I give them (distributors) commercial conditions, so that they can compensate
their incremental costs and be competitive (M1).
However, this doesn’t mean that there isn’t channel conflict, as is shown in the statements
below:
The channel conflict cannot be avoided. We would like to avoid it, but price
decisions depend on the channel members. So we receive phone calls from
dealers complaining about competitors’ prices, but we cannot do anything. It is
free competition (M1).
In Carrefour, condensed milk is R$ 1.75; whereas we sell it for R$ 1.95 (D2).
Although, commercial policies are very relevant, according to interviewed executives,
there isn’t a huge difference between commercial policies practiced by large manufacturers for
high income and BoP markets.
We don’t work with two or three price tables. It is a single price policy for one
region (…) What changes is the product mix from a Santa Luzia (premium
grocery store) and Nagumo (low income grocery store) (M8).
UNDERSTANDING EXECUTION:
There are many properties that define a marketing channel operation and therefore
execution: channel design, logistics, sales structure, cost structure and commercial policies. In
order to map, in a preliminary analysis, the companies studied in this research, two of those
properties were considered as more relevant: logistics and cost structure.
208
Channel design was not contemplated because it was considered correlated with logistics.
In order to have a fast, efficient and prompt delivery, companies need to have a proper channel
design. Moreover, it was very difficult to analyze the sales structure performance of the
manufacturers and their distributors and because of that this property was not used. Commercial
policies were not used because, although important, had fewer comments in the interviews than
logistics and cost structure, which were chosen in this analysis.
Therefore, the figure below presents the interrelation of execution chosen properties:
Logistics
Logistics and Cost Structure, identifying their dimensions.
Potential Execution
Weak Execution
Well-Done Execution
Latent Execution
Low Cost
Structure
Figure 6-7: Properties and dimensions of execution.
Source: Elaborated by the author
Well-Done Execution: Defined by a good cost structure and efficient logistics.
Companies in this quadrant are characterized by a lean structure that are flexible, fast and
customer oriented. Small and local companies fit this quadrant.
We have this capillarity of being in the entire country (M9).
Latent Execution: Characterized by a small and cheap structure, but that still is not able
to have a good logistics. Really small companies might be positioned in that quadrant. Although
209
in the companies’ analysis, all the small manufacturers were considered together, there is one
case of a small company interviewed that might be placed in that position.
I buy the product, clean it, package and also deliver. I do everything alone
(SM1).
Potential Execution: Characterized by a good logistics, but with a high cost. MNCs and
large companies investing a lot in distribution might be in this position. However, it appears to be
a transitory position.
Weak execution: In this case, nor the cost neither the logistics are adequate for BoP.
Execution in these cases are not appropriate for BoP.
The figure and table below present how the interviewed companies can be evaluated in
relation to their distribution execution. Reminding again that this was a preliminary evaluation
with the attempt to operationalize the major category “execution”. This evaluation was made
based on the speeches of the executives. This view might be biased and because of that it is more
illustrative than definitive. In the case of execution, that point is more relevant, since the
measures of this resource needed an in-depth analysis of a companies’ cost structure.
Nevertheless, the interview analysis allowed developing an approximate evaluation. Again, in
this analysis, the small companies were considered together, as it wasn’t possible to differentiate
their distribution execution.
210
Logistics
M5
Potential Execution
M1/M
3/M6
M4
M7
M9
M2
M8/
M10
SMs
Well-Done Execution
Latent Execution
Weak Execution
Low Cost
Structure
Figure 6-8: Evaluation of execution of interviewed companies
Source: Elaborated by the author
211
Table 6.2: Evaluation of efficient execution of interviewed companies
Company
Logistics
Cost Structure
M1
“I need to have a quality distribution (…) I need to
have dedicated people to my brands, selling my
products I can’t let the store buy whatever it wants”
***
“We go (through distributors) in regions that are very
difficult to reach”
*****
“We have this orientation just now of gaining more
numeric distribution”.
***
“For small retailers we didn’t have a very clear and
well-defined delivery model”
“Indirect distribution (that reaches small retailers)
represents 18% of sales”
*
“The service level we consider the best for each
point of sale is determined by the structure of the
business”. (This analysis is based on a segmentation
made by the company).
*****
“There are some regions that we are stronger and
others that we don’t have the same strength because
of the human factor”.
***
“I am still very concentrated in large and medium
retailers”
**
“It is very hard to reach the
300 thousand points of sale
with an attractive cost”
***
Has a lean structure
*****
M2
M3
M4
M5
M6
M7
M8
M9
M10
SMs
“We have a very focused work in our distribution”
****
“We have this capillarity of being in the entire
country”.
*****
“[As distributors are an extension of our business], it
is easier to manage and to make them implement the
initiative of the company in the point of sale”.
****
“I know this region very well. I know everything”.
“The only company in my category that has logistics
in my region is mine”.
****
Well
done
Executi
on1
***
*****
It has a heavy structure
***
***
It has a heavy structure and
low margin in BoP
**
*
It has a heavy structure
***
****
It has a heavy structure
***
***
“I have 2500 employees. In
order to pay this structure I
need an equivalent margin”
**
It has a simple structure
****
High cost structure but with
a good margin
****
It has a simple structure
****
**
Good cost structure
*****
Source: Elaborated by the author
1
The number of ‘stars’ indicates a higher level of well-done execution.
****
****
****
****
212
The next chart aims, in a preliminary attempt, at relating the level of well-done execution
between the companies analyzed with a satisfactory distribution, suggesting a positive relation
between the two variables.
Satisfactory
Distribution
SMs
M6
M5/
M9
M8/
M10
M7
M2
M1/
M3
M4
Well-done Execution
Figure 6-9: Well done execution as a condition associated to satisfactory distribution.
Source: Elaborated by the author
6.4
Relationship
In all the interviews, relationship appeared as an extremely important variable for
companies willing to operate at BoP.
Interviewer: What do you think is your company’s differential?
Executive: Relationship.
Interviewer: Relationship with…
Executive: The word relationship, the concept of relationship is everywhere.
This is a differentiation (M9).
The above excerpt shows exactly the importance of relationship. A good relationship is
crucial in managing the channel. Nevertheless, it could be argued that relationship is important
for every market; high income as well as low income. Indeed, literature about marketing channels
extensively discusses the importance of relationship in the supply chain. The point here is that
213
BoP markets demand, by its characteristics, a different level of competences from manufacturers
and their distributors in the relationship.
Relationship is a basic value in BoP markets. Consumers desire a good relationship from
retailers that in their turn want a good service with quality and regularity from the distributor,
which demands a trusty relationship from the manufacturer.
The figure below presents some statements of manufacturers, distributors and retailers,
indicating the importance of relationship in the entire marketing channel. Two points that draws
attention are: the relevance given to valorization and to friendship, which suggests a more
personal relationship at BoP. Those two elements are highlighted on the statements below in
bold and italics.
MANUFACTURER
DISTRIBUTOR
This is a success criterion: you can’t
identify who is from our company
and who is from the distributor. The
language is the same, the analyses
are the same, and the intelligence is
the same (M1)
[A good supplier] understands the role
of the distributor; what he can execute.
He valorizes that and has adequate
commercial policies for the distributor
(D1).
He [Retailer] stays with me because of
the relationship (D3).
When you ask the small retailer
who serves you better, he will
answer that firstly is the friendship
with the salesperson. Secondly, it
is the delivery. Sometimes we can
understand delivery as punctuality
and in other cases delivery of
products in good conditions […].
Lastly, there are the financial
conditions (M5).
In small retail of the outskirts,
relationship is friendlier and
because of that this small retailer
tend to be more loyal (SM2).
In low income neighborhoods, the
relationship is more important. In the
higher income areas, it is less friendly
and more commercial. In the outskirts,
relationship is friendlier. Sometimes, I
even sell with more expensive prices,
owing to the relationship. In the
outskirts, people are more humble (D6).
RETAILER
Interviewer: What makes one
company to be a better partner
than another?
Executive: Relationship. To
talk (R2).
Interviewer: For the industry
to make a good job, what is
essential?
Executive: I believe that it is
to have a partnership. The
product they already have,
price is with them; they need
to be partners. Partnership in
the sense of serving; to be
always here with us (R1).
Figure 6-10: Executives’ perceptions about relationship in the marketing channel.
Source: Elaborated by the author
214
Relationship was mentioned by almost all interviewed executives as an important
ingredient to create a satisfactory distribution in the marketing channel. Two main properties of
the major category relationship are “partnership” and “relationship”, as presented in the figure
Partnership
below:
Potential Relationship
Strong Relationship
Weak Relationship
Latent Relationship
Relationship
Figure 6-11: Properties and dimensions of relationship
Source: Elaborated by the author
Strong Relationship: A strong relationship and partnership indicates the existence of the
strategic alliances in which both parties commit resources and which serves clear strategic
purposes for both. Characterized by companies that invest a lot in the marketing channel and that
create trust and commitment along the channel.
Relationship with distributors is very transparent and participative (M8).
They sell, distribute, and participate in a very integrated way with our strategic
definition (M5).
Latent Relationship: Characterized by manufacturers which have a good relationship,
but still couldn’t build an interdependence of the channel members. For instance, companies that
215
have a good sales structure and create an FLE trust but don’t have commercial policies that are
able to define an MPP trust might be placed in this quadrant.
[I have a good relationship] with this salesperson, because the rest from the same
company I have already called and no one helped me (R2).
Potential Relationship: Characterized by strategic alliances, but that still need to turn
into close relationships. For instance, manufacturers might use their coercive power in order to
create a partnership, but struggle with the other members to have a transparent and trusty
relationship.
It is very good to sell those brands with more market expression and that are
well accepted in the market. The volume comes easier. But there is also the other
side of the coin: The sales targets are much higher […] it generates more
conflicts because it’s more complex (D5).
Weak Relationship: Neither partnership nor relationship is perceived in this case.
Companies, in this quadrant, are distant from the marketing channel and have difficulties to reach
BoP population.
The table and figure below present how the interviewed companies can be evaluated in
relation to their relationship in the marketing channel. Reminding again that this evaluation was
made based on the speeches of the executives. This view might be biased and because of that is
more illustrative than definitive. Again, in this table, the small companies were considered
together, as it wasn’t possible to differentiate their relationship in the marketing channel.
216
Partnership
M5/M
9/M10
/SMs
M1/M
3/M6/
M7
Strong Relationship
M2/
M8
Potential Relationship
M4
Latent Relationship
Weak Relationship
Relationship
Figure 6-12: Evaluation of relationship of interviewed companies
Source: Elaborated by the author
217
Table 6.3: Evaluation of relationship of interviewed companies
Compa
ny
Partnership
Relationship
M1
“You can’t identify who is from our
company and who is from the distributor.
The language is the same, the analyses are
the same, and the intelligence is the
same”; but wholesalers, with a
transactional relationship, still represent
half of the indirect sales.
****
M2
Sells only directly and through
distributors.
****
Have a good commercial
relationship
“The important is the
relationship between the
manufacturer and distributor; the
distributor understands the
needs of the manufacturer and
work for them to happen and the
manufacturer works the needs of
the distributor”
***
“On average I have 20 years of
relationship with distributors”
*****
M3
Sells only through distributors.
****
M4
“35% of our indirect sales are made
through distributors, the rest are
wholesalers”.
**
“They sell, distribute, and participate in a
very integrated way with our strategic
definition”.
*****
Works with wholesalers and distributors.
****
M5
M6
M7
“In the Northeast, for instance, we have
many clients that are distributors and were
wholesalers before”.
Diminishing importance of wholesalers so
as to have a higher level of partnership.
****
M8
Works only with distributors.
****
Relationship
in the
Marketing
Channel1
***
****
“Interviewer: How is your
relationship with distributors?
Executive: It is tense, because
the margins are low”.
***
Do not have a close relationship
in the marketing channel
**
***
Has a great relationship in the
marketing channel.
*****
*****
“What we do the most is conflict
management”.
***
“It doesn’t mean I can’t have the
same relationship [with the
marketing channel], but as I
have fewer people, the
probability is that is more
distant”.
***
“Relationship with distributors
is very transparent and
participative”.
*****
***
**
***
****
(continue)
218
Compa
ny
Partnership
Relationship
M9
Close relationship with the marketing
channel.
*****
M10
“They (distributors) are an extension of
the company”.
Works only with distributors.
*****
When you perceive that there is a trend of
declining prices, you warn your client.
You don’t let him buying a lot; otherwise
there will be a problem
*****
Interviewer: “What do you think
is the differential of the
company?” Executive:
“Relationship”.
*****
“In average I have 20 tears of
relationship with my
distributors”
*****
“We go to the market and visit
our clients, drink a coffee with
them”.
*****
SMs
Relationship
in the
Marketing
Channel1
*****
*****
*****
Source: Elaborated by the author
1
The number of ‘stars’ indicate a higher degree of relationship.
Next chart aims at relating the level of relationship of the interviewed companies in their
marketing channel with a satisfactory distribution, suggesting a positive relation between the two
variables.
Satisfactory
Distribution
SMs
M5/
M9
M6
M2/
M8
M10
M1/M
7/M3
M4
Relationship
Figure 6-13: Relationship as a condition associated to satisfactory distribution.
Source: Elaborated by the author
219
6.5
Proposition of substantive theory for BoP Distribution
Based on the above discussion, it was conceptualized the major categories that define a
satisfactory distribution to BoP markets: Willingness to operate at BoP, a well done distribution
execution and the development of close relationships are positively related to a satisfactory
access to BoP markets. From that, the following propositions are posited:
P1: Willingness to operate at BoP markets is associated with satisfactory
distribution to BoP markets.
P2: Well-done execution is associated with satisfactory distribution to BoP
markets.
P3: Level of relationship with other members of the marketing is associated
with satisfactory distribution to BoP markets.
The figure below shows these propositions and the relationship among the categories.
Willingness
Distribution
Execution
Satisfactory
Distribution to BoP
Relationship
Figure 6-14: Proposed Model to have a satisfactory distribution to BoP market
Source: Elaborated by the author
The elements proposed by Whetten (1989) that define a complete theory could be verified
in this model:
1. What: The factors that explain the phenomena are: willingness, execution and
relationship. These factors are comprehensive to explain the phenomena in the
substantive area analyzed and all them add value to the model.
2.
How: The proposed model identifies the relationship between the antecedents and
satisfactory distribution, as well as, between two of those antecedents.
220
3. Why: The reasons of the interrelationships of the factors were described in chapters 5
and 6, but could be summarized as: As BoP markets have some peculiarities and
difficulties to be reached, companies need to be willing to adapt their strategy and
internalize the concept of BoP so as to define proper strategies. However it is not
sufficient to define good strategies. The execution is an important node to satisfactory
reach an environment full of obstacles. Moreover, relationship has a central role in
defining satisfactory distribution, since BoP is a market characterized by a lack of
professionalization and by the importance given to face to face contact and friendlier
relationship.
4. Who, Where and When: As defined by the grounded theory methodology, this model
is valid only in the substantive area of study. Therefore, results can’t be generalized or
considered definitive for all the companies operating at BoP.
Next table comprises the evaluations made for each manufacturer in each major category,
in order to present how these major categories are associated to a satisfactory distribution. Again,
this is just a preliminary analysis that aims to show a possible operationalization of the proposed
model.
221
Table 6.4: Evaluation of major categories associated to a satisfactory distribution1
Company
Willingness
Efficient Execution
SMs
M5
M6
M9
M2
M8
M10
M1
M3
M7
M4
*****
***
*****
***
****
***
***
***
**
***
*
****
****
***
****
*****
****
****
***
***
**
*
Relationship in the
Marketing Channel
*****
*****
***
*****
****
****
*****
***
***
***
**
Satisfactory
Distribution
*****
****
****
****
***
***
***
**
**
**
*
Source: Elaborated by the author
1
The number of ‘stars’ indicates a higher degree of each major category.
From this very preliminary exercise, the data presented in the above table is consistent
with the propositions presented previously. Two extreme points stand out: M4 is perceived as
having the less satisfactory distribution and has the lowest levels of willingness, execution and
relationship. On the other hand, SMs (small manufacturers) present the most satisfactory
distribution and receives the highest levels on the three major categories.
The proposed model seems appropriate also when analyzing worldwide distribution
models discussed in section 2.3.6. In that analysis it was suggested that the main key success
factors of those cases were partnership, execution and relationship with dealers and community.
Nevertheless, worldwide cases analyzed indicate a proposition with a higher level of
social embeddedness than those analyzed in the research with executives. This might show a
challenge and opportunity for manufacturers to create a closer relationship with the community
and consequently have a better access to BoP hearts’.
222
7
CONCLUSIONS AND FINAL CONSIDERATIONS
7.1
Introduction
This chapter aims at presenting the conclusions of this thesis and some final
considerations related to its theoretical and managerial implications, limitations and possible
future researches.
7.2
Conclusions
The main objective of this research is to identify, in the perception of executives working
in the market, the conditions associated to a satisfactory distribution for the BoP market in Brazil
and to build a substantive theory that helps to shed light to the understanding of the phenomenon
of consumer goods distribution for the BoP market in Brazil.
In order to achieve this objective, two main conceptual frameworks were analyzed in the
knowledge review: (a) the concepts and challenges to reach BoP markets; and (b) the concepts
related to marketing channels. As the research and knowledge review evolved, a third relevant set
of concepts associated to strategy were studied.
The knowledge about BoP markets showed a clear evolution: reflecting the different
perspectives the business literature has about low income markets. From a discussion, that has
lasted over 50 years, of the reasons for low income people paying more for the same products, the
debate evolved to highlight the potential of BoP and suggest strategies that fit this market. More
recently several business models appeared as a possibility to serve the market.
Ever since the 1940s, there has been the discussion about the poverty penalty. Although
not recent, this thesis showed that the inefficiencies and institutional voids in distributions still
contribute to this poverty penalty. Owing to that, companies that have a well-done execution
might differentiate themselves in the market.
The institutional voids of BoP market, such as low level of professionalization,
informality, unsafe routes, capillarity, distance and lack of infrastructure turns the execution into
223
a central point in distribution. Whether execution is important for any market, the research
suggests that it has a higher level of complexity and demand in BoP market, since it is a market
full of difficulties and also because consumers need to access affordable goods. As a consequence
the cost structure analysis becomes more challenging.
Moreover, the constant comparison analysis made during the research introduced two other
major elements to satisfactorily reach BoP: a) strategy alignment, which suggests that due to its
difficulties and peculiarities a successful strategy to reach BoP is much more than some punctual
adaptations, but is indeed a call for a change in the mindset of corporation’s employees; and b)
the relevance of relationship, that ended up as a major category in the proposed model.
Companies with a BoP DNA, that understand the peculiarities of the market and have an
aligned strategy have a higher propensity to have a strong willingness to operate at BoP and
consequently to create a satisfactory distribution strategy.
Moreover, as this market is characterized by low level of professionalization and still with
a high degree of informality, it became clear that relationship, although important in any market,
seems to have a higher degree of relevance at BoP. Relationship was perceived to be friendlier in
BoP markets and essential, since it is very difficult for manufacturers to reach the entire market
alone. It is more likely to have a satisfactory distribution when manufacturers establish strong
relationships in the marketing channel. Besides, small retailers have a perception of isolation and
expect a higher level of relationship.
From the above analysis, it was possible to determine that willingness; execution and
relationship are relevant conditions associated to a satisfactory distribution for the BoP market in
Brazil. Moreover, the coding process of the interviews proposed in the Grounded Theory
Methodology, allowed the identification of the main properties and dimensions of each of those
categories.
Additionally, the research helped to identify how the distribution strategies of small local
companies make them fierce competitors of MNCs and large companies. Indeed, that was a
recurrent complaint of large manufacturers who believe that small manufacturers have many
competitive advantages as lower prices, good distribution (as they operate in a small region),
strong brand image in the local region, better relationship and better credit offer. Again, the three
categories that explain a satisfactory distribution appear:
224
•
Willingness: Even though, the strategy might be an emergent one and small
companies have fewer options, they know the BoP market very well and are
committed with it.
•
Execution: These small companies have more flexibility, are more agile and
operate in a small region, which give them the opportunity to have a lower cost
and a good distribution.
•
Relationship: Although small manufacturers, in their majority, don’t use
distributors, they have valuable ties with retailers and create close relationships
with them. Moreover, they are embedded in their community, which allows for a
better relationship with consumers and even building strong local brands.
Furthermore, it was possible to integrate the existing knowledge about distribution with
the empirical findings from the research with manufacturers and distributors who serve the
Brazilian BoP market. The literature review about Marketing Channels was based upon the
concepts of channel structure. As discussed by Jaffe and Yi (2007), it is hypothesized that in
developing economies there is a first step of lengthening the marketing channel and afterwards it
shortens as a result of efficiencies. The research indicated that in Brazil both paths can be
perceived:
•
In the first one, there is a situation in which companies look for sub distributors or
small wholesalers to reach scattered and/or unsafe places, which implies in a
lengthening of the channel.
•
In the second one, companies are concentrating their sales in fewer partners, mainly
distributors so as to have more control of the channel. In this case there is a
shortening trend, indicating a more mature market, based on tighter partnerships.
These two directions suggest that the Brazilian market has still the two facets of channel
development. It makes sense, since, there are in the country, areas with different levels of
development, typical of an emerging economy.
Global innovations in distribution for BoP markets were also mapped, identifying some
common aspects as well as success factors they presented. Some important points that appear in
those cases are the relevance of innovations, partnerships, knowledge of BoP market and a good
execution. The main points are to achieve trust of partners and of the community and
225
accessibility. These aspects helped to consolidate the findings of the research and to build the
proposed model.
Another objective of this thesis was to describe distribution strategies that companies use
in Brazil to distribute their products to BoP markets. It could be noticed slight differences in
defining distribution strategies for BoP that implies in a distinct channel design. For instance, the
relevance of small retailers and the scattered configuration of the market sometimes force
companies to have a multi channel approach, working with different channel levels according to
the situation. In this point, there is a huge competition between large and small manufacturers.
The first ones usually work with distributors and sub distributors to reach difficult places, while
the second might use a direct distribution owing to its proximity. Furthermore, even those
“structured” channels are not able to reach some places in the magnitude companies would like.
In this case, some companies, as Nestlé and Danone, operate also a door-to-door channel.
Finally, the research allowed identifying whether the ingredients proposed by BoP
business models are used by companies to distribute products in Brazil. Actually, the BoP
business models propose a more embedded approach with different partners. Furthermore,
innovation has a central role in the dynamics of the companies. If, on one hand, those elements
couldn’t be thoroughly found in the research, on the other hand, some movements from
companies that are more enthusiastic of BoP suggest that partnership, social inclusion,
environmental sustainability and innovation might become a source of competitive advantage in
the near future.
7.3
Theoretical Implications
This work presents three major theoretical implications:
a) Linking the substantive theory and Marketing Channel literature
This section aims at linking the proposed model with the marketing channel literature
analyzed in this work. Two major issues were discussed in the knowledge review: Channel
structure and relationships.
One first issue was channel structure. When designing a marketing channel, two main
decisions have to be made: the first determines the number of levels between the supplier and the
226
consumer and the second determines, for a given number of levels, the intensity of the selected
structure (for example, number of intermediaries) and policies regarding channel management,
such as trade discounts (RANGAN; JAIKUMAR, 1991).
Although these two decisions are not different in BoP markets, the contextual conditions
demand a distinct set of strategies. For instance, BoP markets, usually, require a larger number of
levels and sometimes the development of new intermediaries as it was the case of the minidistributors that just make sense in scattered, difficult to reach and/or unsafe places.
This point suggests also that the cost of serving BoP markets is higher which strengthens
the relevance of a well-done execution in order to reach the entire market and to be competitive.
This difficulty to reach these places seems also the basis for the small manufacturers’ competitive
advantage, indicating the importance of distribution in BoP markets.
Moreover, the cost of serving BoP markets suggests the relevance of further studying
transaction costs. Diminishing these costs might have an important positive impact on reducing
the poverty penalty.
The second issue discussed in the knowledge review was relationship. Relationship
marketing focuses attention on how to develop and maintain long-term, highly integrated
relationships between customers and their suppliers (DWYER et al, 1987; RYLANDER et al,
1997).
The interviews suggest that relationship has an important role and maybe even more
important in BoP markets. Most of the executives agreed that in low income markets relationship
is friendlier, depending on salespeople. This is also a market characterized by the need of a
higher level of support. Moreover, relationship confirmed to be a strong element in distribution in
the entire marketing channel, since it was mentioned as relevant by manufacturers, distributors,
specialists and retailers.
Summing up, the research suggests that there are some contextual conditions in BoP
markets, such as lack of infrastructure, safety concerns and distant places to reach that create
some obstacles and demand a different strategy definition and implementation.
227
b) Linking the substantive theory and the BoP literature
As analyzed in section 2.2.9, in BoP business literature, it was possible to identify four
business models: incremental innovations, partnerships with NGOs, co-creation with
communities and social businesses.
Each business model complements the other and there is not the more advanced business
model or the best one. Although these business models are still in their early lifecycle stages,
their new paradigms begin to offer inspiration to the business community and some of their
proposed ingredients, business values and ideas are beginning to be incorporated by companies
servicing the BoP. Within this perspective, companies should (re)define marketing strategies and
perspectives for emerging markets in order to serve all the stakeholders and offer a value
proposition that creates a win (corporation) – win (customers) – win (society) situation. For
instance, from the analysis of the literature and from the worldwide cases studied, partnership
with local companies, NGOs and even communities are being more accepted over the idea of a
solo approach.
Analyzing the substantive theory created, it is possible to notice that the concept of
partnership also appears very strongly. Although, these partnerships are still, in their majority,
restricted to the marketing channel, some companies have already started to have some initiatives
of partnerships with NGOs (for instance, Coca Cola in partnership with the NGO CDI) or even
with the community (for instance the case of the Activia Day from Danone).
These initiatives allow to foresee that maybe the distribution strategies for BoP will
consider those partnerships in order to reach the low income population in a win-win situation,
where companies gain access to a market that they have difficulty to penetrate and on the other
hand, the population might have an extra income as well as get access to different products.
This approach takes the companies to a distinctive strategy for BoP that tries to link the
apparent disconnected concepts of social embeddedness and intensive distribution. The first one
prioritizes deep relationships and connections with the communities and the latter one promotes
the viewpoint of accessing the largest number of possible communities. To combine these two
concepts appears as one great challenge for companies that seek the fortune at the base of the
pyramid.
228
c) Other conceptual discussions
This research shed light to a phenomenon which needs further investigations. Although
being an explorative study, a substantive theory was built that can be turned into a formal theory,
using a more conclusive research. Moreover, the proposed model gathers three different
management fields.
The first one is associated to marketing channels, in which two main set of concepts had a
main role in this thesis. Understanding marketing channel structures was important to define the
levels and complexity of the distribution model for BoP and also the concept of relationship,
which has a great impact on defining a satisfactory distribution.
The second management field was strategy, mainly the RBV approach, since different
resources and competences conduce to different results. That was relevant in defining the
willingness of a company to operate at BoP as well as in establishing a good execution of the
delineated strategy.
Finally, previous researches in BoP arena helped to understand some peculiarities of low
income markets, such as the relevance of a good execution owing to the institutional voids, the
importance of partnerships and relationships and the need to deeply engage in a different
perspective when defining strategies for BoP.
Therefore, an important contribution of this study was to develop a conceptual model in a
knowledge field which is still in its infancy, incorporating different set of concepts.
Moreover, there is another conceptual discussion regarding the methodology chosen.
Owing to the lack of previous studies in the theme and the complexity of the phenomena under
study, grounded theory emerged as the most appropriate methodology to be used. However, as
discussed before, Grounded Theory just started to be considered in marketing research more
recently. Therefore, examples of the employment of this methodology for marketing are limited
and its application is almost restrict to consumer behavior despite of its potential for theoretical
developments for other marketing phenomenon (GOULDING, 2005). Hence, the steps and
methods applied in this research may shed light to new marketing studies aiming at building a
substantive theory from a complex and still unexplored phenomena.
229
7.4
Managerial Implications
This thesis presents several managerial implications, from which it is highlighted:
1- Distribution strategies for BoP have many peculiarities. Institutional voids and the
complexity of the market imply in the necessity of a higher degree of involvement to understand
and operate in the market. Hence, BoP employees from companies willing to operate at BoP
should understand the difficulties this market imposes. It is suggested BoP to be in the DNA of
the company, with an important role in the company’s strategy. One possibility, used by some
companies, is to create a business unit of BoP, with the challenge to spread inside the company
the advantages and difficulties of operating at BoP.
2- Developing partnerships might be an important source of competitive advantage. These
partnerships are not restricted to distributors. Companies could look for partnerships with NGOs,
other companies or even with the community. Besides, creating new marketing channels, these
partnerships can help to build the brand and create more relevance to the consumers.
3- Execution of the distribution strategy and logistics play an important role and
partnerships again might be a good exit to accomplish an efficient and prompt delivery.
4- The research suggests that sales structure has an important role to execute the
distribution strategy and to develop trust in the marketing channel. Therefore, it seems relevant to
plan the sales structure in a certain way to hire people that can dialogue with the customers. In
other words, salespeople should be from the region and talk the same language as
distributors/retailers. Consequently, the definition of the profile of the sellers should include the
potential for creating a trusty relationship.
5- The cost structure is a bottleneck. The findings suggest that the structure should be
planned in such a way that it is able to transpose the barriers and voids of the market and
simultaneously to offer flexibility, agility and affordable prices.
6- Due to the abovementioned factors, innovation might be a differential. Thinking out of
the box and developing new effective and efficient solutions is a great challenge and to
accomplish that, it is important to have a structure or a thought oriented to BoP.
230
7.5
Limitations
This study has several limitations, due to its scope and methodology.
Limitations due to methodology:
Since it is an exploratory study, it is not possible to extrapolate its findings to all the BoP
market. Furthermore, as the research was based on interviews with one or two executives of each
company, it has a bias of their opinion, or even, of their statements of reality that are not always
an actual picture of the phenomena.
Besides, as the author didn’t have access to financial results of the company, it was
difficult to differentiate successful initiatives from the others.
Limitations due to scope:
Mainly when analyzing small companies, most of the interlocutors were from low income
markets and the language used in the interview had to be adapted so as to be clearly understood.
Moreover, the owners of these companies, in a typical low income behavior, were cautious
during the interview with a clear mistrust about the use of the research. Hence, data were not easy
to obtain under these circumstances. In those small companies, it was also difficult to get
secondary data, as most of them didn’t even have a website of the company.
Although the analysis of the results suggested that the sample was adequate and new
findings were diminishing with new interviews, the number of companies operating at BoP in
Brazil is huge and, most importantly, they are scattered over the country. An analysis of regional
differences might have aggregated new information to the study.
7.6
Future researches
Future researches could develop a general theory based on the substantive theory
proposed in this thesis. “The development of a general theory involves taking the research into a
variety of contexts, ensuring full theoretical sampling and the production of a theory that has
applications to other settings and populations” (GOULDING, 2005, p. 298). Moreover, it could
231
be evaluated the existing relationship between the major categories. For instance, if and how a
well-done execution interferes in relationship and vice-versa.
Future researches could also develop some comparative studies among emerging markets,
with the objective of creating a matrix of channel marketing structure according to the
development level of the country. Moreover, different product categories could bring new
findings.
Other insights for new researches would be to analyze and study the survival of the small
entrepreneur. Although small companies have many competitive advantages, some interviewed
executives from those enterprises complained that MNCs and large companies are advancing in
BoP market. It makes sense, since with their resources, acquired knowledge and willingness to
enter the market, large companies start to learn how to operate in BoP market and are improving
their performance. That can be observed initially with large retailers, such as Walmart (with Todo
Dia), Carrefour (with Dia%) and Grupo Pão de Açúcar (with Comprebem). Besides the fact that
those large retailers might take sales from small retailers, they also, usually, sell products from
large manufacturers and not from the locals. Consequently, the expansion of those retailers might
have an impact on the small retailers, as well as, on the small manufacturers that have a great
difficulty to sell to large companies because they don’t meet the requirements of these global
retailers.
Therefore, a possible future research would be to understand the impact of the
improvement of managerial practices of large companies on the performance of small ones, with
the purpose to identify ways of protecting the survival of small businesses in Brazil.
Another future possibility would be to evaluate the transaction costs of the marketing
channel in a BoP market. As discussed before, BoP demands a competent execution and cost
structure. Studying the transaction costs of channel members might shed new lights as regards the
possibilities for companies to be more competitive. Moreover, transaction costs could shed light
on an important property of channel execution, which is the cost of serving.
Finally, as observed in the elements of a business model for BoP, consumption inclusion
goes head to head with production inclusion. In other words, more than just offering access to
new products, the BoP proposition should allow an increase in the population income. As
distribution is labor intensive, it is a great opportunity to include the population socially. Hence,
232
one possibility is to study how the BoP structure could join forces with the sustainability
structure inside a company, creating initiatives that simultaneously give access to products and
income.
233
8
REFERENCES
AFUAH, Allan. Business Models: A strategic management approach. New York: Mc Graw-Hill,
415 pages, 2004.
AGUIAR, Luciana; TORRES, Haroldo da Gama; MEIRELLES, Renato. O Consumidor de Baixa
Renda. In: PARENTE, Juracy; LIMEIRA, Tania; BARKI, Edgard. Varejo para baixa renda.
Porto Alegre: Bookman, 197 pages. 2008. p. 13-32.
AILAWADI, Kusum L. The retail power-performance conundrum: What have we learned?
Journal of Retailing, Vol. 77 Issue 3, p299- 218, Fall2001.
ALCALY, Roger E.; KLEVORICK, Alvin K. Food prices in relation to income levels in New
York City. Journal of Business, Vol. 44 Issue 4, p380-397, Oct71.
ALDERSON, Wroe; MARTIN, Miles W. Toward a Formal Theory of Transactions and
Transvections. Journal of Marketing Research JMR, Vol. 2 Issue 2, p117-127, May65.
ALWITT, Linda F. Marketing and the Poor. Advances in Consumer Research, Vol. 22 Issue 1,
p366-366, 1995.
ALWITT, Linda F.; DONLEY, Thomas D. Retail stores in poor urban neighborhoods. Journal of
Consumer Affairs. Vol. 31 Issue 1, p139-164, Summer97.
ANDERSON, Erin; WEITZ, Barton. Determinants of continuity in conventional industrial
channel dyads. Marketing Science, Vol. 8 Issue 4, p310-324, Fall89.
___________. The use of pledges to build and sustain commitment in Distribution Channels.
Journal of Marketing Research, 29, p. 18-34, 1992.
ANDERSON, Erin; DAY, George S.;RANGAN, V. Kasturi. Strategic Channel Design. Sloan
management review. p.59-69, summer 1997
ANDERSON, Jamie; MARKIDES, Costas. Strategic Innovation at the Base of the Pyramid. MIT
Sloan Management Review, Vol. 49 Issue 1, p83-88, Fall2007.
ANDREASEN, Alan R. The Ghetto Marketing Life Cycle: A Case of Underachievement.
Journal of Marketing Research (JMR), Vol. 15 Issue 1, p20-28, Feb78.
234
___________. Unethical Seller Practices: A Neglected Issue in Consumer Satisfaction and
Dissatisfaction Research. Advances in Consumer Research, Vol. 20 Issue 1, p109-111, 1993.
ARNOLD, David J.; QUELCH, John A. New Strategies in Emerging Markets. Sloan
Management Review, Vol. 40 Issue 1, p7-20, Fall98.
BAGOZZI, Richard P. Marketing as Exchange. Journal of Marketing, Vol. 39 Issue 4, p32-39,
Oct75.
BANDEIRA-DE-MELLO, Rodrigo; CUNHA, Cristiano José Castro de Almeida. Grounded
Theory. In: GODOI, Christiane Kleinubing, BANDEIRA-DE-MELLO, Rodrigo; SILVA,
Anielson. Pesquisa Qualitativa em estudos Organizacionais: Paradigmas, estratégias e Métodos.
Saraiva. São Paulo. 2006, p. 241-266.
BANDEIRA-DE-MELLO, Rodrigo. Softwares em pesquisa qualitativa. In: GODOI, Christiane
Kleinubing, BANDEIRA-DE-MELLO, Rodrigo; SILVA, Anielson. Pesquisa Qualitativa em
estudos Organizacionais: Paradigmas, estratégias e Métodos. Saraiva. São Paulo. 2006, p. 429460.
__________. Uma teoria substantiva da adaptação estratégica a ambientes turbulentos e com
forte influência governamental: O caso das pequenas construtoras de edificações. Tese de
doutorado em Engenharia de Produção. Universidade Federal de Santa Catarina. 2002.
BARKI, Edgard. Estratégias de empresas varejistas direcionadas para a baixa renda: um estudo
exploratório. 153 pages. Dissertação (Mestrado em Administração de Empresas) - Escola de
Administração de Empresas de São Paulo da Fundação Getulio Vargas – São Paulo, 2005.
BARR, Pamela S. Current and Potential Importance of Qualitative Methods in Strategy research.
In: KETCHEN Jr, David J.; BERGH, Donald D. Research Methodology in Strategy and
management Vol. 1. Oxford: Elesevier. 2004. p. 165-188.
BARNEY, Jay. Firm Resources and Sustained Competitive Advantage. Journal of Management,
Vol. 17 Issue 1, p99, Mar91.
__________. Resource-based theories of competitive advantage: A ten-year retrospective on the
resource-based view. Journal of Management, Vol. 27 Issue 6, p643-650, 2001.
235
BARR, Pamela S. Current and Potential Importance of Qualitative Methods. In KETCHEN,
David J.; BERGH, Don D. Research Methodology in Strategy and Management. UK: Elsevier;
p.165-188, 2004.
BERRY, Leonard. The Low Income Marketing System: An Overview. Journal of Retailing.
Volume 48, Number 2, p. 44-63. Summer 1972.
BIANCHI, Eliane Maria Pires Giavina; IKEDA, Ana Akemi. Usos e Aplicações da Grounded
Theory em Administração. Revista Gestão.Org . Vol. 6 – N. 2 – p. 231-248. 2008.
BOWER, Joseph L.; CHRISTENSEN, Clayton M. Disruptive Technologies: Catching the Wave.
Harvard Business Review, Vol. 73 Issue 1, p43-53, Jan/Feb95.
BROWN, James R.; LUSCH, Robert F.; NICHOLSON, Carolyn Y. Power and relationship
commitment: Their impact on marketing channel member performance. Journal of Retailing,
Vol. 71 Issue 4, p363, Winter95.
BROWNING, Larry D.; BEYER, Janice M.; SHETLER, Judy C. Building cooperation in a
competitive industry: sematech and the semiconductor industry. Academy of Management
Journal, Vol. 38 Issue 1, p113-151, Feb95.
BRYANT, Antony; CHARMAZ, Kathy. The Sage Handbook of Grounded Theory. London. Sage
Publications, p. 623 pages, 2007.
BRUGMANN, Jeb; PRAHALAD, C.K. Co-Creating Business’s: New Social Compact. Harvard
Business Review. p. 80-90. Feb 2007.
CAPLOVITZ, David. The Poor Pay More. New York: The Free Press, 1963.
________. The other side of the poverty problem. Challenge, Vol. 14 Issue 1, p12-15, Sep65.
CARLILE, Paul R.; CHRISTENSEN, Clayton M. The Cycles of Theory Building in
Management Research. Harvard Business School, 2005.
CARSON, David; GILMORE, Audrey; PERRY, Chad; GRONHAUG, Kjell. Qualitative
Marketing Research. London: SAGE, 2001.
236
CHARMAZ, K. Grounded Theory: objectivist and constructivist Methods. In: Handbook of
Qualitative Research. DENZIN, Norman K.; Lincoln, Yvonna S. Second Edition. London:
SAGE, 2000.
CHESBROUGH, Henry; AHERN, Shane; FINN, Megan; GUERRAZ, Stephane. Business
Models for Technology in the Developing World: the role of non-governmental organizations.
California Management Review, Vol. 48 Issue 3, p48-61, Spring2006.
CHRISTENSEN, C., CRAIG, T.; HART, S. The great disruption. Foreign Affairs Vol. 80 Issue 2
p.80–95. 2001.
CHRISTENSEN Clayton M.; BAUMANN Heiner; RUGGLES Rudy; and SADTLER Thomas
M. Disruptive innovation for Social Change. Harvard Business Review; p. 94-101, December
2006.
CLARK, F. E. Criteria of marketing efficiency. American Economic Review; Vol. 11, p214-220,
1921.
CONVERSE, P. D.; SPENCER, Charles. What housewives think of the supermarket? Journal of
Marketing, Part 1, Vol. 6 Issue 4, p371-374, Apr42.
D’ANDREA, Guillermo; LUNARDINI, Fernando. Dentro de la mente y Del bolsillo del
consumidor latinoamericano. Harvard Business Review America Latina. p.42-49. October 2005.
DAY, George S. Managing Market Relationships. Journal of the Academy of Marketing Science,
Vol. 28 Issue 1, p24, Winter2000.
________. A empresa orientada para o mercado: Compreender, atrair e manter clientes
valiosos. Bookman. Porto Alegre, 2001.
DAWAR, Niraj; CHATTOPADHYAY, Amitava. Rethinking Marketing Programs for Emerging
Markets. Long Range Planning, Vol. 35 Issue 5, p457-474, Oct2002.
DE SOTO, Hernando The Mystery of Capital: Why Capitalism Triumphs in the West and Fails
Everywhere Else. Basic Books, 275 pages, 2000.
DENZIN, N.K.; LINCOLN, Y.S. Handbook of Qualitative Research. London: Sage Publications.
2. ed. 1065 pages. 2000.
237
DURAND, Cynthia Venancio da Silva. Relacionamento entre fabricantes de bens de consumo e
distribuidores no mercado brasileiro. Dissertação (Mestrado em Administração de Empresas) Escola de Administração de Empresas de São Paulo da Fundação Getulio Vargas – São Paulo,
2003.
DWYER, F.; SCHURR, P. e OH, S. Developing Buyer-Seller Relationships. Journal of
Marketing, Vol. 51, Chicago, April, 1987.
EISENHARDT, Kathleen M. Building Theories from Case Study Research. Academy of
Management Review, Vol. 14 Issue 4, p532-550, Oct89.
EL-ANSARY, Adel; STERN, Louis W. Power Measurement in the Distribution Channel.
Journal of Marketing Research. Vol, IX, p.47-52. February 1972.
ELIAS, Steven. Fifty years of influence in the workplace: The evolution of the French and Raven
power taxonomy. Journal of Management History, Vol. 14 No. 3, pp. 267-283, 2008.
FLINT, Daniel J.; WOODRUFF, Robert B.; GARDIAL, Sarah Fisher. Exploring the
Phenomenon of Customers' Desired Value Change in a Business-to-Business Context. Journal of
Marketing, Vol. 66 Issue 4, p102-117, Oct2002.
FREDERICO, Elias. Avaliação dos antecedentes e das consequências da confiança nas relações
entre varejistas e fabricantes do mercado de vestuário. 259 pages. Tese (Doutorado em
Administração de Empresas) - Escola de Administração de Empresas de São Paulo da Fundação
Getulio Vargas – São Paulo, 2004.
FREITAS, Angilberto Sabino. A implementação do e-learning nas escolas de gestão: um modelo
integrado para o processo de alinhamento ambiental. Rio de Janeiro. 330p. Tese de Doutorado Departamento de Administração, Pontifícia Universidade Católica do Rio de Janeiro, 2009.
GASKI, John F. Interrelations Among a Channel Entity's Power Sources: Impact of the Exercise
of Reward and Coercion on Expert, Referent, and Legitimate Power Sources. Journal of
Marketing Research, Vol. XXIII, 62-77, February 1986.
GEIGER, Susi, TURLEY, Darach. Grounded theory in sales research: an investigation of
salespeople’s client relationships. Journal of Business & Industrial Marketing. Vol. 18, Issue: 6/7,
p. 580-594, 2003.
238
GLASER, Barney G,; STRAUSS, Anselm L. The Discovery of Grounded Theory: Strategies for
qualitative research. New York: Aldine de Gruyter, 271 pages. 1967.
GODOI, Christiane Kleinubing, BANDEIRA-DE-MELLO, Rodrigo; SILVA, Anielson. Pesquisa
Qualitativa em estudos Organizacionais: Paradigmas, estratégias e Métodos. Saraiva. São Paulo,
460 pages. 2006.
GOODMAN, Charles S. Do the Poor Pay More? Journal of Marketing; Vol. 32, p18-24, 1968.
GOODMAN, Lester E.; DION, Paul A. The Determinants of Commitment in the DistributorManufacturer Relationship. Industrial Marketing Management, Vol. 30 Issue 3, p287-300,
Apr2001.
GOULDING, C. Grounded theory: the missing methodology on the interpretivist agenda.
Qualitative Market Research: An International Journal, V.1, Issue 1, p. 50-57, 1998.
__________. Contemporary Museum Culture and Consumer Behaviour. Journal of Marketing
Management, Vol. 15 Issue 7, p647-671, Oct99.
__________. Grounded Theory Methodology and Consumer Behaviour, Procedures, Practice and
Pitfalls. Advances in Consumer Research, Vol. 27 Issue 1, p261-266, 2000.
__________. Grounded Theory: A Magical Formula or a Potential Nightmare. Marketing
Review, Vol. 2 Issue 1, p21-33, Autumn2001.
__________. Grounded Theory, ethnography and phenomenology: A comparative analysis of
three qualitative strategies for marketing. European Journal of Marketing, Vol. 39 Issue 3/4,
p294-308, 2005.
GOULDING, Christina; FOLLETT, John; SAREN, Michael; MACLAREN, Pauline. Process and
Meaning in 'Getting a Tattoo'. Advances in Consumer Research, Vol. 31 Issue 1, p279-284,
2004.
GRIFFITH, David A.; CHANDRA, Aruna; FEALEY, Tim. Strategically employing natural
channels in an emerging market. Thunderbird International Business Review, Vol. 47 Issue 3,
p287-311, , May/Jun2005.
239
GROVES, Gwyn; VALSAMAKIS, Vassilios. Supplier-Customer Relationships and Company
Performance. The International Journal of Logistics Management. Vol. 9, Number 2. P. 51-64.
1998.
GUNDLACH, Gregory T.; ACHROL, Ravi S.; MENTZER, John T. The structure of
commitment in exchange. Journal of Marketing, Vol. 59 Issue 1, p78, Jan95.
HALLIDAY, Sue Vaux. Which trust and when? Conceptualizing trust in business relationships
based on context and contingency. International Review of Retail, Distribution & Consumer
Research, Vol. 13 Issue 4, p1. October 2003.
HAMMOND, Allen L.; PRAHALAD, C. K. Selling to the poor. Foreign Policy, Issue 142, p3037, May/Jun2004.
HARRIS, Lloyd C.; GOODE, Mark M. H. The four levels of loyalty and the pivotal role of trust:
a study of online service dynamics. Journal of Retailing, Summer, Vol. 80 Issue 2, p139-158,
2004.
HART, Stuart. Capitalism at the Crossroads. Wharton School of Publishing, 2005.
________. Innovation, creative
Management. Sept-Oct. 2005b
destruction
and
sustainability.
Research
Technology
_________. The Great Convergence. In: Cornell Global Forum on Sustainable Enterprise: A call
to optimistic action. July 2008a.
__________. Foreword. In: KANDACHAR, Prabhu; HALME, Minna. Sustainability Challenges
and Solutions at the Base of the Pyramid: Business, Technology and the poor. Greenleaf
Publishing Limited. UK. 2008b.
HART, Stuart L.; CHRISTENSEN, Clayton M. The Great Leap. MIT Sloan Management
Review, Vol. 44 Issue 1, p51-56, Fall2002.
HART, Stuart L.; SHARMA, Sanjay. Engaging fringe stakeholders for competitive imagination.
Academy of Management Executive, Vol. 18 Issue 1, p7-18, Feb2004.
240
HEIDE, Jan B.; JOHN, George. Alliances in Industrial Purchasing: The Determinants of Joint
Action in Buyer- Supplier Relationships. Journal of Marketing Research (JMR, Vol. 27 Issue 1,
p24-36), Feb90.
HEIDE, Jan B.; MINER, Anne S. The shadow of the future: effects of anticipated interaction and
frequency of contact on buy-seller cooperation. Academy of Management Journal, Vol. 35 Issue
2, p265-291, Jun92.
HOSKISSON, Robert E.; EDEN, Lorraine; LAU, Chung Ming; WRIGHT, Mike. Strategy in
emerging economies. Academy of Management Journal, Vol. 43 Issue 3, p249-267, Jun2000.
HUDON, Marek. Should Access to Credit be a Right? Journal of Business Ethics, Vol. 84 Issue
1, p17-28, Jan2009.
HUNT, Shelby. General Theories and the fundamental explanada of marketing. Journal of
Marketing. Vol. 47, p. 9-17, Fall 1983.
HUNT, Shelby D.; NEVIN, John R. Power in a Channel of Distribution: Sources and
Consequences. Journal of Marketing Research (JMR), Vol. 11 Issue 2, p186-193, May74.
HYVÖNEN, Saara; TUOMINEN, Matti. Channel Collaboration, Market Orientation and
Performance Advantages: Discovering Developed and Emerging Markets. International Review
of Retail, Distribution & Consumer Research, Vol. 17 Issue 5, p423-445, Dec2007.
IKEDA, Ana Alemi; BACELLAR, Fatima C.T. Revelando e compreendendo o relacionamento
professor-aluno em marketing. Revista de Administração Mackenzie (RAM), Volume 9, n. 5, p.
137-154, 2008.
IMMELT Jeffrey R.; GOVINDARAJAN Vijay; TRIMBLE Chris. How GE is disrupting itself.
Harvard Business Review, p. 56-65, October 2009.
ISABELLA, Lynn A. Evolving interpretations as a change unfolds: how managers construe key
organizational events. Academy of Management Journal, Vol. 33 Issue 1, p7-41, Mar1990.
IZQUIERDO, Carmen Camarero; CARRIÓN, Carlos Hernández; GUTIÉRREZ, Sonia San
Martín. Developing relationships within the framework of local economic development in Spain.
Entrepreneurship & Regional Development, Vol. 20 Issue 1, p41-65, Jan2008.
241
JAFFE, Eugene Donald; YI, Ling. What are the drivers of channel length? Distribution reform in
The People's Republic of China. International Business Review, Vol. 16 Issue 4, p474-493,
Aug2007.
JAIN, Subhash C. Marketing Planning & Strategy. Thomson. Connecticut. 7ª ed. 2004.
JENKINS, Rhys. Globalization, Corporate Social Responsibility and poverty. International
Affairs. V.81, Issue 3, p. 525-540, 2005.
JOHNSON, Mark, CHRISTENSEN, Clayton, KAGERMANN, Henning Reinventing Your
Business Model. Harvard Business Review, December 2008.
KABADAYI Sertan; EYUBOGLU Nermin; THOMAS Gloria P. The Performance Implications
of Designing Multiple Channels to Fit with Strategy and Environment. Journal of Marketing,
Vol.71, 195-211, Oct. 2007.
KANDACHAR, Prabhu; HALME, Minna. Sustainability Challenges and Solutions at the Base of
the Pyramid: Business, Technology and the poor. Greenleaf Publishing Limited. UK. 2008.
KARAMCHANDANI, Ashish; KUBZANSKY Michael; FRANDANO Paul. Emerging Markets,
Emerging Models: Market-based solutions to the challenges of global poverty. Monitor Group.
March 2009.
KARNANI, Aneel. The Mirage of Marketing to the Bottom of the Pyramid: How the private
sector can help alleviate poverty. California Management Review, Vol. 49 Issue 4, p90-111,
Summer2007.
KEMPEN, Luuk Van. Are the poor willing to pay a premium for designer labels? A field
experiment in Bolivia. Oxford Development Studies, Vol. 32 Issue 2, p205-224, Jun2004.
KHANNA, Tarun; PALEPU, Krishna G.; SINHA, Jayant. Strategies That Fit Emerging Markets.
Harvard Business Review. p. 63-76. June 2005.
KHANNA, Tarun; PALEPU Krishna G. Emerging Giants: Building World-class companies in
developing countries. Harvard Business Review. p. 60-69, October 2006.
KUNREUZHER, Howard. Why the Poor May Pay More for Food: Theoretical and Empirical
Evidence. Journal of Business, Vol. 46 Issue 3, p368, Jul73.
242
LABAN, Silvio Abrahão. Relacionamentos no canal de distribuição de alimentos no Brasil: uma
investigação exploratória. 176 pages. Tese (Doutorado em Administração de Empresas) - Escola
de Administração de Empresas de São Paulo da Fundação Getulio Vargas – São Paulo, 2004.
LAMBERT, D.M.; KNEMEYER, A.M.; GARDNER, J.T. Supply Chain Partnerships: Model
validation and implementation. Journal of Business Logistics, Vol 25, N. 2, p.21-42, 2004.
LANDES, David. Riqueza e Pobreza das Nações: por que algumas são tão ricas e outras tão
pobres. Rio de Janeiro. Ed. Campus, 1998.
LANDRUM, Nancy. Advancing the Base of the Pyramid debate. Strategic Management Review,
Vol.1, p. 1-12. 2007.
LENARTOWICZ, T.; BALASUBRAMANIAN, S. Practices and Performance of Small Retail
Stores in Developing Economics. Journal of International Marketing, Vol. 17 Issue 1, p58-90,
2009.
LONDON, Ted; HART, Stuart L. Reinventing strategies for emerging markets: beyond the
transnational model. Journal of International Business Studies, Vol. 35 Issue 5, p350-370,
Sep2004.
LONDON, Ted. The base-of-the-pyramid perspective: a new approach to poverty alleviation.
Academy of Management Proceedings, p1-6, 2008.
MALSHE, Avinash; SOHI, Ravipreet. Sales buy-in of marketing strategies: exploration of its
nuances, antecedents, and contextual conditions. Journal of Personal Selling & Sales
Management, Vol. 29 Issue 3, p207-225, Summer2009
MATTOSO, Cecília Lima de Queirós. Identidade, inserção social e acesso a serviços
financeiros: um estudo na favela da Rocinha. Tese de Doutorado apresentada ao Programa do
Instituto de Pós-Graduação e Pesquisa em Administração, COPPEAD, Rio de Janeiro, 2005.
MCFALLS, Ricarda. Testing the Limits of 'Inclusive Capitalism'. Journal of Corporate
Citizenship, Issue 28, p85-98, Winter2007.
MAYER, Robert N.; SCAMMON, Debra L.; ANDREASEN, Alan R. Revisiting the
Disadvantaged: Old Lessons and New Problems. Journal of Public Policy & Marketing, Vol. 12
Issue 2, p270-275, Fall93.
243
MENTZER, John T.; MIN, Soonhong; ZACHARIA, Zach G. The Nature of Interfirm Partnering
in Supply Chain Management. Journal of Retailing, Vol. 76 Issue 4, p549, 20p. Winter2000.
MERRIAM, S. Qualitative research and case study applications in education. San Francisco:
Jossey-Bass Inc. 1998.
MINTZBERG, Henry; WATERS, James A. Of Strategies, Deliberate and Emergent. Strategic
Management Journal, Vol. 6 Issue 3, p257-272, Jul-Sep85.
MINTZBERG, Henry. An Emerging Strategy of "Direct" Research. Administrative Science
Quarterly, Vol. 24 Issue 4, p582-589, Dec79.
_______. Crafting Strategy. Harvard Business Review. p. 66-75, July-August, 1987.
MOHR, J.J.; SOHI, R. Communication flows in distribution channels: Impact on assessment of
communication quality and satisfaction. Strategic Management Journal. Vol. 58, July, 1994.
MOHR, J.J.; SPEKMAN, R. Characteristics of Partnership Success: partnership Attributes,
Communication, Behavior and Conflict Resolution Techniques. Journal of Retailing. Vol. 71,
p.393-416, July, 1995.
MOORMAN, C.; ZAITMAN, G.; ROHIT D. Relationships Between Providers and Users of
Market Research: The Dynamics of Trust Within and Between Organizations. Journal of
Marketing Research, 29, p.314-28. 1992.
MORGAN, R.; HUNT, S. The commitment-trust theory of relationship marketing. Journal of
Marketing, Vol. 58, Chicago, July, 1994.
MORGAN, Gareth; SMIRCICH, Linda. The Case for Qualitative Research. Academy of
Management Review, Vol. 5, No. 4, 491-500, 1980.
MORIARTY, Rowland T.; MORAN, Ursula. Managing Hybrid Marketing Systems. Harvard
Business Review. p. 146-155. November-December 1990.
NARAYANDAS, Das; RANGAN V. Kasturi. Building and Sustaining Buyer‐Seller
Relationships in Mature Industrial Markets, Journal of Marketing, 68 (3), 63‐77, 2004.
244
NELSON, Richard R. Why do firms differ, and how does it matter? Strategic Management
Journal, Vol. 12, p61, Winter91.
NELSON, Jane; ISHIKAWA, Eriko; GEANEOTES, Alexis. Developing Inclusive Business
Models: A Review of Coca-Cola's Manual Distribution Centers in Ethiopia and Tanzania.
Harvard Kennedy School. 2009.
NERI, Marcelo Cortes. Consumidores, produtores e a nova classe media: miséria, desigualdade
e determinantes das classes. FGV. 21 de Setembro de 2009.
NOBLE, Charles H.; MOKWA, Michael P. Implementing Marketing Strategies: Developing and
Testing a Managerial Theory. Journal of Marketing, Vol. 63 Issue 4, p57-73, Oct99.
OLSEN, J., & GRANZIN, K. Economic development and channel structure: A multinational
study. Journal of Macromarketing, 10(Fall), p. 61–77. 1990.
OLSEN, Mette; BOXENBAUM, Eva. Bottom-of-the-Pyramid: organizational barriers to
implementation. California Management Review, V. 51, n. 4, p. 100- 125, summer 2009.
PARENTE, Juracy. O varejo de alimentos para consumidores de baixa renda no Brasil. Projeto
de Pesquisa NPP. 2005.
PARENTE, Juracy; BARKI, Edgard. Oportunidades na Baixa Renda. GV-Executivo, Vol. 4, N.1,
p. 32, 2005.
PARENTE, Juracy; LIMEIRA, Tania; BARKI, Edgard. Varejo para baixa renda. Porto Alegre:
Bookman, 197 pages. 2008.
PARKER, Lee D.; ROFFEY, Bet H. Back to the drawing board: revisiting grounded theoryand
the everyday account’s and manager’s reality. Accounting, Auditing & Accountability Journal. v.
10, n.2, p. 212-247, 1997.
PETTIGREW, Simone. A grounded theory of beer consumption in Australia. Qualitative Market
Research: An International Journal. V. 5, Issue 2, p. 112-122, 2002.
PORTER, Michael E. Competição: Estratégias Competitivas essenciais. Rio de Janeiro, Editora
Campus, 1999.
245
PRAHALAD, C. K.; HAMEL, Gary. The Core Competence of the Corporation. Harvard
Business Review, Vol. 68 Issue 3, p79, May/Jun90.
PRAHALAD, C. K.; HART, Stuart. The Fortune at the Bottom of the Pyramid.
Strategy+Business, Issue 26, p. 2-14, 2002.
PRAHALAD, C.K.; HAMMOND, Allen. Serving the World's Poor, Profitably. Harvard
Business Review, Vol. 80 Issue 9, p48-57, Sep2002.
PRAHALAD, C. K.; LIEBERTHAL, Kenneth. The end of corporate imperialism. Harvard
Business Review, Vol. 76 Issue 4, p68-79, Jul/Aug98.
PRAHALAD, C. K. The Fortune at the bottom of the pyramid. Wharton School Publishing.
Upper Saddle River, NJ, 2005. 401 p.
PRÉVOT, Frédéric; SPENCER, Robert. Supplier competence alignment: Cases from the buyer
perspective in the Brazilian market. Industrial Marketing Management, Vol. 35 Issue 8, p944960. Nov 2006.
RAMOS-RODRÍGUEZ, Antonio-Rafael; RUÍZ-NAVARRO, José. Changes in the intellectual
structure of strategic management research: a bibliometric study of the strategic management
journal, 1980–2000. Strategic Management Journal, 25: 981–1004, 2004.
RANDALL, Wesley Spencer. AN EMPIRICAL EXAMINATION OF SERVICE DOMINANT
LOGIC: THE THEORY OF THE NETWORK. 421 pages. Thesis (Doctorate) – University of
North Texas, August, 2007.
RANGAN, V. Kasturi; JAIKUMAR, Ramchandran. Integrating distribution strategy and tactics:
a model and an application. Management Science, Vol. 37 Issue 11, p1377-1389, Nov91.
RANGAN, V. Kasturi; MENEZES, Melvyn A. J.; MAIER, E. P. Channel Selection for New
Industrial Products: A Framework, Method, and Application. Journal of Marketing, Vol. 56 Issue
3, p69-82, Jul92.
RANGAN. V. Kasturi; RAJAN, Rohitari. Unilever in India: Hindustan Lever’s Project Shakti –
Marketing to the Rural Consumer. Harvard Business School Case. Boston, MA, 2007.
246
RANGAN, V. Kasturi; QUELCH, John A.; HERRERO, Gustavo; BARTON; Brooke. Business
solutions for the Global Poor: Creating social and economic Value. San Francisco: Jossey-Bass,
2007.
RAVALLION, Martin; and CHEN, Shaohua. China’s (Uneven) Progress against Poverty.
Development Research Group. World Bank, p. 1-54. June 2004
REEDY; MINOIU. Has World Poverty Really Fallen? Review of Income and Wealth. Series 53,
Number 3, p. 484-502. September 2007.
RICHARDON, Brian; CALLEGARI, Nicolas. WIIZIT. Mobile banking for the poor in South
Africa. In: KANDACHAR, Prabhu; HALME, Minna. Sustainability Challenges and Solutions at
the Base of the Pyramid: Business, Technology and the poor. Greenleaf Publishing Limited. UK.
2008, p. 70-79.
ROSENBLOOM, Bert. The wholesaler's role in the marketing channel: Disintermediation vs.
reintermediation. International Review of Retail, Distribution & Consumer Research, Vol. 17
Issue 4, p327-339, Sep2007.
____________. Marketing Channels: A management view. Orlando, The Dryden Press. 6. ed.,
1999.
RYLANDER, David; STRUTTON, David; PELTON, Lou E. Toward a synthesized framework
of relational commitment: implications for marketing channel theory and practice. Journal of
Marketing Theory & Practice, Vol. 5 Issue 2, p58-71, Spring97.
RUYTER, Ko de; MOORMAN, Luci; LEMMINK, Jos. Antecedents of Commitment and Trust
in Customer–Supplier Relationships in High Technology Markets. Industrial Marketing
Management. Vol. 30 Issue 3. p.271-286. 2001.
SÁNCHEZ, Pablo; RICART, Joan Enric; RODRÍGUEZ, Miguel Ángel. Influential Factors in
Becoming Socially Embedded in Low-Income Markets. Greener Management International,
Issue 51, p19-38, Summer2006.
SCHWANDT, Thomas A. Three Epistemological stances for qualitative Inquiry: Interpretivism,
Hermeneutics, and social Constructionism. In: DENZIN, N.K.; LINCOLN, Y.S. Handbook of
Qualitative Research. London: Sage Publications. 2. ed. 1065 pages. 2000, p. 189-214.
247
SEELOS, Christian; MAIR, Johanna. Social entrepreneurship: Creating new business models to
serve the poor. Business Horizons, Vol. 48 Issue 3, p241-246, May/Jun2005.
SEELOS, Christian; MAIR, Johanna. Profitable Business Models and Market Creation in the
Context of Deep Poverty: A Strategic View. Academy of Management Perspectives, Vol. 21
Issue 4, p49-63, Nov2007.
SHAFER, Scott M.; SMITH, H. Jeff; LINDER, Jane C. The power of business models. Business
Horizons, Vol. 48 Issue 3, p199-207, May/Jun2005.
SHAH, Sonali K.; CORLEY, Kevin G.. Building Better Theory by Bridging the Quantitative–
Qualitative Divide. Journal of Management Studies, Vol. 43 Issue 8, p1821-1835. December
2006.
SHAMDASANI, Prem N.; SHETH, Jagdish N. An experimental approach to investigating
satisfaction and continuity in marketing alliances. European Journal of Marketing, Vol. 29 Issue
4, p6-23, 1995.
SCHUL, Patrick L.; BABAKUS, Emin. An Examination of the Interfirm Power-Conflict
Relationship: The Intervening Role of the Channel Decision Structure. Journal of Retailing, Vol.
64 Issue 4, p381, Winter88.
SIMANIS, Erik; HART, Stuart. The Base of the Pyramid Protocol: Toward Next Generation BoP
Strategy. Second edition. Cornell University.51 pages, 2008.
SIMANIS, Erik; HART, Stuart. Innovation From The Inside Out. MIT Sloan Management
Review, Summer, Vol. 50 Issue 4, p77-86, 2009.
SIMATUPANG, T.M.; SRIDHARAN, R. The collaboration index: a measure for supply chain
collaboration. International Journal of Physical Distribution & Logistics Management, Vol. 35
Issue 1, p44-62, 2005.
SIRDESHMUKH, Deepak; SINGH, Jagdip; SABOL, Barry. Consumer Trust, Value, and
Loyalty in Relational Exchanges. Journal of Marketing, Vol. 66 Issue 1, p15, Jan2002.
SIRMON, David G.; HITT, Michael A.; IRELAND, R. Duane. Managing firm resources in
dynamic environments to create value: looking inside the black box. Academy of Management
Review, Vol. 32 Issue 1, p273-292, Jan2007.
248
SOUZA, Ricardo Fasti. A Contribuição de Marketing para a Geração e apropriação de valor
para o acionista: um estudo na indústria de franchising. Tese de Doutorado (Administração de
empresas) - Escola de Administração de Empresas de São Paulo da Fundação Getulio Vargas –
São Paulo, 2000.
SRIVASTAVA, Rajenda K.; SHERVANI, Tasadduq A.; FAHEY, Liam. Market-Based Assets
and Shareholder Value: A Framework for Analysis. Journal of Marketing, Vol. 62 Issue 1, p2-18,
Jan98.
STERN, Louis W.; EL-ANSARY, Adel. Marketing Channels. Prentice Hall. New Jersey. 1977.
STERN, Louis W.; EL-ANSARY, Adel; COUGHLAN, Anne T. Marketing Channels. Prentice
Hall. New Jersey. 1996.
STRAUSS, A.L.; CORBIN, J. Basics of Qualitative Research. Thousand Oaks, Calif.: Sage, 379
pages, 2008.
SUDDABY, Roy. What grounded theory is not. Academy of Management Journal, Vol. 49 Issue
4, p633-642, Aug2006.
TULI, Kapil R; KOHLI, Ajay K; BHARADWAJ, Sundar G. Rethinking Customer Solutions:
From Product Bundles to Relational Processes. Journal of Marketing, Vol. 71 Issue 3, p1-17,
Jul2007.
UNITED NATIONS DEVELOPMENT PROGRAMME. Creating value for all: strategies for
doing business with the poor. New York: One United Nations Plaza, 180 p., July 2008.
VACHANI, Sushil; SMITH, N. Craig Socially Responsible Distribution: Distribution strategies
for reaching the bottom of the pyramid. California Management Review, Vol. 50 Issue 2, p52-84,
Feb2008.
VALOR, Carmen. The influence of information about labour abuses on consumer choice of
clothes: a grounded theory approach. Journal of Marketing Management, Vol. 23 Issue 7/8,
p675-695, Sep2007.
VAROTTO, Luís Fernando. Estratégia de Relacionamento entre Atacadistas e Varejistas no
Mercado de Baixa Renda - Uma Perspectiva do Pequeno Varejo de Auto-Serviço. 188 pages.
Dissertação (Mestrado em Administração de Empresas) - Escola de Administração de Empresas
de São Paulo da Fundação Getulio Vargas – São Paulo, 2007.
249
WEBSTER, Jr. F. E. The Changing Role of Marketing in the Corporation. Academy of Marketing
Science. Journal of Marketing, Vol. 56, October, 1992.
WELD, L. D. H. Marketing Functions and Mercantile Organizations. American Economic
Review; Vol. 7 Issue 2, p. 306-318; 1917.
WHETTEN, David A. What constitutes a theoretical contribution? Academy of Management
Review, vol.14, no. 4, 490-495, 1989.
WILSON, Craig; WILSON, Peter. Make Poverty Business: Increase profits and reduce risks by
engaging with the poor. Greenleaf Publishing. 192 pages. 2006.
WILSON, Emma; ZARSKY, Lyuba; SHAAD, Brian; BUNDOCK, Ben. Lights on or trade off?
Can base of the pyramid approaches deliver solutions to energy poverty? In: KANDACHAR,
Prabhu and HALME, Minna. Sustainability challenges and solutions at the base of the pyramid.
Greenleaf Publishing. UK. p. 51-68. 2008.
WORLD ECONOMIC FORUM. The Next Billions: Unleashing Business Potential in Untapped
Markets. Switzerland, January 2009.
WREN, Brent M. Channel Structure and Strategic Choice in Distribution Channels. Journal of
Management Research. Volume 7, Number 2 August 2007.
YOUNG, Louise C.; WILKINSON, Ian F. The Role of Trust and Co-operation in Marketing
Channels: A Preliminary Study. European Journal of Marketing, Vol. 23 Issue 2, p109-122,
1989.
YUNUS, Muhammad. Creating a World without poverty: Social Business and the future of
capitalism. New York: Public Affairs. 261 pages. 2007.
250
APPENDIX 1 – Basic questionnaire used in the interviews
DESCRIPTION OF THE COMPANY
1. Describe your distribution structure?
(Sales structure, channels used, importance of each channel)
DISTINCTIVE CHARACTERISTICS OF BoP MARKETS
2. What are the distinctive characteristics to distribute to low income markets?
3. In your opinion, what is the ideal model to distribute products to BoP markets?
4. Who are the benchmarks in this market?
THE COMPANY EXPERIENCE AT BoP
5. What is the market share of your company [in a pre-determined category]? How is this
market share for low income and for high income consumers?
6. How does your company [in a pre-determined category] distribute for low income?
7. What are the differences when thinking for high income neighborhoods?
8. In your opinion, what are the resources and competences that a company should have so as to
be successful in BoP markets?
DIFFERENCES IN MARKETING CHANNELS
9. Is there any difference in commercial policies for the different marketing channels?
10. Are there any partnerships with other companies in the distribution for BoP?
11. How do you perceive relationship in the marketing channel? Do you think your company
controls the channel?
12. Do you perceive any difference between relationship in the marketing channel for High and
Low income markets?
13. In your opinion, MNCs, large national companies or small companies have more competitive
advantages in distributing to low income markets? Why?
FINALIZATION
14. In your opinion what is the secret of success in distribution to BoP?
251
APPENDIX 2 – Open coding from Interviews
Number
1
2
3
4
5
6
7
8
9
10
11
12
13
14
15
16
17
18
19
20
21
22
23
24
25
26
27
28
29
30
31
32
33
34
35
36
37
38
39
40
41
42
43
44
45
46
47
First Codification
Benchmark distributor
Benchmark door to door
Benchmark Manufacturer
BoP
BoP consumer
BoP x High Income
Branding
Capillarity
Cash & Carry
Channel Conflict
Power
Channel Structure
Commercial Policies
Communication
Company Structure
Competences
Competition door to door
Competition Large x Small
Competition Small x small
Complexity
Consistency
Consumer Behavior - General
Cost Structure
Credit
Culture - Company
Delinquency
Delivery
Dependency
Difficulties
Direct sale to retail
Distribution Efficiency
Distribution importance
Distribution Small Companies
Distributor - Exclusive
Distributor functions
Distributor Growth
Distributor Success
Distributor x door to door
Distributor x Wholesaler
Distributors - General
Distributors Professionalization
DNA BoP
Door to door
Door to door salespeople
Efficiency
Emergent Strategy
Environmental Characteristics
Number of
Comments
3
1
21
8
27
27
1
9
16
10
7
16
8
2
14
18
2
38
6
1
5
4
23
5
1
2
9
5
9
4
17
2
1
5
15
3
17
2
15
8
10
8
16
7
3
2
2
Number
1
2
3
4
5
6
7
8
9
10
11
12
13
14
15
16
17
18
19
20
21
22
23
24
25
26
27
28
29
30
31
32
33
34
35
36
37
38
39
40
41
42
43
44
45
46
47
Number of
Comments
Second Codification
Benchmark
25
BoP Consumer
31
BoP Market
10
BoP x High Income
27
Capillarity
9
Cash & Carry
16
Channel Conflict
11
Channel Structure
16
Commercial Policies
8
Company Structure
14
Competences
19
Competition door to door
2
Competition Large x Small
38
Competition Small x small
6
Consistency
5
Cost Structure
23
Credit
7
Delivery
11
Dependency
5
Difficulties
9
Direct sale to retail
4
Distributor - Exclusive
5
Distributor functions
15
Distributor Growth
4
Distributor Success
17
Distributor x door to door
2
Distributor x Wholesaler
15
Distributors - General
9
Distributors Professionalization
10
DNA BoP
8
Door to door
17
Door to door salespeople
7
Emergent Strategy
2
Fiscal Evasion
5
Frequency
5
Informality
8
Innovation
11
Key Account
11
Knowledge BoP
7
Large x small retail
3
Local x Multinational
4
Logistics
23
Medium Retailers
3
Multinational Vision
9
Partnership
4
Partnership - Community
13
Partnership Manufacturer - Small retail
2
(Continue)
252
Number
48
49
50
51
52
53
54
55
56
57
58
59
60
61
62
63
64
65
66
67
68
69
70
71
72
73
74
75
76
77
78
79
80
81
82
83
84
85
86
87
88
89
90
91
92
93
94
95
96
97
98
99
TOTAL
Number of
Comments
First Codification
Fiscal Evasion
5
flexibility
2
Frequency
5
Informality
8
Innovation
11
Key Account
11
Knowledge BoP
7
Large x small retail
3
Local x Multinational
4
Market more mature
1
Medium Retailers
3
Multinational Vision
9
Partnership
4
Partnership - Community
13
Partnership Manufacturer - Small retail
2
Partnership Manufacturer -Distributor
2
Partnership NGO
4
Penetration
1
Pre sale
1
Products x channels
2
Profitability
13
Prompt delivery
1
Regional Differences
6
Relationship
20
Relationship Distributor - Retail
13
Relationship Local - Consumer
2
Relationship Manufacturer - Distributor
28
Retail professionalization
6
Safety Concerns
12
Sales management
3
Sales Operation
4
Sales Structure
18
salesmen
16
Small Companies
5
Small Differentials
11
Small Retail
19
Small Survivence
5
Small valorization
6
Stock out
1
Strategy
10
Strategy - Communication
7
Strategy - Distribution
11
Strategy - pricing
5
Strategy - product
20
Strategy - product door to door
2
Subdistribuitor
1
Support to small
4
Sustainability
2
Time of operation
8
Training
3
Trust
8
Wholesaler
13
816
Number
48
49
50
51
52
53
54
55
56
57
58
59
60
61
62
63
64
65
66
67
68
69
70
71
72
73
74
75
76
TOTAL
Number of
Comments
Second Codification
Partnership Manufacturer -Distributor
2
Partnership NGO
4
Power
7
Profitability
13
Regional Differences
6
Relationship
20
Relationship Distributor - Retail
13
Relationship Local - Consumer
2
Relationship Manufacturer - Distributor
28
Safety Concerns
12
Sales Operation
7
Sales Structure
18
salesmen
16
Small Companies
5
Small Differentials
13
Small Retail
19
Small Survivence
5
Small valorization
6
Strategy
10
Strategy - Communication
9
Strategy - Distribution
12
Strategy - pricing
5
Strategy - product
25
Support to small
4
Sustainability
2
Time of operation
8
Training
9
Trust
8
Wholesaler
13
816
253
APPENDIX 3 – Categories from Axial Coding
Number
1
2
3
4
5
6
7
8
9
10
11
12
13
14
15
Category
Success
Direct Sales
Retailers
Wholesalers / Distributors
Channel Design
Operation Marketing Channel
Institutional Voids
Competition BoP market
Company Structure
Competences
Strategy
BoP knowledge
BoP market
Partnership
Relationship
1. SUCCESS
2. DIRECT SALES
254
3. RETAILERS
4. WHOLESALERS / DISTRIBUTORS
255
5. CHANNEL DESIGN
6. OPERATION MARKETING CHANNEL
MARKETING
CHANNEL
OPERATION {0-5}
is property of
CHANNEL DESIGN
{0-3}
is property of
is property of
is property of
Commercial
Policies {8-5}
is property of
Institutional Voids
{0-6}
is part of
Sales Structure
{18-4}
is part of
Logistics {23-10}
is part of
Competences {19-5}
Cost Structure
{23-3}
is part of
Channel Conflict
{11-4}
is part of
is cause of
Credit {7-2}
is part of
is associated with
is associated with
Company
Structure {14-5}
is part of
Distributor
functions {15-6}
salesmen {16-3}~
Consistency {5-4}
is property of
Delivery {11-2}
is part of
is part of
is part of
Frequency {5-1}
Support to small
{4-7}
is part of
is part of
is part of
Training {9-3}
256
7. INSTITUTIONAL VOIDS
8. COMPETITION BoP MARKET
257
9. COMPANY STRUCTURE
10. COMPETENCES
11. STRATEGY
258
12. BoP KNOWLEDGE
13. BoP MARKET
14. PARTNERSHIP
259
15. RELATIONSHIP
260
APPENDIX 4 – Categories from Selective Coding
Satisfactory
Distribution
Success
Direct Sales
Retailers
Institutional Voids
BoP Environment
Competition BoP
market
Channel
Design
Wholesalers/
Distributors
Strategy
Execution of
Marketing
Channel Strategy
BoP DNA
Competences
Company
Structure
Operation
Marketing
Channel
BoP knowledge
BoP
knowledge
BoP Market
Partnership
Relationship
Relationship
Baixar