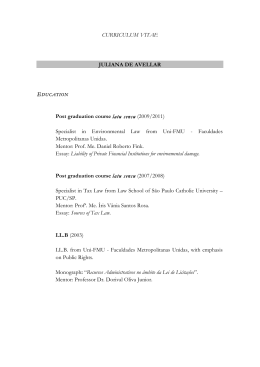
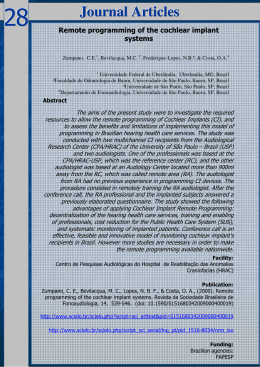
INSTITUTO DE ENGENHARIA DE SISTEMAS E COMPUTADORES DE COIMBRA
Institute of Systems Engineering and Computers
INESC-COIMBRA
Célia Braga, Patrícia Pereira da Silva e Ariovaldo dos Santos
Sustainability reporting:
an assessment tool for environmental disclosure in the electricity sector
N°2
2011
ISSN: 1645-2631
Instituto de Engenharia de Sistemas e Computadores de Coimbra
INESC - Coimbra
Rua Antero de Quental, 199; 3000-033 Coimbra; Portugal
www.inescc.pt
Sustainability reporting:
an assessment tool for environmental disclosure in the electricity sector
CÉLIA BRAGA (3,2), PATRÍCIA PEREIRA DA SILVA (1,2) e ARIOVALDO DOS SANTOS (4,5)
(1)
(2)
Faculdade de Economia da Universidade de Coimbra,
Av. Dias da Silva, 165, 3004-512, Coimbra, Portugal
Instituto de Engenharia de Sistemas e Computadores – Coimbra
Rua Antero de Quental, 199, 3000-033 Coimbra, Portugal
(3)
Bolsista da Coordenação de Aperfeiçoamento de Pessoal de Nível Superior (CAPES) - Brasília/
UFC - Universidade Federal do Ceará – Fortaleza,
Av. da Universidade, 2431, 60020-180, Fortaleza, Brazil.
.
(4)
USP - Departamento de Contabilidade e Atuária da Faculdade de Economia e Administração da Universidade
de São Paulo – São Paulo,
Av. Prof. Luciano Gualberto, 908 - Prédio: FEA3 - CEP: 05508-900, São Paulo, Brazil
(5)
FIPECAFI- Fundação Instituto de Pesquisas Contábeis, Atuariais e Financeiras – São Paulo,
Rua Maestro Cardim, 1170, 01323-001, São Paulo, Brazil.
February, 2011
Abstract: This study aims to analyze the impact of social and environmental release from an
industry regulator report, belonging to the energy sector, on the level of environmental
information disclosure. In particular, we depart from the rules and indicators issued by the
National Electric Energy Agency of Brazil (NEEA) to analyze its impact on the set of
electricity Brazilian companies during the period between the years 2006 to 2009. We
considered 60 companies belonging to various segments of the value chain of the electricity
industry. The metric total of 90 indicators included 34 from the Global Reporting Initiative and
56 from NEEA. This survey has used exploratory techniques, and employs content analysis to
collect and analyze data and correspondence analysis in the panel. The results showed a
significant raise in the level of disclosure of the entities under observation, especially by the
generating and transmission companies, consequential of the publishing of the social and
environmental report from NEEA. It is noteworthy that, although it is found a growth in a
voluntary disclosure arising from the GRI guidelines, this does not reach the level of disclosure
resulting from the rules of the regulatory agency in Brazil. The progress of information
dissemination takes place either on a qualitatively or a quantitatively way, being relevant to
highlight the year 2009, when occurred a second report emission the to all electric utilities.
Keywords:
social and environmental reporting, environmental indicators, environmental
disclosure, the electrical energy sector, Brazil.
2 Introduction
For millennia, the energy in the form of biomass and fossilized biomass was used for
cooking and heating, and for the creation of materials ranging from bricks to bronze. Despite
these developments, the wealth in almost all civilizations was essentially defined by the access
and the control over energy and water..
The great challenge for companies in the energy sector in the twenty-first century is to
bring a tripod to ensure the security of supply of electricity for a growing consumer market,
with low emission of greenhouse gases at a fair price. Plus, all this must be sought from
alternative energy sources and with fair prices for consumers, to guarantee economic and
financial returns for the investing companies.
To monitor the environmental and economic aspects in a synergistic way, the electricity
companies in Brazil use certifications, management models and international and national
guidelines. The international orientation of the Global Reporting Initiative (GRI) comprises
indicators that address economic, social and environmental groups of indicators specific the
electricity sector. From these indicators, the industry regulator in Brazil, the National Electric
Energy Agency (NEEA1), created a set of guidelines for setting up the social and
environmental report transforming the sustainability report into a crucial tool for evaluation of
environmental disclosure in the electricity sector in Brazil.
Therefore, this study aims at analyzing the importance of social and environmental
release of a report from NEEA to the Environmental Information Disclosure Level (EIDL) of
Brazilian companies in the electricity sector in the period 2006 to 2009.
The work is structured in five sections. The first section presents the introduction. The
following section reviews the previous studies that include the dissemination of environmental
information and sustainability report. The third describes the methodology and sample
identification. The fourth section presents the analysis of results. Finally, the fifth section
presents the conclusions.
1
In Brazil this agency is known by the acronym ANEEL. 3 1. Disclosure of environmental information and Sustainability Report - Review of
Literature
Currently, companies in the world, use it for financial disclosure, basically, the
conceptual framework of the International Accounting Standards Board (IASB) and Financial
Accounting Standard Board (FASB). Among the noteworthy elements of scope are: the
objectives of financial statements and the qualitative characteristics that determine the
usefulness of the information contained in those statements, Ernst & Young and FIPECAFI
(2009), Riahi-Belkaoui (2004).
Even though the FASB and IASB standards have not yet presented rules on the social
and environmental aspects, its conceptual basis is applicable to these dimensions. The
complexity of the publication of such information, as well as financial ones, is related to the
quality of information provided and the conflict of interests of the company, of other
stakeholders and accounting professionals, including accountants, Riahi-Belkaoui (2004),
FASB (1980).
The decade of 90 presented a considerable progress in the research on both cost and
management accounting (Horngen et al., 2000) and on Corporate Social Responsibility topics
(CSR). Combined, these two disciplinary areas aim at promoting a sustainable strategy and
provide a new framework for cost, financial or management accounting evolution, According
to Schaltegger and Burritt (2009), Freeman and Reed (1983), Sangle and Babu (2007), this new
methodological accounting approach allows an assessment of the risks and benefits of social,
environmental and economic management useful for the company and revealing to external
stakeholders
As well as the importance of this information to external stakeholders, the issue of
comparability becomes essential in supporting decisions that require monitoring of past, present
or predictable future outcomes. The comparison allows us to analyze the company's
development, and appraise its performance against peer companies and different industries,
Hendriksen and Breda (1992).
In order for stakeholders to assess the company's environmental performance it is
required that both qualitative and quantitative data are included in the disclosure procedures.
Besides, they have to be presented in the form of monetary and nonmonetary data in course of
time and with the indicative targets. The disclosure report, even if voluntary, must submit a
4 minimum standardization to be published following a periodicity compatible with the
objectives of the stakeholders and in an easy support to access.
Some solutions presented by Non Governmental Organizations (NGOs) intended to
alleviate the problem of lack of standardization and uniformity in the content of environmental
reports. External certifications such as the International Standards Organization's (ISO) 14001,
also promote the standardization of environmental practices and their dissemination.
There were also established guidelines about the environmental information to be
published, among which stand out internationally, Global Reporting Initiative (GRI), Coalition
for Environmentally Responsible Economics (CERES), Public Environmental Reporting
Initiative (PERI) and International Chamber of Commerce Business Charter for Sustainable
Development (ICC), Jose and Lee (2007). In Brazil, it is noteworthy the most relevant
guidelines of the Brazilian Institute of Social and Economic Analyses (BISEA2) and Ethos
Institute.
In this research we analyze the contents of sustainability reports using GRI indicators,
G3, and the indicators of social and environmental report with the guidelines of NEEA.
Concerning the frequency of the environmental report in electricity industry, usually companies
disclose it in conjunction with the financial statements (between 90 and 120 days after the end
of the fiscal year), and others a few months later, but generally on a yearly basis.
A further important aspect is the material support and method of diffusion. Following
Jose and Lee (2007), the internet has emerged as an affordable tool, with quick and simple
accessibility. In Brazil, the internet is widely used, for example, by publicly held companies,
Calixto et al. (2007), Rover et al. (2009). In the companies websites sustainability reports are
more efficiently disseminated because the firm is able to release the report and various other
information, according to the information needs of each user (extension, template and
language), as stated by Bolívar (2009). Besides the disclosures on the sites, companies still use
printed complete reports and CD-ROM based. 2.1.
The disclosure of the sustainability report
The report is an outline of all the economic facts made by the entity and duly registered
2
This institute is known in Brazil as IBASE. It created a model of Statement Balance Social entitled: IBASE model. 5 by the accounts regarding a specific period of time. This reduced form is the instrument
through which stakeholders have access to information concerning the assets of the business
allowing for the analysis of financial, economic, social and environmental outcomes, obtained
by the entity.
In Brazil, environmental disclosure is voluntary and reporting does not have a predefined model. Some companies disclose environmental, social and financial information in a
single report, and others publish these informations in separate reports. Rover et al. (2009)
agree with that model, while Simnett et al. (2009) regard this as the most appropriate. Even
following the GRI guidelines and the recommendations of NEEA, the reports differ both in
structure and in contents. In Portugal and Spain, for instance, the form of disclosure is similar
to the Brazilian model, however the announcement is held in a mandatory way (Sarmento,
Durão 2009, Eugénio, 2010)). In Greece, the patterns of dissemination of the report are similar
to those in Brazil; the publishing is voluntary, but restricted to a small number of companies,
Skouloudis et al. (2010).
The lack of uniformity affects the reliability of the information as shown by Simnett et
al. (2009), Oliveira (2005) and Rover et al. (2005). Therefore, Simnett et al. (2009) argue that
only professional auditing is the path to support the criterion of reliability.
The shortage of mandatory publishing of environmental information and the high cost
of audits encourage the work of providers of assurance in sustainability reports. Currently, two
global standards guide these professionals: International Standard Assurance Engagements
(ISAE 3000) introduced by the International Auditing and Accounting Standards Board
(IAASB) of the International Federation of Accountants (IFAC), effective since 2005, and the
AA1000 Assurance Standard (AA1000) edited by AccountAbility in 2003. National standards
were also introduced in Australia, Germany, Japan, Sweden and the Netherlands (KPMG,
2005).
The adaptation of firms in relation to environmental practices required by the
stakeholders has induced effects at the management level, and also in how they report their
interaction with the environment. In view of that, it is perceived that it has become a constant
search for greater disclosure, better accountability, improved corporate governance practices
and ethical behavior by companies, in relation to information on environmental (Rover et al.
2009).
The resolution to the challenges of sustainability is from an interdisciplinary nature.
Therefore, requires the effective interface between the company and its external stakeholders,
6 especially by those with whom it has critical relationships (Berns et al., 2009). Namely, in the
energy sector, stakeholders embrace shareholders/investors and consumers/customers, followed
by the government and the regulatory authority.
The electricity supply industry is considered sensitive because of their environmental
impacts as it is discussed in several studies by Rover et al. (2009), Jose and Lee (2007) or
Costa and Marion (2007). This industry possesses a particular stakeholder, which is the
community directly affected by generation activities (dam construction, processing of uranium,
coal mining, waste disposal and noise, etc.) transmission (network installation in conservation,
indigenous and residential areas) and deployment (installation of substations, and disposal of
lamps and mineral oil).
Each company identifies its stakeholders as the most important ones. It is essential to
disclose the environmental facts that occurred in the entities to all stakeholders accounting for
transparency and reliability issues, as above mentioned. The costs for the use of nature
(emissions, pollution of river etc.), mainly the severe negative impact, they must be identified
in the operational activities of entities that can be monitored, minimized and/or eliminated due
to negative effects on equity and the environment.
After identifying the stakeholders, companies must classify what will be disclosed and
how it is done. In 1999, the GRI created guidelines and a set of economic, social and
environmental indicators (G1 version) in order to suit the characteristics of firms in different
economic sectors, and across the world. Since then, the GRI has enhanced its modeling of
indicators and became a world language that supports the disclosure and analysis of economic,
social and environmental organizations. The participation of Brazilian companies in the GRI
started in 2000. In 2003, the electric power industry began its participation with CPFL Energia
S. A. publishing the Social Responsibility Report, 2002, G2.
In Brazil, as mentioned above, NEEA issues guidelines on social and environmental
disclosure. Worth mentioning is the broadcasting of the Statement of Balance Social in the
IBASE model, from the Statement of Value Added (DVA)3 model in the Institute of
Accounting, Actuarial and Financial Affairs (FIPECAFI) and the social and environmental
report covering indicators NEEA (Order N°. 3034 of 12.21.2006), which was originally
3
This accounting statement highlights the value of the richness generated by the company, its distribution between the
elements that contribute to the generation of this richness such as employees, creditors, stakeholders government and others as
well as the part of the richness non-distributed, according to Article. 188, item II, of legislation 11.638/2007, BRASIL, Santos
(2007). 7 reported by distributors in 2007, and in 2008 was extended to generating and transmission
companies.
Releasing the report with environmental information is made available on company
websites, GRI and NEEA.
3.
Methodology and sample identification
The theme of this exploratory research portraying the GRI and NEEA indicators that
this work presents has an innovating character, Richardson et al. (2009).
The type of probability sampling adopted is a stratified and non-proportional Gil (2008).
The sample includes generating, transmitting and distributing companies of electricity in
Brazil.
The characterization of the sample was made from the universe presented in Table 1. To
select the data sustainability reports were collected (GRI and NEEA) and financial reports for
the years 2006 to 2009, were gathered from the sites of NEEA, from the Brazilian Securities
Commission (CVM) or from companies webpages.
Table 1. Number of reports published and sample definition
GRI
Companies
Generators
Transporters
Distributers
Total
2006
1
0
3
4
2007
6
9
6
12
NEEA
2008
5
1
5
11
2009
3
1
3
7
2006
0
0
0
0
2007
0
0
60
60
2008
25
34
61
120
2009
20
26
49
95
Sample
size
15
5
40
60
Source: Data taken from ANEEL (2010) and GRI (2010).
After the investigation of indicators, the sample reached up to 60 companies regarding
the three main segments of the industry value chain (see Table 1). It is worth noticing that the
electricity sector also includes holdings and trading companies.
The research aims to examine the importance of social and environmental release of a
report from NEEA to the (EIDL) of Brazilian companies in the electricity sector in the period
2006 to 2009.
The study has two specific goals. The first aims to review developments in the level of
disclosure of environmental information of each company in the sample and, the second, aims
8 at verifying the relationship between the level of disclosure of environmental information and
the year of publication using correspondence analysis (CA).
3.1 Data analysis technique: Correspondence analysis
Correspondence Analysis (CA) is an exploratory multivariate technique that converts
frequency table into graphical displays in which rows and columns are depicted as points. It
provides a method for comparing row and columns proportions in a two-way or multivariate
table. Mathematically, CA decomposes the Chi-square measure of association of the table into
components in a manner similar to that of principal component analysis for continuous data
(Greenacre 1984, 1989)4. CA is, thus, a method of visually representing the associations
between different categorical variables. Its primary goal is to “transform a table of numerical
information into a graphical display, facilitating the interpretation of this information. It is not a
method of testing a hypothesis, although it does draw on the logic of Pearson’s chi-square
statistic in computing distances for purposes of graphic representation”. CA analysis is most
often employed, as it is used here, as a method for portraying data for visual inspection and
analysis, rather than a method for testing statistical significance.
3.2 Methodological approach
The survey departs from the technique of content analysis5 combined with documentary
research, as in Bardin (2008), Martins and Théophilo (2007) and Silva et al. (2005), to analyze
the environmental indicators of sustainability reporting (GRI model and NEEA), and calculate
the index EIDL.
A metric of 34 indicators and 56 indicators GRI guidelines NEEA, adding together 90
environmental indicators was structured. Given the general applicability of the indicators
presented in the guidelines, some refer to the operational activity of an energy generator, but do
not apply to a transmitter nor to a distributor. Therefore, in the selection of indicators we
4
Correspondence analysis is far more familiar to social scientists in Europe and Japan than in the United States. It is often
referred to under different names, and may be familiar to readers under another name, such as: canonical analysis, principal
components analysis of qualitative data, optimal scaling, multidimensional scaling, or, in French, analyse factorielledes
correspondences or analyse des données.
5
It is a set of technique of communication analysis aiming to obtain through systematic procedures and the objectives of
descriptions from the messages contents, indicators (quantitative or not) that allows the inference of the knowledge related to
the conditions of production/reception (inferred variables) from these messages, Bardin (2008).
9 excluded those that do not apply to all links of the operational chain (generation, transmission
and distribution) The framework of this research follows the one by of Liu and Anbumozhi
(2009).
To quantitatively analyze the indicators and calculating the variable EIDL for the period
2006 to 2009 we defined the criterion index ranging from 0 to 4 like in Skouloudis et al.
(2010).
Each indicator is indexed according to the criterion and the score shown in Table 2.
Table 2. Criteria and punctuation of the model of the index
Criteria of the response of the indicator
1.Indicator is described on the report as ´Non available´
(ND) or not being published
2.Indicator with only qualitative response
3. Indicator with only quantitative response
4.Indicator with qualitative and quantitative response in the
fiscal year (Ex.2008)
5.Indicator with qualitative e quantitative response, in the
time (Ex.2008/2007)
Scores
0
1
2
3
4
The response criteria of the indicator number 1 was used in this study because the
methodology GRI G3 is applied in medium and long term, it suggests a process of evolving
social and environmental commitment. Therefore, it is a criterion adopted by the GRI and
followed by NEEA.
Some researchers have used binary indexing, for instance, Borba (2010), Murcia (2009),
Cho and Patten (2007), Lima (2007). In other experiments have been assigned different scores
to an analysis of the extent of disclosure, Skouloudis et al. (2010), Liu and Anbumozhi (2009),
Jose and Lee (2007). In this study we chose to index with different values for the qualitative
analysis of the extent of environmental information disclosed.
The EIDL index of each company was calculated by the sum of individual scores
divided by the total maximum score that could be obtained in the case, 360 points.
The research methodology uses the system developed by the Center for Environmental
Policy and Strategic Management Environment, University of Aegean, Greece, Skouloudis et
al. (2010), and the philosophical basis of the concept of sustainable development, Mebratu
(1998).
To test the reliability of the methodology was then validated by Hair et al. (2005) which
employs the Cronbach’s alpha reliability coefficient that assesses the consistency of the entire
10 range. This is the most widely used measure in this type of exploratory studies, Pestana and
Gageiro (2008); Maroco and Garcia-Marques (2006), Churchill Jr. (1986).
The test presented in this study shows the results listed in Table 3. According to Pestana
and Gageiro (2008), the result shows that the metric of the study has a very good internal
consistency, considering that the four periods adopted in the research had values of Cronbach's
alpha above 0.9.
Table 3. Cronbach’s Alfa results
Period of the analyses of metric
2006
2007
2008
2009
Cronbach’s Alfa Value
0,962 or 96,2%
0,952 or 95,2%
0,935 or 93,5%
0,936 or 93,6%
To evaluate the relationship between EIDL variables and the year of disclosure of
environmental information CA was used in panel, with 240 information regarding the period
from 2006 to 2009 (Fávero et al., 2009, Hair et al., 2005, Lima, 2007).
CA is, therefore, an interdependence technique that studies the relationship between
qualitative variables, allowing the visualization of associations, through perceptual maps that
provide a sense of closeness, or combination of frequencies of variables between non-metric.
The panel is balanced, and allows tracking the performance of the company over time
(Gujarati, 2006) and Wooldridge, 2007).
To qualify businesses in levels of disclosure it has been adopted as a criterion to divide
the level of disclosure in quartiles to distribute EIDL variable classified into four categories
levels: bad, regular, good or very good.
4.
Discussion of results
The computation of EIDL shows that in the period ranging from 2006 to 2009, out of
the 15 generating companies covered in the sample, 67% showed an increased level of
disclosure, whereas 33% showed a reduction. The five transmission companies grew, and for
the 40 distributors analyzed, 58% demonstrated improvement, and 42% had a reduction in the
level of disclosure of environmental information.
11 The analysis of the socio and environmental report suggests that most companies,
especially the generating and transmitting ones did not have a database with environmental
information prior to the orientation of the NEEA. Perhaps, therefore, some of the samples have
this feature to reduce the level of disclosure.
From the data of the percentiles presented in Table 4, we used quartiles to categorize the
EIDL. The companies received scores from 1 to 4, according to the range of data divided into
quartiles: zero, note 1, above zero until the value of 0.144400, note 2, 0.144400 up to the value
0, 244400, note 3; and above 0.244400, note 4. Therefore, the reporting level was classified
into four grades: Grade 1 - Bad, Grade 2 - Regular, Level 3 - Good, and Grade 4 – Very good.
Tabela 4. Percentilles and quartiles of the levels of disclosures6
Percentiles
Weighted Average
Tukey’s Hinges7
(Definition 1)
5
10
25
50
75
90
95
0,000000
0,000000
0,000000
0,144400
0,244400
0,371370
0,427660
0,000000
0,144400
0,244400
The classification shown in Figure 1, Box-plot graph with the identification of the
maximum value of EIDL (0.5694) in the period 2006 to 2009, in the third quartile value of
0.2444, the 0.1444 median and the first quartile in the value of zero. The values that are above
the maximum EIDL are considered outliers.
6
All the statistics results shown in the tables and graphics in this study were calculated with Statistical Package for the Social
Sciences (SPSS 17.0).
7
These are the first, second and third quartile. They are calculated in the way that Tukey originally proposed when he came up
with the idea of a boxplot, UCLA (2011).
12 Figure 1. Box-plot visualization of the quartiles and median of the EIDL variable.
The hypothesis X² test (Chi-square) presented as a result Asymp. sig 0.000 <0.05, then
reject the null hypothesis and accepted the condition of CA that there is a relationship between
the level of disclosure of environmental information and the years it was held. The categories
are associated in a non-random way with a confidence level of 95%, Pestana and Gageiro
(2008), Fávero et al. (2009).
Table 5 shows the result in the contingency table that confirms the relevance of power
of the regulating agent on the level of disclosure. In 2006, the highest level representation is
bad, considering that this year; only four companies in the electricity sector in Brazil released
their reports on the GRI website. It was when NEEA issued guidance on the report social and
environmental.
13 Table 5. Table of the contingence variable year x level of the disclosure in panel
Environmental Information Disclosure Level (EIDL)
Year
Bad
Regular
Good
Very
Good
Active
Margin
2006
56
0
1
3
60
2007
14
17
19
10
60
2008
1
18
24
17
60
2009n
0
20
12
28
60
71
55
56
58
240
Active Margin
The concentration in the level categorized as bad was reduced in 2007, when the energy
distributors began releasing the social and environment report from NEEA, and 12 companies
in the sample published report with the GRI model. This year, there were still 14 companies
with poor level of disclosure because it concentrated power generating companies and
broadcasters who had not yet rules for disclosure. However, there is significant growth in
regular levels, good and very good, 17, 19 and 10, respectively.
In 2008, NEEA guidance on the development of social and environmental reporting was
extended to generating and transmission. Companies that fall into these two parts of the chain
with the lowest levels of disclosure, including the financial aspect, which is why only 15 and 5
companies, respectively, comprise the sample. Despite this limitation, the level of
environmental disclosure showed progress with only a company with poor level of disclosure
and 41 firms in the levels good or very good.
The result of 2009 seems more satisfactory, with 28 ranked companies on very good
level of disclosure.
In short, the level of disclosure in the sample has a balance in the regular, good and very
good categories, but with a greater number of firms in bad level. This result is relevant because
it aims to contribute to some studies conducted in Brazil, considering various sectors and only
companies listed at Bovespa, which show only the optimal level of disclosure of the electricity
sector in Brazil, comparing it with other sectors, Borba (2010), Braga et al. (2009), Calixto et
al. (2007), Rover et al. (2005). In this study, in which we consider only this sector and
companies that are not listed on stock exchanges, it is clear that much still needs to improve in
level of disclosure of environmental information, both qualitative and quantitative aspect.
The increased level of disclosure is made as a result of the publication of the social and
environmental NEEA report, which is being used as pioneers in this study on the disclosure of
14 environmental information and demonstrates to become a valuable tool of social and
environmental disclosure in the electricity sector Brazil.
Next, we calculate the differences between expected and actual frequencies of each
variable, called waste, according to Table 6. Residual analysis reveals the characteristic
patterns of each category for each variable, Fávero et al. (2009). It shows the relations of
proximity and distance between the categories of each variable, which is confirmed by the
analysis and perceptual map dimensions. When the categories have positive signs means a
close relationship, and when the sign is negative, there is clearance.
Table 6. Frequency of the residuals
Environmental Information Disclosure Level (EIDL)
Year
Bad
Regular
Good
Very
Good
2006
38,3
-13,8
-13,0
-11,5
2007
-3,8
3,3
5,0
-4,5
2008
-16,8
4,3
10,0
2,5
2009
17,8
6,3
-2,0
13,5
Of the three dimensions identified in the study, the dimension one is the one that
contributes the highest level of explanation (92.1%) for total inertia8. According to Fávero et al.
(2009), usually the first dimension is the one that explains the variation in the data.
While the study presents more than two dimensions, Hair et al. (2005) suggest as a
practical rule for selecting the two-dimensional analysis with inertia greater than 0.2 for
analysis. In this investigation, the second dimension was chosen to 0.057 and 7.5% of inertia to
explain the total inertia.
The most important categories by size are those whose contribution to the explanation
of the size is greater than its mass, and that both are far away from the origin of axes
(dimensions) in the graph, Pestana and Gageiro (2008). Confirming the results presented in
Table 5, the most important categories in dimension 1 were 2006 and bad, and in dimension 2,
2009 and very good.
8
Explained variance.
15 Despite presenting signs and values of score on different dimensions, the categories can
be grouped into types or homogeneous groups, Pestana and Gageiro (2008), as shown in Table
7.
Table 7. Summary of the score by dimension
Dimension
1
Negative Score
2006
Bad
Positive Score
2009
2008
Regular
2
2007
2008
Good
2009
Very Good
The summary score for each dimension indicates the important role of regulation of
social and environmental NEEA's report in the level of disclosure of environmental information
companies, considering the categories of the variable year.
The above aspects can are shown on the perceptual map shown in Figure 2.
Figure 2. Perceptual map Year and EIDL.
16 In 2006 preponderates a bad level of disclosure, in the financial year 2007 between
regular and good; in 2008 remains the level of 2007 with an approach to good. And finally, in
2009 the level of disclosure evolved, highlighting the very good level.
5.
Conclusion
It is clear that companies approach their commitment to disclose social and
environmental indicators in different ways. The GRI provides a framework for company
sustainability reporting, as well as the one provided by the electricity regulatory agency.
The national and international research on the level of environmental disclosure for
enterprises from different sectors shows that companies in the electricity sector because it is
considered a sensitive industry, present an optimal degree of disclosure.
The main contribution of this research study exclusively focused on the Brazilian
electricity supply industry is to provide empirical evidence on the level of disclosure of
environmental information of these companies, in the context of value chain operations. It is an
innovative study with its focal point on the use of indicators of NEEA to calculate the EIDL.
In this context, the key findings revealed in this study confirm the improvement of the
level of environmental disclosure by companies in the sector over the period 2006-2009.
The estimate of EIDL shows that 67% of the generating companies had an increased
level of disclosure, while 33% had reduced. The transmission companies grew, and the
distributors showed an advance of 58% and 42% reduction.
The relationship between the variables year of publication and EIDL shows that in 2006
a level of disclosure bad prevails, it is because only four companies made voluntary disclosure
of the GRI indicators. In 2007, the level was between fair and good, indicating the important
role of early regulation of social and environmental report NEEA for utilities.
In 2008 the level was maintained as in 2007, with a great approach to the category
suggested by the inclusion of the generating and transmission companies, under the guidance of
NEEA. Finally, in 2009 the level of disclosure progresses, highlighting the very good level.
This demonstrates the evolution of companies in the collection and dissemination of
environmental information in the reports on both the GRI as NEEA.
17 References
ANEEL - Agência Nacional de Energia Elétrica
<http://www.aneel.gov.br/>. Accessed on the 12th Jan. 2011.
(2010)
Available
in
Bardin, L. (2008) Análise de conteúdo. Lisboa : Edições 70, LDA.
Berns, M.; Townend, A.; Khayat, Z.; Balagopal, B.; Reeves, M.; Hopkins, M. S.; Kruschwitz,
N. (2009) Sustainability and Competitive Advantage, MIT Sloan Management Review. 51, 126.
Bolívar, M. P. R. (2009) Evaluating Corporate Environmental Reporting on the Internet: The
Utility and Resource Industries in Spain. Business & Society. 48, 179-205.
Borba, J. A. (2010) Green reporting in Brazil: the case of industries sensitive to environment.
In: 4ª GECAM – Conferência de Gestão e Contabilidade Ambiental, 14-15.10, Leiria
(Portugal).
Braga, J. P.; Oliveira, J. R. S.; Salotti, B. M. (2009) Determinantes do Nível de Divulgação
Ambiental nas Demonstrações Contábeis de Empresas Brasileiras. Revista de Contabilidade da
Universidade Federal da Bahia, 3 (3), 81-95.
BRASIL. Lei Nº 11.638, de 28 de Dezembro de 2007. Altera e revoga dispositivos da Lei no
6.404, de 15 de Dezembro de 1976, e da Lei no 6.385, de 7 de Dezembro de 1976, e estende às
sociedades de grande porte disposições relativas à elaboração e divulgação de demonstrações
financeiras.
Calixto, L., Barbosa, R. R., Lima, M. B. (2007) The spread of voluntary environmental
information: accounting reports versus internet. Revista de Contabilidade e Finanças. Edição
30 Anos de Doutorado, 84-95.
Cho, C. H.; Patten, D. M. (2007) The role of environmental disclosures as tools of legitimacy:
A research note. 32 (7-8), 639-647.
Churchill Jr., G. A. (1986) A paradigm for developing better measures of marketing constructs.
JMR, Journal of Marketing Research. 16 (1); ABI/INFORM Global.
Costa, R. S., Marion, J. C. (2007) The uniformity when disclosing environmental information.
Revista de Contabilidade e Finanças. 43, 20-33.
Ernst & Young; FIPECAFI (2009) Manual de normas internacionais de contabilidade: IFRS
versus normas brasileiras. Atlas, São Paulo.
Eugénio, T., 2010. Advance in the social and environmental disclosures by companies and the
legitimacy theory. Revista Universo Contábil. 6, 102-118.
FASB - Financial Accounting Standards Board (1980) Qualitative characteristics of
accounting information. SFAC - Statement of Financial Accounting Concepts N° 2. USA.
Fávero, L. P.; Belfiore, P.; Silva, F. L.; Chan, B. L. (2009) Análise de dados: modelagem
multivariada para tomada de decisões, Elsevier, Rio de Janeiro.
Freeman, R. E.; Reed, D. L. (1983) Stockholders and stakholders: a new perspective on
corporate governance. Califórnia Management Review, 25 (3), 88-106.
Gil, A. C. (2008) Métodos e técnica de pesquisa social. São Paulo:Atlas.
Greenacre, M. J., (1989) The Geometric Interpretation of Correspondence Approach. Journal of
18 the American Statistical Association, 82, 437-447.
Greenacre, M. J., (1984) Theory and Applications of Correspondence Analysis, London:
Academic Press.
GRI
-
Global
Reporting
Initiative
(2010)
GRI
report
list.
Available
in
<http://www.globalreporting.org/GRIReports/GRIReportsList/>. Accessed on the 10th Oct
2010.
Gujarati, D. N. (2006). Econometria Básica. Tradução por Maria José Cyhlar Monteiro.
Elsevier, Rio de Janeiro.
Hair, Jr, J. F.; Anderson, R. E.; Tatham, R. L.; Black, W. C. (2005) Análise multivariada de
dados. Tradução por Adonai Schlup Sant’Ana e Anselmo Chaves Neto. Bookman, Porto
Alegre.
Hendriksen, E. S.; Breda, M. F. V. (1992) Accounting theory.5. McGraw-Hill, USA.
Horngren, C. T., Foster, G., Datar, S. M. (2000). Cost accounting: a managerial emphasis,
Prentice Hall, USA.
Jose, A.; Lee, S. (2007) Environmental reporting of global corporations: A content analysis
based on website disclosures. Journal of Business Ethics. 72, 307–321.
KPMG Internacional (2005) KPMG International Survey of Corporate Responsibility
Reporting 2005. June, 1-55.
Lima, G. A. S. F. (2007) Utilização da teoria da divulgação para avaliação da relação do
nível de disclosure com o custo da dívida das empresas brasileiras. Tese. Doutorado em
Controladoria e Contabilidade. Faculdade de Economia e Administração. Universidade de São
Paulo, 118p.
Liu, X., Anbumozhi, V. (2009) Determinant factors of corporate environmental information
disclosure: an empirical study of Chinese listed companies. Journal of Cleaner Production, 17
(6), 593-600.
Maroco, J.; Garcia-Marques, T. (2006) Qual a fiabilidade do alfa de Cronbach? Questões
antigas e soluções modernas? Laboratório de Psicologia, 4 (1), 65-90.
Martins, G. A.; Theóphilo, C. R. (2007) Metodologia da investigação científica para ciências
sociais aplicadas. São Paulo: Atlas.
Mebratu, D. (1998) Sustainability and sustainable development: historical and conceptual
review. Environmental Impact Assesment Review, 18, 493–520.
Murcia, F. D. (2009) Fatores determinantes do nível de disclosure voluntário de companhias
abertas no Brasil. 181p. Tese (Doutorado em Controladoria e Contabilidade). Faculdade de
Economia e Administração. Universidade de São Paulo.
Oliveira, J. A. P. (2005) Uma avaliação dos balanços sociais das 500 maiores. RAE eletrônica,
Fundação
Getúlio
Vargas,
4
(1).
Available
in:
<http://www.scielo.br/pdf/%0D/raeel/v4n1/v4n1a02.pdf>. Accessed on the 15th Dec. 2010.
Pestana, M. H.; Gageiro, J. N. (2008) Análise de dados para ciências sociais - a
complementariedade do SPSS. Lisboa:Sílabo.
Riahi-Belkaoui, A. (2004) Accounting theory. 5. Cengage Learning, USA.
Richardson, R. J. (2009) Pesquisa social: métodos e técnicas. Brazil:Atlas.
19 Rover, S.; Tomazzia, E. C.; Murcia, F. D.; Borba, J. A. (2009) Explicações para a divulgação
voluntária ambiental no Brasil utilizando análise de regressão em painel. In: III Congresso
IAAER : ANPCONT, Brazil.
Rover, S.; Alves, J. L.; Borba, J. A. (2005). Análise do conteúdo ambiental das demonstrações
contábeis publicadas no Brasil e nos Estados Unidos: um estudo nas companhias com ADR
nível III. In: 5° Congresso USP de Controladoria e Contabilidade, Brazil.
Sangle, S.; Babu, P. R. (2007) Evaluating sustainability practices in terms of stakeholders’
satisfaction. International Journal Business Governance and Ethics, 3(1), 56-76.
Santos, A. (2007) Demonstração do valor adicionado: como elaborar e analisar a DVA. São
Paulo: Atlas.
Sarmento, M.; Durão, D. (2009) Comparative study of environmental strategies: The case of
Portuguese industries. Energy.
Schaltegger, S., Burritt, R. L. (2009). Sustainability accounting for companies: Catchphrase or
decision support for business leaders? Journal of World Business, 1-10.
Silva, C. R., Gobbi, B. C., Simão, A. A. (2005) O uso da análise de conteúdo como uma ferramenta
para a pesquisa qualitativa: descrição e aplicação do método. Revista Organizações Rurais &
Agroindustriais Lavras, 7 (1), 70-81.
Skouloudis, A., Evangelinos, K., Kourmousis, F. (2010) Assessing non-financial reports
according to the Global Reporting Initiative guidelines: evidence from Greece. Journal of
Cleaner Production. 18, 426–438.
Simnett, R.; Vanstraelen, A.; Chua W. F. (2009) Assurance on sustainability reports: an
international comparison. The Accounting Review. 84, 937-967.
UCLA Academic Technology Services (2011) Descriptive statistics. UCLA Researchers ,
University
of
California,
Los
Angeles.
Available
in:
<http://www.ats.ucla.edu/stat/spss/output/descriptives.htm>. Accessed on the 10th Jan. 2011.
Wooldridge, J. M. (2007) Introdução à econometria: uma abordagem moderna. Tradução por
Rogério Cezar de Souza, José Antônio Ferreira. Thomson Learning, São Paulo.
20
Download