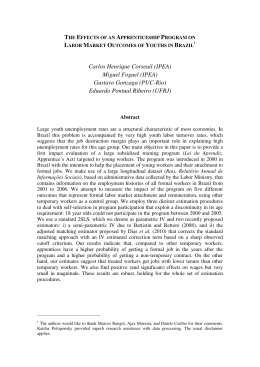
Vocational Training and Labor Market Outcomes in Brazil Mauricio Reis Julho, 2012 Working Paper 045 Todos os direitos reservados. É proibida a reprodução parcial ou integral do conteúdo deste documento por qualquer meio de distribuição, digital ou impresso, sem a expressa autorização do REAP ou de seu autor. VOCATIONAL TRAINING AND LABOR MARKET OUTCOMES IN BRAZIL Mauricio Reis Mauricio Reis Instituto de Pesquisa Econômica Aplicada (IPEA) Brasília, DF, Brasil Vocational training and labor market outcomes in Brazil Mauricio Reis Instituto de Pesquisa Economica Aplicada Abstract This paper examines the effect of vocational training on labor market outcomes in Brazil. The empirical analysis uses data representative of the Brazilian metropolitan areas, and estimates based on propensity score matching indicate that vocational training increases labor earnings as well as the probabilities of employment and formal employment. Also according to the results, this kind of training seems to be more effective for less educated workers and for those with more labor market experience. Keywords: Vocational training, labor earnings, employment. JEL Classification: J24, J31, J60. 1 – Introduction Vocational training could be a way of increasing workers’ skills and productivity in the labor market. This kind of human capital accumulation may be particularly important in a developing country, where the labor force comprises a high share of unskilled workers with low levels of formal education. In spite of improvements verified over time, the level of formal education is still low and very unequally distributed among Brazilian workers. Mean years of schooling increased from 9.1 in 2003 to 10.3 in 2011, but almost 25% of the Brazilian labor force in metropolitan areas had less than 8 years of schooling in this last period. In this setting, vocational training may have an important role, providing skills in specific occupations, in particular for unskilled workers who are less likely to get back to school to acquire more formal education and for those without a job, improving their labor market perspectives. This 1 paper attempts to estimate the effect of vocational training on labor market outcomes, represented by employment, formal employment and labor earnings, for Brazilian workers who have lost their jobs. There is a large body of evidence about the effectiveness of training programs in developed countries, and the estimated impacts on labor market outcomes are generally modest (see, for example, Heckman et al., 1999 and Kluve, 2010 for surveys). However, evidence from developing countries, although relatively scarce, indicates that training effects are very different compared to estimates from developed countries. Betcherman et al. (2004) review a number of studies about training programs and argue that the effects of these programs are more pronounced in developing countries than in the US and in Europe. Attanasio et al. (2011), making use of experimental data, estimate the impact of vocational training on Colombian unemployed and poor youths and show that training has positive effects on many labor market outcomes for women, but more limited impacts on men. Nõpo et al. (2007) find that ProJoven, a Peruvian job training program for poor youths, also has positive effects on labor market, in particular for women. Nevertheless, Card et al. (2011) present an evaluation based on an experimental design for job training targeted at less educated and poor youths in the Dominican Republic, and the estimated effects on employment and earnings are nonsignificant. In Brazil, PLANFOR (National Plan for Professional Qualification) was an initiative implemented in the 1990s to provide vocational training. Although the program had an experimental design, it did not succeed in following individuals in treatment and control groups, as pointed out by Hermetto and Rios-Netto (2007). These authors investigate the impact of PLANFOR in the municipality of Belo Horizonte, and show that the length of unemployment decreased. Severnini and Orellano (2010), based on cross-sectional data for the Brazilian Southeast and Northeast regions, which represent about three quarters of the country’s labor force, present evidence that vocational training is associated with higher earnings and employment probability. The empirical analysis in this paper uses data from the Monthly Employment Survey (Pesquisa Mensal de Emprego - PME), a longitudinal survey representative of the Brazilian metropolitan areas, to estimate the impact of vocational training on labor market outcomes for unemployed workers. Estimates based on propensity score matching suggest that this kind of training increases the employment probability by approximately 6 percentage points. Results for labor earnings usually also indicate 2 positive effects, but estimates are very heterogeneous depending on the estimation method. According to the main results, earnings increase between R$ 70 and R$ 175, corresponding to around 18% and 45% of the mean labor earnings of individuals without vocational training. There is also evidence of positive effects of training on the probability of formal employment, with estimates corresponding to changes between 3.1 and 7.3 percentage points. The estimated impacts of vocational training programs seem to be very heterogeneous among demographic and skill groups, suggesting that the effects are more pronounced for less educated individuals and workers aged 36 years or more. The paper is organized as follows. Section 2 describes the dataset and presents some summary statistics. Section 3 describes the empirical strategy, and Section 4 reports and comments on the estimated results. Section 5 contains the main conclusions of the paper. 2 – Data The empirical analysis in this paper uses data from the PME), which is conducted by the Brazilian Census Bureau (Instituto Brasileiro de Geografia e Estatística - IBGE). Every month, information about 100,000 individuals aged 10 years or more is collected by the survey in the six main metropolitan areas of the country.1 Each household that enters the survey is interviewed for four consecutive months, not interviewed for the next eight months, and interviewed once again for the next four months. Therefore, it is possible to follow the same individual for 16 months. The PME contains information about individual characteristics, such as schooling, age, gender, race and region of residence. The survey also provides many labor market variables, such as labor earnings, employment status and job duration. In each interview, the PME also collects some variables related to attendance and completion of vocational training. The IBGE defines vocational training as an activity dedicated to providing skills for a specific occupation. This kind of training usually has a low duration and could be provided by schools or other institutions (e.g., churches, 1 Belo Horizonte, Porto Alegre, Recife, Rio de Janeiro, São Paulo and Salvador. The PME is representative of the Brazilian metropolitan areas. About 25% of the Brazilian individuals aged between 21 and 54 years live in one of these six metropolitan areas. 3 unions and NGOs). The programs focus on practical applications of skills learned through classroom instruction and a certification is granted upon completion of the course. The educational level required to attend vocational training is very heterogeneous and usually low on average. Computer literacy, language, seamstress, cook, massage therapist, secretary, manicurist, pedicurist, hairdresser, waiter, chef, tour guide, bricklayer, cake decorator, makeup artist and surgical technologist courses are a few examples of vocational training programs. The analysis in this paper uses data from March 2002, when the new version of the PME was implemented, to March 2012, for individuals aged 21 to 54 years at the time of their first interview. The sample contains individuals who were occupied during their first interview and became unemployed or out of the labor force three months later, in the fourth interview. At the time of the first interview, the sample is restricted to those who have never completed a vocational training program before.2 In the fifth interview, the individuals could be divided into two groups, those who did a vocational training program and those who did not. There are 1,217 individuals in the former group and 6,574 individuals in the latter. The basic idea of the empirical analysis, as will be explained in Section 3, is to compare labor market outcomes between these two groups one year after their first interview. Table 1 displays the descriptive statistics for sampled individuals separately for those in treatment (with vocational training in the fifth interview) and control (without training) groups. About 15% of the individuals in the sample completed a vocational training program between the first and fifth interviews. As shown in Table 1, workers with vocational training have higher average educational level (10.2 years) than those who did not complete training (7.7). At the time of the first interview, mean earnings were higher for individuals with vocational training (R$ 911) compared to those without training (R$ 637). Proportions of women and blacks are greater in column (1), and mean age is also higher among those without training. 2 The PME does not ask about the number of programs the individual completed and the date at which the last training program was completed. Thus, it is not possible to know whether an individual who had vocational training at the time of the first interview completed or not another program of this type during the next year. 4 Table 1: Descriptive statistics (1) (2) Individuals who did not Individuals who did complete a vocational complete a vocational training between the first training between the first and fifth PM E interviews and fifth PM E interviews 36.47 7.74 46.40 61.14 636.66 34.77 10.24 40.00 56.76 910.96 18.28 9.79 22.97 48.93 19.23 5.40 20.45 54.92 2.45 31.31 34.53 29.92 1.79 49.53 2.96 40.63 28.34 25.19 2.89 48.56 - 29.10 13.24 27.02 26.83 3.81 385.50 701.74 54.93 21.91 6,574 631.42 988.11 63.90 33.57 1,217 Age (years) Years of schooling Black (%) Woman (%) Labor Earnings in the first interview (R$) Industry in the first interview (%) M anufacture Construction Commerce services Employment status in the first interview (%) Employer Formal employee Informal employee Self-employed Public worker Job duration in the first interview (months) Educational level required to attend the vocational training (%) One year of schooling Four years of schooling Primary degree Secundary degree University degree Labor market outcomes (fifth interview) Labor earnings (R$) Labor earnings (R$) - occupied only Occupied (%) Occupied in the formal sector (%) Observations Source: PM E. Sample: Individuals aged 21 to 54 years, who were occupied in the first PM E interview and lost their jobs three months later. The sample contains only individuals who have never completed a vocational training program at the time of the first PM E interview 5 Table 1 shows that individuals who completed a vocational training program were more concentrated in manufacture and service sectors at the time of the first interview, especially in the latter one, while those without training were more strongly represented in construction and commerce. Mean job duration was fairly similar for workers in both columns, and informal employees and self-employed workers in the first interview were more concentrated among individuals without training in column (1). In addition, Table 1 reports the educational level required to attend vocational training for those who completed a program of this type. In almost half of the cases, training required only four years of completed schooling. Table 1 also shows that 64% of the workers with vocational training were occupied in the fifth interview, which is about 10 percentage points higher compared to those without training. In this paper, formal employees, public workers and employers are classified as formal workers , while informal employees and self-employed workers are classified into the informal sector. The difference in terms of formal employment between individuals with vocational training in the fifth interview and those without this kind of training is 12 percentage points. In addition, it is possible to notice that mean labor earnings dropped 31% in the former group and 40% among those in the latter one during the period of one year.3 These changes reflect modifications in employment status and earnings. However, considering only individuals who were occupied in the fifth interview, mean earnings improved 8.5% for workers with training and 10% for those without vocational training between the first and fifth interviews. Table 2 presents information about vocational training in Brazil from the 2007 PNAD (Pesquisa Nacional por Amostra de Domicilios).4 About 19% of the individuals aged between 21 and 54 years have attended a program of this type before, and more than 90% of those who have attended vocational training actually completed the program. According to Table 2, more than half of the programs are privately provided; but national training institutes (SENAI, SENAC, SEBRAE, and others) and government programs also have important contributions, with shares corresponding to 27% and 16% of the total. Almost all training programs require class attendance and two thirds of the training is done during the day. Also, the distribution of schooling level required to 3 Labor earnings is represented in November 2011 Reais, using the INPC (National Consumer Price Index) calculated by the IBGE to adjust for inflation. 4 PNAD, the Brazilian National Household Survey, is a nationally representative survey, which provided a supplement related to vocational training in 2007. 6 attend the programs is similar to that in Table 1. Computer literacy represents 30% of the courses for those who have attended a vocational training program before, while programs that focus on commerce and manufacturing activities account for 22.3% and 16.6, respectively.5 Table 2: Summary statistics for individuals who have attended a vocational training program in Brazil from the 2007 PNAD Instutite that provided the training (%) National training Institutes 27.04 (SENAI, SENAC, SEBRAE, ...) Government Programs 15.94 Private programs 52.34 Others 4.68 Required attendance at classes (%) Day Course (%) Evening Course (%) 97.31 65.27 34.73 Lower level of education required (%) One years Four years Eight years Eleven years University degree 27.94 17.02 28.31 23.01 3.72 Course type (%) Health and welfare services Computer literacy Construction techniques Manufacturing activities Hairdresser and beauty Commerce activities Others 8.24 29.95 2.77 16.61 6.63 13.5 22.29 Conclued the program (%) 91.46 Observations 35,525 Source: The 2007 PNAD. Sample: Individuals aged 21 to 54 years, who attended one or more vocational training programs in September 2007. 5 For those who have attended two or more training programs before, information refers to the one considered to be the most important by the individual. 7 3 – Empirical strategy This section briefly describes propensity score matching estimators, which are applied in this paper to the PME data.6 Let Y1 be a labor market outcome (earnings, employment or formal employment) for those who participated in vocational training, while Y0 represents the outcome conditional on non-participation. Because only Y1 or Y0 is available for each individual, the impact of participating in the training, Y1-Y0, is not observed. The average treatment effect on the treated (ATT), the most common parameter of interest in evaluations, is given by: (1) ( ) ( ) ( ), where T=1 for those who did the training and T=0 for those who did not do vocational training. The term ( ) is not observable, and further hypotheses are necessary to estimate the ATT. In most experimental analyses, for example, the randomly defined control group provides an estimate of ( ).7 According to matching estimators, used in this paper, each training participant is compared with a non-participant with similar observable attributes. Matching estimators assume that, conditional on observable characteristics Z, the outcome Y0 is independent of T: (2) ┴T|Z If the parameter of interest is the average treatment effect, a weaker assumption, named mean conditional independence, is sufficient. Then, equation (2) could be replaced with the following hypotheses: (3) ( ) ( ) 6 See, for example, Smith and Todd (2005) for more details about propensity score matching estimators. 7 Note that the bias in estimating ATT is given by ( 8 ) ( ). Matching estimators also require that there be a non-participant analogue, given the attributes in Z, for each participant. That is: ( (4) ) ( Then, under assumptions (3) and (4), [ ( [ )] ( (5) ) ( ) could be estimated by )], and the ATT can be written as: ( ) [ ( )], where the second term on the right-hand side of equation (5) represents the mean outcome of the matched comparison group that can be obtained using characteristics in Z. Rosenbaum and Rubin (1983) show that: ( (6) ( ( )) ( ( ) ( ) ) ( )) Then, ( ( ) implies ( )). According to this result, when Y0 is independent of training ( ( )) participation conditional on Z, it is also independent of participation conditional on the ( propensity score, ), and the dimension of the conditioning problem is diminished by matching on the propensity score. Therefore, individuals with different ( values of Z but the same value of ) are combined in the propensity score matching. A matching estimator can be written as: (7) where: ∑ ̂( ̂( [ ( ( )) ∑ ))], ( ) , I1 represents the set of individuals who did the training and I0 is the set of non-participants in training, Sp is the region of common support, and N1 is the number of individuals in the set . The labor market outcome for an individual i who did training is given by Y1i, while Y0j 9 represents the outcome for an individual j who did not complete a training program. According to equation (7), the match for each individual in the set is given by a weighted average over the values of non-participants. ( The weights ( ) depend on the distance between ( ) and ). Four different methods are used in this paper to calculate these weights. The nearest neighbor matching selects the non-participant for whom the value of ( ) be the set of individuals Pj is closest to Pi as the match. Let those in the set matched to . The nearest neighbor matching sets: (8) C( ) In radius matching, a match for individual i is selected only if the propensity score falls within a radius r from Pi: (9) ( ) [ | | ], The radius r is set to 0.001 and 0.0001. In both nearest neighbor and radius ( matching, weights are defined such that otherwise, where ) ( ) and ( ) is the number of individuals in I0 matched with those in I1. The kernel matching estimator can be written as: (10) =( ) ∑ [ ∑ ( ∑ ( ) ) ], where G( ) is a kernel function and hn is a bandwidth parameter. Then, the weight depends on the distance between each comparison group observation and the participant for which the counterfactual is being calculated. Estimates are also obtained using the stratification matching, which is defined in the following way. Let q denote the blocks defined over intervals of the propensity score, where the covariates are balanced in each of these blocks, that is, for each covariate there is no significant difference between the groups. For each block, it is possible to compute: 10 ∑ (11) ∑ ( ) ( ) , where I(q) contains the individuals in block q, and N1,q and N0,q represent the number of participants and non-participants in block q. Denoting the number of blocks by Q, the stratification matching is given by: (12) ∑ ∑ ( ) ∑ There is intense debate in the literature about whether propensity score matching and other non-experimental methods help to solve the selection bias problem present in program evaluation.8 Heckman et al. (1997) and Heckman et al. (1998) argue that bias in propensity score matching tends to be low when data on participants and nonparticipants are drawn from the same data source, both groups reside in the same local labor market, and the data contain a rich set of variables that influence both program participation and labor market outcomes. PME data are collected in different geographic areas, and then, the results presented in this paper should be interpreted with caution, because local labor markets could be different for workers in both groups. However, the empirical analysis benefits from the following characteristics of the dataset: all sampled individuals, in control and treatment groups, answer the same survey, and PME data contain a number of variables that can be included in Z as determinants of program participation, such as individual characteristics and information about the job in the first interview. In addition, the fact that the sample includes only workers who lost their jobs between the first and fourth interviews may reduce the heterogeneity due to unobservable characteristics. 8 See Ashenfelter (1985), LaLonde (1986), Dehejia and Wabba (1999), Heckman et al. (1997), Heckman et al. (1998), Smith and Todd (2005), among many others. 11 4 – Results 4.1 – Propensity score Table 3 presents the estimates of the propensity score. The probability that an individual who lost his/her job has completed vocational training one year after his/her first PME interview, ( ), is estimated using the logit model. Column (1) reports the estimated coefficients and t-statistics for the total sample, and columns (2) to (7) show the results for subsamples defined by education, gender, and age. In all regressions in Table 3, the following variables are included in Z: age, age squared, years of schooling, years of schooling squared, a dummy for black individuals, year dummies, and dummies for region of residence, and variables referring to individuals’ first interview, such as labor earnings, job duration and dummies for industry and employment status (formal employee or public worker, self-employed and informal employee, while employer is the reference group). A dummy for female is also included, except in regressions by gender in columns (4) and (5). Those variables are present in all equations, but the exact specification in each case depends on the balancing test, which is calculated in the following way (see Smith and Todd, 2005). Observations are divided into strata, chosen such that the means of the propensity scores in groups with T=1 and T=0 are not different within strata. Then, differences in each variable in Z within each stratum are tested between individuals with T=1 and T=0 through t-tests. In the case of significant differences in one or more variables, highorder and interactive terms are added to Z. This procedure is repeated until differences are non-significant for each variable and stratum. The results in column (1) show that more educated individuals who became unemployed or inactive are more likely to do a vocational training program, and that this relationship is nonlinear. The probability of an individual having completed a training program is higher for those who had higher earnings at the time of the first interview. Also according to estimates, women seem to be less likely to do a vocational training program. As to the differences regarding the industrial sector of the job in the first interview, evidence in column (1) indicates that those who were occupied in the manufacture, commerce and service sectors have a higher probability of completing a vocational training program than individuals who were occupied in construction. 12 Table 3: Propensity score Estimated coefficients for logit regressions using conclusion of vocational training as dependent variable (1) Total Age Age squared Years of schooling Years of schooling squared Black Woman Labor Earnings/1000 Manufactury Commerce services Formal employee Informal employee Self-employed Job tenure (months) Pseudo R-squared Observations (2) (3) Schooling (4) (5) (6) Gender 0-10 11 or more Women Men 0.018 [0.62] 0.000 [0.49] 0.469 [9.77]*** -0.015 [6.09]*** 0.033 [0.44] -0.283 [3.97]*** 0.101 [2.45]** 0.361 [2.31]** 0.265 [1.73]* 0.509 [3.50]*** 0.256 [1.16] -0.067 [0.29] 0.015 [0.06] -0.001 [1.49] 0.057 [1.27] -0.001 [1.08] 0.162 [1.63] 0.008 [0.97] -0.044 [0.39] -0.656 [5.73]*** 0.275 [2.83]*** 0.546 [2.78]*** 0.243 [1.23] 0.633 [3.46]*** 0.199 [0.55] -0.078 [0.21] 0.187 [0.52] -0.001 [1.01] 0.021 [0.55] 0.000 [0.58] -0.453 [0.73] 0.017 [0.74] 0.106 [1.04] -0.015 [0.16] 0.083 [1.75]* 0.394 [1.41] 0.446 [1.64] 0.649 [2.47]** 0.319 [1.12] 0.088 [0.30] 0.218 [0.75] 0.000 [0.10] -0.022 [0.59] 0.000 [0.58] 0.568 [8.24]*** -0.019 [5.39]*** 0.029 [0.29] - 0.07 [1.62] -0.001 [1.43] 0.259 [1.53] 0.003 [0.15] 0.068 [0.59] - 0.107 7,780 0.100 4,997 0.033 2,783 0.121 4,670 0.046 [0.82] 0.47 [1.01] 0.333 [0.72] 0.579 [1.27] 0.408 [1.41] -0.056 [0.19] 0.301 [1.03] 0.000 [0.04] (7) Age 21-35 0.034 [0.23] -0.001 [0.25] 0.573 [6.64]*** -0.02 [4.61]*** 0.103 [1.01] -0.126 [1.30] 0.173 0.162 [2.77]*** [2.05]** 0.376 0.157 [2.01]** [0.72] 0.286 0.171 [1.59] [0.81] 0.611 0.339 [3.77]*** [1.69]* 0.023 0.329 [0.07] [0.84] -0.029 -0.002 [0.08] [0.00] -0.12 0.196 [0.34] [0.49] -0.001 0.001 [1.10] [0.50] 0.100 3,110 0.102 3,801 36-54 0.088 [0.53] -0.001 [0.56] 0.425 [7.04]*** -0.014 [4.10]*** -0.044 [0.39] -0.491 [4.56]*** 0.078 [1.61] 0.606 [2.70]*** 0.386 [1.73]* 0.717 [3.39]*** 0.184 [0.67] -0.057 [0.20] 0.108 [0.40] 0.000 [0.57] 0.115 3,979 Regressions include dummies for metropolitan area and dummies for year. In order to satisfy the balancing property, column (1) also includes interactions between job duration in the first interview and dummies for self-employed and Porto Alegre and an interactive term between job duration squared and self-employed, while column (5) adds a cubic in years of schooling. Regressions are estimated by logit model and t-statistics are presented in parentheses. Figure 1 shows the distributions of the propensity scores for the total sample, that is, the predicted probabilities of completing a vocational training program, for individuals for whom T=1 and those for whom T=0. The distribution of propensity scores among those in the latter group lies to the left of the distribution for individuals in the former group. Sample size reduction, because of the common support condition, is very small and both groups are represented in a large part of the distributions. The 13 number of observations drops from 7,780 to 7,735 when imposing the common support restriction. Figure 1: Distribution of the predicted probability of complete a vocational training 25 20 15 10 5 0 0.00-0.05 0.10-0.15 0.20-0.25 0.30-0.35 0.40-0.45 0.5-0.55 0.60-0.65 0.70-0.75 0.80-0.85 0.90-0.95 Predicted probabilities Without vocational training With vocational training Note: The predicted probabilities are calculated using the logit regression in column (1) of Table 3. Columns (2) to (7) report the results for demographic and skill groups. The relationship between training probability and schooling is similar to that estimated for the total sample, except in columns (2) and (3), where individuals are separated by educational groups, and among men in column (5). Women are less likely to do a vocational training program among less educated and older workers, and labor earnings have positive and significant coefficients in most of the cases. Table 3 also shows that industry affiliation in the first PME interview is related to differences in training probability in almost all demographic and educational groups. 4.2 – Main results Panel A of Table 4 presents the matching estimates using an indicator of employment in the fifth interview to represent labor market outcome. The estimated coefficients are positively significant for all matching methods reported, indicating that individuals with vocational training have higher probability of employment.9 Estimated 9 Standard errors are calculated through bootstrapping with 500 replications. 14 coefficients range between 5.4 percentage points (nearest neighbor matching) and 6.4 percentage points (radius matching with r=0.001). Table 4: Vocational training and labor market outcomes (Matching estimators) (1) (2) (3) (4) (5) Matching methods Nearest neighbor Radius (0.001) Radius (0.0001) Kernel Stratification Panel A: Employment Mean 0.054 0.064 0.057 0.057 0.055 S.E. (0.026) (0.017) (0.025) (0.016) (0.015) Panel B: Earnings Mean 55.68 S.E. (42.49) 174.68 (25.76) 106.47 (35.59) 104.64 (25.92) 69.73 (30.42) Panel C: Formal employment Mean 0.020 S.E. (0.024) 0.073 (0.015) 0.061 (0.024) 0.044 (0.014) 0.031 (0.015) 1,201 6,259 1,010 2,589 1,216 6,519 1,216 6,519 Observations Treatment Control 1,216 990 Note: Estimated standard errors are presented in parentheses. Standard errors are calculated using a bootstrap procedure with 500 replications. All estimates use the common support condition. Panel B of Table 4 shows the results for labor earnings. Except for nearest neighbor matching in column (1), the estimated coefficients are also significant in all columns, indicating that monthly labor earnings increase between R$ 70 and R$ 175 as a consequence of vocational training. Estimated earnings increases correspond to changes between 18% and 45% of the mean earnings of those without vocational training. Then, Panel B suggests that training has a positive impact on labor earnings, although it seems to be very heterogeneous depending on the matching method. Panel C presents estimates using formal employment as labor market outcome. According to the evidence in columns (2) to (5), vocational training increases the probability of getting a formal job. Only in column (1), which reports the result using nearest neighbor matching, the coefficient is non-significant. Considering only the significant cases, the estimated coefficients range from 0.031 in column (5) to 0.073 in column (2). 15 Summarizing, the results in Table 4 show that training is positively associated with employment probability, earnings, and probability of getting a formal job.10 Although estimates are very heterogeneous, especially in the cases of earnings and formal employment, the results usually indicate that vocational training effects in Brazil are slightly higher than those obtained for other developing countries. Attanasio et al. (2011) show that training increases employment by 4.1 percentage points and labor earnings by 12%, and the probability of getting a formal job by about 6 percentage points in Colombia. Ñopo et al. (2007) also find positive impacts for Peru, where the results show that the ProJoven increased the employment probability by 3 percentage points and labor earnings by 32%. However, Card et al. (2011) do not find positive effects of training on labor market outcomes for the Dominican Republic. 4.3 – Demographic and skill groups The literature usually presents evidence that the impacts of training programs on labor market outcomes are very different for demographic and skill groups (Heckman et al., 1999). In order to investigate this issue in Brazil, this subsection reports estimates similar to those in Table 4 for subgroups defined by schooling, age, and gender. Table 5 presents estimates of vocational training effects on employment, earnings, and formal employment by educational level. Workers are classified into two groups: those with less than 11 years of schooling and those who finished high school, that is, with 11 or more years of schooling. Each panel shows the results for a different labor market outcome. Results in Panel A suggest that vocational training increases the employment probability for less educated workers in four out of five specifications, with estimated effects ranging between 5.4 and 10.7 percentage points. Regarding the estimated coefficients for more educated individuals, they are significant in columns 10 As a robustness check, training effects were estimated using a sample of individuals who were occupied in the first interview and became unemployed or out of the labor force in the second interview. The results indicated that training increases employment probability by 9 percentage points, labor earnings by R$ 200 and formal employment between 4.4 and 7.5 percentage points. Also as a robustness test, the cause of displacement between the first and fourth PME interviews was included in Z, in spite of the high incidence of missing values for this variable. Estimates in this case were quite similar to those reported in Table 4. 16 (2), (4) and (5), and indicate lower impacts on employment than those obtained for less educated individuals. Table 5: Vocational training and employment by educational groups (Matching estimators) (1) (2) (3) (4) (5) Matching methods Nearest neighbor Radius (0.001) Radius (0.0001) Kernel Stratification Panel A: Employment Years of schooling: <11 Mean 0.040 0.073 0.107 0.069 0.054 S.E. (0.039) (0.026) (0.040) (0.024) (0.025) Years of schooling: >=11 Mean 0.015 0.055 0.000 0.050 0.043 S.E. (0.033) (0.025) (0.045) (0.023) (0.021) Panel B: Earnings Years of schooling: <11 Mean 70.56 S.E. (42.244) Years of schooling: >=11 Mean 48.478 S.E. (65.748) 137.66 (26.730) 141.50 (37.488) 102.65 (26.660) 72.53 (27.368) 112.906 (48.471) 32.011 (81.716) 96.715 (39.064) 67.948 (43.748) 0.083 (0.024) 0.100 (0.035) 0.054 (0.022) 0.033 (0.023) 0.044 (0.023) 0.02 (0.043) 0.031 (0.019) 0.017 (0.021) 458 4,153 350 1,278 480 4,403 479 4,387 724 1,923 486 742 736 2,046 735 2,047 Panel C: Formal employment Years of schooling: <11 Mean 0.017 S.E. (0.035) Years of schooling: >=11 Mean 0.011 S.E. (0.032) Observations Years of schooling: <11 Treatment 480 Control 423 Years of schooling: >= 11 Treatment 736 Control 553 Note: Estimated standard errors are presented in parentheses. Standard errors are calculated using a bootstrap procedure with 500 replications. All estimates use the common support condition. According to Panel B, which reports the results for labor earnings, vocational training is significant in all cases among less educated individuals, with the estimated effects being on the interval between R$ 71 and R$ 142, which correspond to changes 17 between 23% and 47% relative to the mean earnings of less educated workers without vocational training. The results for more educated workers are significant in two specifications that indicate earnings increases of R$ 97 and R$ 113. These values correspond to 18% and 21% of the mean earnings of more educated individuals without vocational training. Panel C shows that vocational training is positively related to the probability of getting a formal job among less educated workers in columns (2), (3) and (4). For more educated individuals, the estimated coefficient is significant only in column (2). This evidence in favor of less educated workers can be reinforced by the fact that only about 30% of the individuals in the sample with less than 11 years of schooling were occupied in the formal sector in the first interview, while this proportion was 50% among more educated workers. Regarding this latter group, although evidence in Panel A indicates that training improves employment probability among more educated workers, it seems that these transitions are more associated with informal jobs than with formal ones. The results in Table 5 suggest that vocational training improves labor market outcomes for less educated workers. For more educated ones, however, evidence shows non-significant or more modest effects. According to Heckman et al. (1999), evidence from developed countries does not show different impacts of training by education, while Card et al. (2011) estimate larger effects on earnings for better-educated workers in the Dominican Republic. More pronounced effects of vocational training among less educated workers estimated in this paper could be due to the characteristics of this kind of program in Brazil. The training programs considered in the analysis have short durations and usually provide skills in very simple occupations. For individuals who finished high school, these programs may represent a small improvement, but for less educated workers this training may represent an important accumulation of human capital. Table 6 presents the estimated results by gender. According to Panel A, vocational training increases the employment probability for women between 5.0 and 6.6 percentage points in columns (2), (4) and (5), but the results are non-significant for radius (r=0.0001) and nearest neighbor matching. Estimated coefficients for men are significant only in columns (4) and (5), but it is not clear whether women have a better performance than men. 18 Table 6: Vocational training and employment by gender (Matching estimators) (1) (2) (3) (4) (5) Matching methods Nearest neighbor Radius (0.001) Radius (0.0001) Kernel Stratification Panel A: Employment Woman Mean 0.023 0.066 0.068 0.054 0.050 S.E. (0.036) (0.023) (0.044) (0.021) (0.024) Man Mean 0.047 0.043 0.064 0.053 0.051 S.E. (0.038) (0.027) (0.054) (0.022) (0.024) Panel B: Earnings Woman Mean 11.91 S.E. (57.920) Man Mean 106.94 S.E. (68.408) 145.32 (31.823) 88.47 (51.443) 73.84 (32.250) 48.34 (35.728) 160.25 (43.695) 164.28 (85.232) 140.01 (40.595) 114.65 (51.349) 0.064 (0.020) 0.028 (0.035) 0.037 (0.017) 0.023 (0.018) 0.057 (0.027) 0.038 (0.055) 0.048 (0.022) 0.039 (0.024) 687 562 671 3,618 454 966 687 3,923 687 3,923 529 426 511 2,120 320 491 529 2,556 529 2,556 Panel C: Formal employment Woman Mean -0.003 S.E. (0.029) Man Mean -0.013 S.E. (0.039) Observations Woman Treatment Control Man Treatment Control Note: Estimated standard errors are presented in parentheses. Standard errors are calculated using a bootstrap procedure with 500 replications. All estimates use the common support condition. In Panel B, the estimated effect of training on earnings is positive and significant for women in column (2), where the coefficient is R$ 145, and in column (4), where the coefficient indicates that earnings increase R$ 74 for those who complete a vocational training program. The estimated coefficient for women is also significant in column (3). The results for men show significant coefficients in four columns, with estimates 19 ranging from R$ 115 to R$ 164. However, considering only the significant coefficients, relative changes are more favorable for women, representing increases between 24% and 48%, while improvements for men represent modifications between 22% and 32% of the mean labor earnings among those in this group without training. For both women and men, the estimated effects of vocational training on formal employment are significant only using radius (r=0.001) and kernel matching in Panel C. In these cases, evidence indicates that training increases the probability of getting a formal job between 3.7 and 6.4 percentage points among women, and between 4.8 and 5.7 percentage points among men. The results are non-significant in all other matching methods reported in Panel C of Table 6. Evidence from other countries shows that vocational training seems to have a larger impact on women than on men. This is verified in developed (Heckman et al., 1999) and developing countries (Attanasio et al., 2011 and Ñopo et al., 2007), although Card et al. (2011) do not find differences by gender for the Dominican Republic. The results in Table 6 also indicate that training program effects do not seem to be different by gender groups in Brazil, except when labor market outcome is represented by earnings. In the latter case, estimated effects are more pronounced, in relative terms, for women. Table 7 shows estimates by age groups. Panel A indicates that vocational training increases employment probability from 5.1 percentage points in column (2) to 6.4 percentage points in column (1) among workers aged between 21 and 35 years. The estimated coefficients are also significant using kernel and stratification matching in columns (4) and (5). Considering individuals aged between 36 and 54 years, evidence indicates that training increases the employment probability between 5.0 and 7.7 percentage points. In this case, the estimated coefficients are significant for all matching methods reported. About the effect of training on labor earnings, Panel B of Table 7 presents significant coefficients for younger workers in columns (2) and (4), while results are significant in three out of five cases among older individuals. The estimated effects for the former group range from R$ 79 and R$ 114, and those obtained for the latter group range from R$ 127 to R$ 190. These values correspond to changes between 20% and 29% among younger individuals, and between 34% and 50% among the older ones. 20 Table 7: Vocational training and employment by age groups (Matching estimators) (1) (2) (3) (4) (5) Matching methods Nearest neighbor Radius (0.001) Radius (0.0001) Kernel Stratification Panel A: Employment Age: 21-35 Mean 0.064 0.051 0.067 0.054 0.052 S.E. (0.035) (0.025) (0.048) (0.021) (0.022) Age: 36-54 Mean 0.060 0.069 0.077 0.059 0.050 S.E. (0.036) (0.027) (0.045) (0.024) (0.025) Panel B: Earnings Age: 21-35 Mean 45.018 S.E. (56.735) Age: 36-54 Mean 54.358 S.E. (74.046) 114.129 (35.163) 94.391 (60.185) 79.095 (32.103) 56.574 (35.734) 189.754 (39.178) 137.407 (66.123) 127.198 (42.561) 75.549 (48.060) 0.063 (0.024) 0.066 (0.044) 0.049 (0.020) 0.039 (0.023) 0.067 (0.023) 0.036 (0.039) 0.034 (0.020) 0.02 (0.022) 670 542 654 2,631 455 771 670 3,102 670 3,102 546 445 525 2,970 360 737 546 3,356 545 3,357 Panel C: Formal employment Age: 21-35 Mean 0.03 S.E. (0.034) Age: 36-54 Mean 0.024 S.E. (0.034) Observations Age: 21-35 Treatment Control Age: 36-54 Treatment Control Note: Estimated standard errors are presented in parentheses. Standard errors are calculated using a bootstrap procedure with 500 replications. All estimates use the common support condition. Results for the probability of getting a formal job in Panel C of Table 7 show that the estimated coefficients for vocational training are significant in columns (2), (4) and (5) among younger individuals. Columns (2) and (4) of Panel C report significant coefficients among those aged between 36 and 54 years. 21 So, estimates presented in Table 7 indicate that training is more effective for individuals aged between 36 and 54 years compared to those aged between 21 and 35 years when labor market outcomes are represented by employment and earnings. A possible interpretation for this evidence is that the effectiveness of the programs depends on the combined effect of labor market experience in a given occupation and vocational training through classroom instruction. The results in Panels A and B of Table 7 are consistent with the evidence from developed countries, where training for youths usually has close to zero or negative impacts (Heckman et al., 1999).11 Nevertheless, Panel C of Table 7 shows that training programs effects on formal employment do not seem to be different by age groups. 4.4 - Cost-benefit analysis The estimated coefficients in Panel B of Table 4 indicate that monthly labor earnings increase between R$ 70 (stratification matching) and R$ 175 (radius matching with r=0.001) for those who complete a vocational training program. This subsection presents a cost-benefit analysis using these estimates and information about training program costs from the 2008/2009 POF (Pesquisa de Orçamentos Familiares), the Brazilian Household Budget Survey.12 This cost-benefit analysis requires a number of strong assumptions. First, it is assumed that earnings gain will remain constant for the next periods. Given that the average age for individuals in the sample is about 36 years and that around 80% of the Brazilian workers aged 60 or more are out of the labor force, an additional working life period of 24 years is considered to calculate lifetime benefits. Also, it is supposed that individuals discount future earnings by 1/(1+r), where r is the real interest rate. Considering that r=1%, the monthly discounted rate would be equal to 0.990.13 Given all these assumptions and using a monthly gain of R$ 70, the discounted benefit would be R$ 6,605, while a monthly gain equal to R$ 175 would give a benefit of R$ 16,512. 11 Note that Card et al. (2011), Attanasio et al. (2011) and Nõpo et al. (2007) analyze youth training programs in developing countries. 12 Training program costs are represented in November 2011 Reais, using the INPC. 13 According to data from the Central Bank of Brazil, the monthly real interest rate (SELIC) was around 1% on average during the period analyzed in this paper. 22 The 2008/2009 POF has information about individuals’ spending on training programs, as well as on school supplies and textbooks. The average value of training is R$ 903, which is much lower than the estimated discounted benefits. Adding the spending on school supplies (R$ 9) and on textbooks (R$ 39) for those who reported positive payments with vocational training, the cost increases to R$ 951. The sample used in this paper comprises individuals who became unemployed, but course attendance can reduce job search. Assuming that training lasts three months, and imputing the average labor earnings for those without vocational training in the fifth PME interview, the estimated cost increases to R$ 2,10814. The discounted benefits reported above are calculated projecting estimated gains for the next 24 years. According to Kemper et al. (1984), for example, earnings effects decay from 3% to 17% per year, although Couch (1992) does not find different effects of training for the next 8 years after the end of the program, represented by the National Supported Work (NSW) experiment. Using an earnings increase of R$ 70 and the decay rate of 17%, discounted benefits would decrease to R$ 3,007, which is still larger than the estimated cost. Thus, given the estimates of earnings effects and the other assumptions mentioned above, the cost-benefit analysis in this subsection suggests that vocational training produces positive net gains. 5 – Conclusions This paper analyzes the effect of vocational training on employment, labor earnings and the probability of getting a formal job among workers who lost their jobs in Brazilian metropolitan areas. Estimates based on propensity score matching indicate that this kind of training improves labor market outcomes for these individuals one year later. According to the results, vocational training increases employment probability in about 6 percentage points, labor earnings between 18% and 45% and formal employment probability between 3.1 and 7.3 percentage points. This evidence is similar to other analyses from developing countries, which suggest that vocational training programs are usually more effective than in developed ones. 14 Vocational training programs in SENAI, for example, usually have 160 hours (www. senai.br). Note that this imputation probably overestimates earnings losses. 23 The results also show that estimates of vocational training effects are very different depending on demographic and skill characteristics. Employment and labor earnings improvements attributed to training seem to be more pronounced for less educated and older workers. This evidence could be due to the fact that vocational training usually provides basic skills in elementary occupations and that training effectiveness may be enhanced by previous labor market experience in the occupation. The empirical evidence presented in this paper suggests that vocational training may be a way to increase workers’ productivity in Brazil. Then, training programs may help unemployed individuals, in particular older and less educated workers, through greater probability of getting a job and greater expected labor earnings. 24 References Ashenfelter O, Card D. Using the longitudinal structure of earnings to estimate the effect of training programs. Review of Economics and Statistics 1985; 67, 648-660. Attanasio O, Kugler A, Meghir, C. Subsidizing Vocational Training for Disadvantaged Youth in Developing Countries: Evidence from a Randomized Trial. American Economic Journal: Applied Economics 2011; 3; 3; 188-220. Betcherman, G, Olivas K, Dar A. 2004. Impacts of active labor market programs: new evidence from evaluations with particular attention to developing and transition countries. Social Protection Discussion Paper 0402, World Bank, Washington, DC. Card D, Ibarrarán P, Regalia F, Rosas-Shady D, Soares Y. The Labor Market Impacts of Youth Training in the Dominican Republic. Journal of Labor Economics 2011; 29;2; 267-300. Couch K. New evidence on the long-term effects of employment training programs. Journal of Labor Economics 1992; 10; 4; 380-388. Dehejia R, Wahba S. Causal effects in noexperimental studies: reevaluating the evaluation of training programs. Journal of the American Statistical Association 1999; 94; 448; 1053-1062. Heckman J, Ichimura H, Smith J, Todd P. Characterizing selection bias using experimental data. Econometrica 1998; 66; 5; 1017-1098. Heckman J, Ichimura H, Todd P. Matching as an econometric evaluation estimator: evidence from evaluating a job training program. Review of Economic Studies 1997; 64; 4; 605-654. 25 Heckman J, Lalonde R, Smith J. 1999. The economics and econometrics of active labor market programs. In: Ashenfelter O, Card D (Eds), Handbook of labor economics, vol. 3A,. Elsevier, North-Holland: Amsterdam; 1999. P. 1865-2097. Hermetto A, Rios-Netto E. Uma Avaliação Experimental dos Impactos da Política de Qualificação Profissional no Brasil. Revista Brasileira de Economia 2007; 61; 3; 353378. Kemper P, Long D, Thornton C. 1984. A benefit-cost analysis of the supported work experiment. In: Hollister R, Kemper P, Maynard R. The national supported work demonstration. Madison: University of Wisconsin Press, 1984, p. 239-285. Kluve J. The effectiveness of European active labor market programs. Labour Economics 2010; 17; 6; 904-918. Lalonde R. Evaluating the econometric evaluations of training programs with experimental data. American Economic Review 1986; 76; 4; 604-620. Ñopo H, Robles M, Saavedra J. 2007. Occupational Training to Reduce Gender Segregation: The Impacts of ProJoven. Inter-American Development Bank, working paper 623. Rosenbaum P, Rubin D. The central role of the propensity score in observational studies for causal effects. Biometrika 1983; 70; 41-55. Severini E, Orellano V. O Efeito do Ensino Profissionalizante sobre a Probabilidade de Inserção no Mercado de Trabalho e sobre a Renda no Período Pré-PLANFOR. Economia 2010; 11; 1; 155-174. Smith J, Todd P. Does matching overcome Lalonde’s critique of nonexperimental estimators?. Journal of Econometrics 2005; 125; 1-2; 305-53. 26
Baixar