Activity Characterization from Actimetry Sensor
Data for Sleep Disorders Diagnosis
Pedro Daniel Correia Pires
Dissertação para obtenção do Grau de Mestre em
Engenharia Biomédica
Júri
Presidente:
Fernando Henrique Lopes da Silva, MD, PhD
Orientador IST:
João Miguel Raposo Sanches, PhD
Orientador FML: Maria Teresa Aguiar Santos Paiva, MD
Vogal:
Jorge dos Santos Salvador Marques, PhD
Setembro 2008
Acknowledgments
First of all I would like to thank my family for the support and enthusiasm, specially my mother
Fábia and my father Ezequiel for giving me all the possible and necessary conditions to get me in this
institution, that ultimately lead to the elaboration of this master thesis. And also to my sister Ana.
I would also like to express my gratitude to all my friends, especially the ones in IST, for all the
relaxation and fun moments, during launch over the whole semester, and eventually some parties.
Now I must thank both my supervisors, Prof. João Sanches from IST and Prof. Dr. Teresa Paiva from
FMUL. Prof. João Sanches for helping me trough all the work with his excellent ideas and explanations,
and especially for his growing enthusiasm as the result appeared along. To Prof. Dr. Teresa Paiva for
her medical and biological insight on the thesis, contribution for the sleep diary, and for supplying the
actigraph data.
In no special order to, Artur and Fayad for letting me sleep in their couch at roma 64, to Sara,
Calhau and Dárcio for all the time together, my friends from Miradezes, Luis, Francisco, Marco, Pedro
and Joana, to my academic goddaughters Ana and Tânia, my friends and neighbors, especially João,
Inês and Rogério, the friends from my very relaxing and preparatory senior trip to Cancun, Mexico, all
my friends from high school, especially Carlos, to the Mobile Team people, Bruno, João and André, to
friends from my hometown, André and Gonçalo, to all the biomedical freshman from 2008 to 2005, and
last but not least, to the rest of my class.
To IST for being the excellence school that I always expected, and for receiving me well and provided
me with all the support for my investigation.
Finally to Nokia for supplying me with the latest mobile phone, for testing the sleep e-diary developed.
i
Aos meus pais...
ii
Abstract
The human activity (HA) is one of the most important indicators used in assessing the sleep/vigil
state and to estimate the sleep circadian cycle. Its accurate definition and measurement is very difficult.
Usually only an indirect and noisy version is available, aquired with an actigraph, that is a device mainly
composed by a three axis accelerometer.
In this thesis the actigraph signal is statistically processed and considered as a noisy observation of
the unknown variable Activity (ACT). The activity signal is correlated with the data from a sleep e-diary
(SeD) to estimate the sleep/vigil state and identify abnormal patterns on its circadian cycle. In the scope
of this work a SeD was developed in a mobile phone to make it easier for patients to register the more
relevant events in their daily routine.
The main goal of this thesis is to define the HA and to propose a method to estimate it from the
actigraph data and from the SeD.
An observation model for the actigraph signal is proposed based on the physical working principles of
the acquisition device. A Bayesian approach is used to estimate the activity and a segmentation algorithm
based on Graph-Cuts is used to infer the sleep/vigil (SV) state.
Experiments using real data have shown two distinct statistical distributions of the actigraph signal,
one space-shifted Maxwell distribution during the wake time, and a space-shifted Poisson distribution
during the sleep time. The estimated activity and SV state are consistent with the SeD data.
Keywords: Statistical Signal Processing, Human Activity, Actigraphy, Sleep Disorder, Sleep Diary,
Distribution Mixture.
iii
Resumo
A actividade humana (AH) é um dos indicadores mais importantes para avaliar o estado sono/vigı́lia e
para estimar o ciclo circadiano. A sua definição e medição exactas são muito difı́ceis de realizar, sendo que
normalmente apenas se conhece uma versão indirecta adquirida com um actigrafo, que é essencialmente
um acelerómetro tri-axial.
Nesta tese, o sinal proveniente do actigrafo vai ser processado estatisticamente e considerado como
sendo uma observação de uma variável desconhecida, a actividade (ACT). O sinal da actividade é então
correlacionado com os dados obtidos através de um diário de sono electrónico, para estimar o estado
sono/vigı́lia e identificar padrões anormais no ciclo circadiano. No seguimento deste trabalho foi desenvolvido um diário de sono electrónico (DSE), implementável em telemóvel, com o objectivo de tornar
mais fácil para os pacientes o registo dos eventos mais relevantes no seu dia-a-dia.
O principal objectivo deste trabalho é definir a AH e propôr um método para a estimar a partir dos
dados do actigrafo e do diário de sono electrónico.
É proposto um modelo de observações para o sinal do actigrafo, baseado nos princı́pios fı́sicos de
funciomento do dispositivo de aquisição. É usada uma aproximação Bayesiana para estimar a actividade
e um algoritmo de segmentação, baseado em Graph-Cuts, para inferir sobre o estado sono/vigı́lia (SV).
As experiências com dados reais mostraram duas diferentes distribuições estı́sticas do sinal do actigrafo, uma distribuição de Maxwell deslocada no espaço durante a vigı́lia, e uma distribuição de Poisson
também deslocada no espaço durante o sono. Os dados do DSE são consistentes com o estado SV
estimado.
Palavras-chave: Distúrbios de sono, Processamento estatı́stico de sinal, Actigrafia, Actividade Humana,
Diário de Sono, Mistura de Distribuições.
iv
Contents
Acknowledgments
i
Abstract
iii
Resumo
iv
Contents
v
List of Figures
vii
List of Tables
viii
Abbreviations
ix
1 Introduction
1
1.1
Motivation and Objectives . . . . . . . . . . . . . . . . . . . . . . . . . . . . . . . . . . . .
4
1.2
State of the art . . . . . . . . . . . . . . . . . . . . . . . . . . . . . . . . . . . . . . . . . .
4
1.2.1
Polysomnography . . . . . . . . . . . . . . . . . . . . . . . . . . . . . . . . . . . . .
4
1.2.2
Actigraphy . . . . . . . . . . . . . . . . . . . . . . . . . . . . . . . . . . . . . . . .
4
1.2.3
Sleep diaries
. . . . . . . . . . . . . . . . . . . . . . . . . . . . . . . . . . . . . . .
5
1.2.4
Activity (ACT) definition . . . . . . . . . . . . . . . . . . . . . . . . . . . . . . . .
5
Thesis organization . . . . . . . . . . . . . . . . . . . . . . . . . . . . . . . . . . . . . . . .
6
1.3
2 Problem Formulation
7
2.1
Estimation and filtering . . . . . . . . . . . . . . . . . . . . . . . . . . . . . . . . . . . . .
8
2.2
Kalman filter . . . . . . . . . . . . . . . . . . . . . . . . . . . . . . . . . . . . . . . . . . .
10
2.3
Sleep/vigil state estimation . . . . . . . . . . . . . . . . . . . . . . . . . . . . . . . . . . .
11
3 Results and Discussion
14
3.1
Experimental results . . . . . . . . . . . . . . . . . . . . . . . . . . . . . . . . . . . . . . .
14
3.2
A sleep apnea case with SeD data . . . . . . . . . . . . . . . . . . . . . . . . . . . . . . . .
14
3.3
Second case of disturbed sleep with SeD data . . . . . . . . . . . . . . . . . . . . . . . . .
17
3.4
An insomnia case . . . . . . . . . . . . . . . . . . . . . . . . . . . . . . . . . . . . . . . . .
19
3.5
Model validation . . . . . . . . . . . . . . . . . . . . . . . . . . . . . . . . . . . . . . . . .
20
v
3.6
Toward a definition of human Activity (ACT)
. . . . . . . . . . . . . . . . . . . . . . . .
20
4 Conclusion
21
Bibliography
22
Appendices
23
A
Maxwell distribution . . . . . . . . . . . . . . . . . . . . . . . . . . . . . . . . . . . . . . .
24
B
Sleep electronic diary . . . . . . . . . . . . . . . . . . . . . . . . . . . . . . . . . . . . . . .
25
C
Submitted patent . . . . . . . . . . . . . . . . . . . . . . . . . . . . . . . . . . . . . . . . .
27
D
Code . . . . . . . . . . . . . . . . . . . . . . . . . . . . . . . . . . . . . . . . . . . . . . . .
45
vi
List of Figures
1.1
Joint graphical representation of the actigraphy and sleep diary data.
. . . . . . . . . . .
3
1.2
Main menu of the SeD implemented on a mobile phone. . . . . . . . . . . . . . . . . . . .
3
1.3
Polysomnography: patient and result. . . . . . . . . . . . . . . . . . . . . . . . . . . . . .
4
1.4
An actigraph used in raw data collecting. . . . . . . . . . . . . . . . . . . . . . . . . . . .
5
1.5
Traditional paper printed sleep diary. . . . . . . . . . . . . . . . . . . . . . . . . . . . . . .
6
2.1
Windowing parameter estimation with histogram fitting. . . . . . . . . . . . . . . . . . . .
8
2.2
Distribution mixture. . . . . . . . . . . . . . . . . . . . . . . . . . . . . . . . . . . . . . . .
8
2.3
The signal α − β for a 24 hour cycle. . . . . . . . . . . . . . . . . . . . . . . . . . . . . . .
12
3.1
The raw data collected from the actigraph. . . . . . . . . . . . . . . . . . . . . . . . . . .
14
3.2
Typical result from the statistical analysis . . . . . . . . . . . . . . . . . . . . . . . . . . .
15
3.3
Plot representing α + β considering the case of Fig.3.2. . . . . . . . . . . . . . . . . . . . .
15
3.4
Zoom from Fig.3.2 overlapped with data collected with the SeD . . . . . . . . . . . . . . .
16
3.5
Sleep/awake transitions by graph vut method. . . . . . . . . . . . . . . . . . . . . . . . . .
17
3.6
Zoom of the first day bed and awake times from the Fig.3.5 . . . . . . . . . . . . . . . . .
17
3.7
Second example of estimated parameters in a disturbed sleep condition. . . . . . . . . . .
18
3.8
Sleep/awake state estimation respecting Fig.3.7 case. . . . . . . . . . . . . . . . . . . . . .
18
3.9
Parameters estimated from a case of insomnia. . . . . . . . . . . . . . . . . . . . . . . . .
19
3.10 Graph cut sleep/awake estimation for the case of insomnia. . . . . . . . . . . . . . . . . .
19
A.1 Modified Bessel Function of the First Kind. . . . . . . . . . . . . . . . . . . . . . . . . . .
25
A.2 Maxwell distribution. . . . . . . . . . . . . . . . . . . . . . . . . . . . . . . . . . . . . . . .
25
A.3 Distribution function for different values of µ = {0, 1, ..., 20}.
. . . . . . . . . . . . . . . .
26
B.1 Simple block diagram of the SeD operation . . . . . . . . . . . . . . . . . . . . . . . . . .
26
B.2 Block diagram of the SeD main menu . . . . . . . . . . . . . . . . . . . . . . . . . . . . .
27
vii
List of Tables
2.1
Parameters used in the initialization procedure. . . . . . . . . . . . . . . . . . . . . . . . .
9
2.2
Mean and std of thrs and respective values of A and B
. . . . . . . . . . . . . . . . . . .
9
3.1
Percentage of ǫMN ≤ ǫN N . . . . . . . . . . . . . . . . . . . . . . . . . . . . . . . . . . . .
20
viii
Abbreviations
ACT
-
Activity
ASPS
-
Advanced Sleep Phase Syndrome
DSPS
-
Delayed Sleep Phase Syndrome
ECG
-
Electrocardiogram
EEG
-
Electroencefalogram
EKG
-
Electrocardiogram
EMG
-
Electromiogram
EOG
-
Elecroculogram
FMUL
-
Faculdade de Medicina da Universidade de Lisboa
GC
-
Graph-Cuts
HA
-
Human Activity
IST
-
Instituto Superior Técnico
M
-
Maxwell istribution
MSE
-
Minimum Square Error
N
-
Normal distribution
PLMD
-
Periodic Limb Movement Disorder
REM
-
Rapid Eye Movements
RBD
-
Rapid eye movement Behavior Disorder
SeD
-
Sleep electronic Diary
SMS
-
Short Message Service
SV
-
Sleep/Vigil
SWSD
-
Shift Work Sleep Disorder
ix
Chapter 1
Introduction
The human body requires sleep to be healthy and the inability to fall asleep or stay asleep has
important impacts on people’s health. Diseases and conditions such as diabetes, obesity, depression or
cardiovascular diseases are associated with sleep disorders. As noted by Damien Leger et al. [1], ”Sleep
disorders can have substantial impact on public health through the disruption of education, work, and the
quality of life for affected patients. The substantial breakthroughs in sleep research and sleep medicine
now being made are influencing public health approaches to these disorders.”
The more common pathologies associated with sleep disorders are:
• Hypopnea syndrome, when at sleep there’s a slow respiratory rate or the breathing is abnormally
shallow.
• Narcolepsy, the condition of falling asleep spontaneously and unwillingly.
• Periodic limb movement disorder (PLMD), sudden involuntary movement of arms and/or legs
during sleep.
• Rapid eye movement behavior disorder (RBD), acting out violent or dramatic dreams while in REM
sleep.
• Situational circadian rhythm sleep disorders, jet lag and shift work sleep disorder (SWSD).
• Obstructive sleep apnea, when the airway is partially obstructed and the patient can’t get enough
deep sleep.
• Sleepwalking, engaging in activities normally associated with wakefulness, without realizing it.
• Sleep paralysis, this is characterized by temporary paralysis of the body shortly before or after
sleep.
• Delayed sleep phase syndrome (DSPS), inability to awaken and fall asleep at socially acceptable
times but no problem with sleep maintenance, a disorder of circadian rhythms. Other such disorders
are advanced sleep phase syndrome (ASPS) and Non-24-hour sleep-wake syndrome (Non-24).
1
Some of these conditions may be diagnosed using actigraphy, especially the last three ones, the DSPS,
ASPS and Non-24. The accuracy of the diagnosis of these pathological conditions may be improved with
an accurate definition and estimation of the ACT variable.
The analysis of the actigraph output signal have revealed a mixture of two dominant components, one
associated with the day life activity and the other associated with the night activity. The evolution of the
relative importance of these two components along the circadian cycle have shown a strong correlation
with the Sleep e-Diary (SeD) information for different patients. This observation have inspired the
method proposed in this thesis to define the Activity (ACT) variable and the corresponding approach to
estimate it. A sleep diary is a registration media where the patient register the events, corresponding time
stamps and observations, occurred during the day or night relevant for the diagnosis of sleep disorders.
It is thought that the difference in both components reside in purposeless characteristic of the movements during the sleep state. During the vigil state the movements have usually a purpose, they are
coherent and coordinated which leads to a statistical distribution of the actigraph signal different from
the one obtain during the sleep state where the purposeless nature of the movements, more impulsive, non
coherent and usually more sparsely distributed along the time, induces the generation of a very different
distribution of the acigraph signal.
The proposed method models the output signal of the actigraph as a mixture of two distributions;
a Maxwell distribution, prevalent during the vigil state, and a Poisson distribution prevalent during the
sleep state.
The actigraph sensor is essentially a three axis accelerometer. The Maxwell distribution arises if the
three components are assumed independent and identically distributed described by a non zero mean
normal distribution, as shown in the appendix. The Poisson distribution arises if the three components
present an impulsive behavior, where the movements are mainly constituted by short duration non correlated impulses. The time interval between these impulses is exponentially distributed as stated in. The
integration process associated with the lowpass nature of the actigraph sensor and the window based
processing algorithm used to process the signal suggest that the Poisson distribution is appropriated to
describe the sleep component of the mixture. The visual inspection of this component reinforces this
perception. However, for sake of simplicity, in this thesis, the Poisson component is approximated by a
normal distribution.
The proposed algorithm estimates the parameters of the mixture at each moment by considering the
data from a sliding window centered at each sample. The process is repeated for all time instants and
regularization and outliers rejection procedures are applied. The overall process is described in the next
section.
The vector parameters of the mixture along the time, θ(n), is assumed here, to be a noisy version
of the multidimensional ACT signal that is used to estimate the state. The new proposed definition for
the ACT variable is more complete and accurate than the previous approaches where only accelerations
intensities were considered. In fact, some sleep disturbances events can lead to larger intensities on the
actigarphy output signal than calm tasks during the vigil state. As important as the actigraph intensity
is the type of activity which may be infer from the relative importance of both mixture components.
2
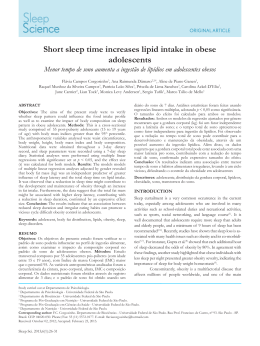
Figure 1.1: Joint graphical representation of the actigraphy and sleep diary data.
The ACT and SV signal are compared with the SeD data for validation purposes, as shown in Fig.1.1.
The SeD used in this work is described in the next section, and was designed and implemented specifically
in the scope of this work and displayed in Fig.1.2, in order to improve the accuracy of the data provided
by the patient.
Figure 1.2: Main menu of the SeD implemented on a mobile phone.
3
1.1
Motivation and Objectives
Sleep disorders affect a large part of the population in the western countries. These disorders have several consequences like excessive daytime sleepiness, cognitive problems, motor vehicle crashes (especially
at night), poor job performance and reduced productivity or even diabetes and hypertension. Helping to
diagnose and treating these conditions is obviously a very strong motivation.
The objective of this work is to propose a method for analyzing the data from actigraphs, to provide a
new, and hopefully better, way to diagnose these conditions mentioned above. This could be achieved by
proposing a new way for characterizing the ACT variable, not by the accelerations intensity only, or its
mean over any period, but through a whole set of variables that describe the histogram of those intensities
at each moment. Additionally, in the scope of this work a SeD implemented on a mobile phone.
1.2
State of the art
There are mainly three methods for diagnosing sleep disorders: polysomnography, actigraphy and
sleep diaries.
1.2.1
Polysomnography
Polysomnography consists of acquiring multiple biometrical signals such as EEG, air flow, EMG for
chin and leg movements, EOG for REM detection, EKG, oxygen saturation and chest and abdominal wall
movement. Some of these and other not mentioned may be optional considering the desired diagnosis.
This method, normally performed during a single night, is very reliable in estimating the sleep states,
but requires the patient to be all wired up, like the kid in Fig.1.3, and almost needs the patient to sleep
in a strange environment. A typical result obtained from polysomnography is ilustrated in Fig.1.3.
Figure 1.3: On the left is a patient prepared for a polysomnography, and on the right is an usual outcome.
1.2.2
Actigraphy
On the other hand, actigraphy consists only in using a device that is wrist watch shaped, like the one
on Fig.1.4, on the wrist, usually in the non-dominant one, normally from 7 to 15 days. The device, called
actigraph, has a tri-axial accelerometer and records the acceleration magnitude measured by it. Although
4
the acceleration is by far the most useful measure, some actigraphs may measure light intensity and the
position of the actigraph as well. Meaning, the actigraphy is preformed during the patients daily routine,
in their natural environment, using a relatively more simpler and cheaper device than polysomnography.
Additionally it is still quite reliable as it can distinguish sleep form wakefulness approximately between
80% and 90% of the time depending on the algorithm [2, 3, 4].
Figure 1.4: An actigraph used in raw data collecting.
Actigraphy is increasingly used mainly in sleep research, and in the clinical care of patients with sleep
and circadian rhythm abnormalities [5, 6]. In sleep research the actigraphy is used in many subjects
like the sleep onset [7], measures of children’s sleep [8] or daytime naps in adolescent girls with chronic
musculoskeletal pain [9]. Actigraphy is also used in issues not so related with sleep, like anesthesiology
[10], chronic obstructive pulmonary disease [11] or hepatic encephalopathy [12].
1.2.3
Sleep diaries
Sleep diaries consist in a standard set of questions, that patients have to answer, usually for as long as
they wear their actigraphs. At the beginning this questions and answers were registered on paper [13, 14],
like the one that can be seen in Fig.1.5. More recently diaries started to be implemented on electronic
devices. Those aim for a better compliance rate and accuracy in the times recorded by patients, because
they are more portable. None the less, those SeD are devices exclusively dedicated to this task [15].
1.2.4
Activity (ACT) definition
Although there are some considerable solid classifications of sleep and wake states as REM, nonREM, etc. [16], there are few references in the literature describing statistical characterizations of the
acceleration data measured with actigraphs. One of them is about statistical models of actigraphy where
it is proposed a model for actigraph data only during sleep [17]. In these paper, the author modulates the
movements during the sleep state as discrete events, with an exponential distribution for the inter-event
intervals, which means a Poisson distribution for the number of movements in a given constant time
interval. Other paper states that different activities result on different intensities distribution histograms
[18], without defining these distributions.
5
Figure 1.5: Traditional paper printed sleep diary.
The most of the papers proposing processing algorithms for the actigraph signal aims at to estimate
the state variable Sleep/Vigil [19]. It is stated that the actigraphy ability to detect sleep, with this
methods, is better when used in normal persons, than in ill ones.
1.3
Thesis organization
Chapter 2 is the problem formulation one, there it can be seen all the estimation algorithm, since the
probability distribution function formulation until the graph-cut method segmentation.
In the next chapter are displayed the results from the analysis, the estimation of probability distribution parameters, for 3 cases, and the graph-cut segmentation including the data collected with the SeD,
for 2 of them. The result of some statistical tests concerning the distribution function used, are also
represented here.
The chapter 4 is the conclusion, where the main conclusions are stated. There are also introduced
some ideas for future work.
Finally, in the appendix section, some additional calculations respecting the problem formulation
chapter are present, so is one brief explanation about the SeD operation, the Portuguese patent submitted
during this work, and the code for all the developed software.
6
Chapter 2
Problem Formulation
The main component of the actigraph sensor is a 3D axis accelerometer which output is the acceleration
magnitude formed by two components, d(n), dynamical component like vibrations and rapid movements,
and c(n), the static acceleration magnitude, e.g. gravity or long terms slow acceleration components [20].
Inspection of the experimental data histogram have shown clearly two components, one more important
during the day, pd (r), and the other more important at night, pn (r).
The first, pd (r), is modeled as a shift Maxwell distribution, derived at the appendix, where the three
acceleration components are assumed independent, identically distributed with a normal distribution
with the same mean, µ, p(ax ) = p(ay ) = p(az ) = N (µ, σ 2 ). Under these assumptions the acceleration
q
2
magnitude, d = a2x + a2y + a2z may be modeled by a shifted Maxwell distribution, M(cM , σM
), where
cM is related with the static acceleration and σM is not necessary equal to σ, as shown at the appendix,
r
2
M)
2 (r − cM )2 − (r−c
σ2
M
pd (r) =
e
.
(1)
3
π
σM
The second component, pn (r) is assumed to be generated from involuntary movements, less coordi-
nated and more impulsive [21]. In sleep there are well defined intermittent peaks of activity at different
intensities, then, the Poisson distribution is the more appropriated to describe this type of acceleration [17]. Here, however, for sake of simplicity, this component is described by a normal distribution,
2
N (cN , σN
).
Therefore the distribution proposed in this paper to describe the actigraph output signal is the following mixture
2
2
p(r) = αM(cM , σM
) + βN (cN , σN
)
(2)
or
p(r, θ) = α
r
2
M)
N)
2 (r − cM )2 − (r−c
1 1 − (r−c
σ2
2σ 2
M
N
√
e
e
+
β
3
π
σM
2π σN
2
(3)
where the time varying parameter column vectors, θ(n) = {α(n), σM (n), cM (n), β(n), σN (n), cN (n)}T
{z
} |
{z
}
|
θM (n)
must be estimated to characterize the activity at each discrete instant n.
7
θN (n)
Figure 2.1: Windowing parameter estimation with histogram fitting.
The estimation of θ(n) at each instant n is performed by solving the following equation
θ(n) = arg min
θ
L
X
k=1
(hn (k) − p(xk , θ))2
(4)
where 0 < n ≤ N , hn = {hn (1), ..., hn (L)} is the L dimensional histogram, with bins centered at locations
x = {x1 , x2 , ..., xL }, computed in a W dimensional window centered at the nth sample and p(xk , θ) is the
function (3) computed at locations xk , as shown in Fig.2.1. The optimization task described in equation
(4) is performed by using the function nlinfit implemented in MatLab where the unknown parameters
are obtained by estimating the coefficients of a nonlinear regression function using the least squares [22].
Figure 2.2: Distribution mixture.
The relative importance of the distributions and their characteristics change along the circadian cycle.
The vector of parameters θ(n) is therefore a multidimensional signal that changes along the cycle and is
proposed here to define the Activity (ACT) variable. In most cases both distributions are present, but in
some cases only one of them is present. During the night pn (r) is prevalent and during the day the more
important distribution is usually pd (r).
2.1
Estimation and filtering
The results of the iterative optimization algorithm depends on the initialization values and may not
converge when only one distribution is present. This is because the algorithm tries to fit the absent
distribution to a small amount of data, usually noise not related with the activity. To avoid these
8
difficulties the initialization of the parameters associated with the absent distribution must be zero. To
detect if a distribution is absent, a local minimum of the smoothed histogram is searched around the
value thrs, as displayed in Fig.2.2. If the percent of observations associated with pd (r) (< thrs) is less
than A% or the percent of observations associated with pn (r) (> thrs) is less than B% the distribution
is considered absent and the respective parameters are initialized to zero. The parameters thrs, A and
B used are listed in Table 2.1. These parameters were obtained from typical bimodal histograms of real
data, segmented manually. Table 2.2 shows the mean and standard deviation of the optimum thresholds,
thrs, and the respective mean and standard deviation of A and B computed from real data of four
patients.
B
thrs
A
2.5%
32
5%
Table 2.1: Parameters used in the initialization procedure.
B
thrs
A
mean
34.88
34.09
65.12
STD
24.62
13.24
24.62
mean
36.98
33.69
61.54
STD
22.57
12.09
23.39
mean
36.86
31.48
63.14
STD
14.22
7.25
14.22
Patients
mean
36.24
33.08
63.27
mean
STD
20.75
11.10
21.08
Patient 1
Patient 2
Patient 3
Table 2.2: Mean and standard deviation of the parameter thrs and respective values of A and B, computed
from typical real histograms selected by hand.
Consider the parameter vector at nth instant θ(n) = {θN (n)T
θM (n)T }T as a stacked vector
containing the parameters associated with the Normal, θN (n), and Maxwell, θM (n), distributions. These
signals, θN (n) and θM (n), represent the evolution of each distribution along the time.
The initialization of the vectors θN (n) and θM (n), need for the fitting algorithm, is performed by
+
partitioning the original histogram into two groups, h−
thrs , associated with pn (r) and hthrs associated
with pd (r) according the estimated threshold thrs. If n− and n+ are the number of samples of each set
the initialization of mixture coefficients are
n+
+ n+
n−
β 0 (n) = −
.
n + n+
α0 (n) =
n−
(5)
(6)
+
If the mean and standard deviation of h−
thrs and hthrs are (µ− , σ− ) and (µ+ , σ+ ) respectively, then
0
the initialization of θN (n) is θN
(n) = {β 0 (n), σ − , µ− }.
9
0
0
The initialization of θM (n), θM
(n) = {α0 (n), σM
, µ0M }, is based on the assumption that pd (r) is a
shifted Maxwell distribution. The mean and standard deviation of a Maxwell distribution with parameter
a, M(a), (see appendix) are,
r
2
meanM = 2a
π
r
3π − 8
ST DM = a
π
(7)
(8)
where a = σM in this case.
Therefore
r
2
π
r
3π − 8
0
σ + = σM
π
+
µ −
c0M
=
0
2σM
where c0M is the initial shifted value of the Maxwell distribution, which leads to,
r
π
0
σM
= σ+
3π − 8
r
8
0
+
+
cM = µ − σ
3π − 8
(9)
(10)
(11)
(12)
Even with the previous pre-processing procedure to improve the convergence conditions of the fitting
algorithm, about 2% of the estimated parameters are completely out of context and are considered
outliers. They usually represent much larger values than the most part of the others, considered normal.
Therefore after the fitting process another elimination procedure is performed in order to eliminate these
outliers from the estimated signal.
The histogram of each component, {θi (n)}, hi (r), is computed and the samples θR (n), with R =
{N , M}, are rejected if at least one of the component belongs to the 2% upper portion of the respective
histogram, that is, a complete sample θR (n) is only accepted if its all components belongs to the 98%
lower portion of the respective histogram. This mean that after this procedure some samples of θM (n)
are accepted and the homologous of θN (n) may be reject, and the converse is also possible.
2.2
Kalman filter
The resulting signals θN (n) and θM (n), obtained in the previous step, are still noisy (non smoothed)
with missing data. The Kalman filter is suitable to filter these signals and fill the gaps. The Kalman filter
was proposed in the sixties of the twenty century [23] and its main goal is to recursively compute the
minimum square error (MSE) state space unknown variable from the previous and present observations,
where the following multidimensional model is assumed here [24]:
sR (n + 1)
= sR (n) + q(n)
(13)
θR (n)
= sR (n) + r(n)
(14)
where θR (n) are noisy observation vectors, q(n) ∼ N (0, σq2 I) and r(n) ∼ N (0, σr2 I) are normal distributed
multimensional random variables with diagonal covariance matrices σq2 I and σr2 I respectively.
10
The estimated denosied signal is obtained from
−
ŝR (n) = ŝ−
R (n) + K(n) θR (n) − ŝR (n)
(15)
where ŝ−
R (n) and ŝR (n) are denominated a priori and a posteriori estimates of sR (n) respectively. K(n),
a 3×3 matrix in this case, is the so called Kalman gain and (θR (n)−ŝ−
R (n)) is called residue or innovation.
The a priori variable ŝ− (n) is the optimum estimates before the last observation θR (n) is acquired. This
estimate is updated with the innovation term multiplied by the Kalman Gain, K(n), to produce the a
posteriori estimate of s(n), ŝ(n). This is the optimum estimate of s(n) given the present and all previous
observations.
The signal θR (n) however is not defined where the samples were rejected. In this case the output of
the Kalman filter is the a priori estimate, ŝ−
R (n). The whole filtering sequence is
ŝ− (n)
P̂− (n)
K(n)
ŝ(n)
P̂(n)
= ŝ(n − 1)
(16)
= P̂(n − 1) + σq2 I
(17)
= P̂− (n)(P̂− (n) + σr2 I)−1
= ŝ− (n) + w(n)K(n) θR (n) − ŝ− (n)
(18)
=
[1 − w(n)K(n)] P̂− (n)
(19)
(20)
where P̂− (n) and P̂(n) are the a priori and a posteriori estimates of the error covariance, respectively,
and
w(n) =
1
0
if θR (n) was accepted
(21)
otherwise
is a binary signal to indicate what samples are or not valid.
2.3
Sleep/vigil state estimation
The evolution of the parameters θN (n) and θM (n) along the circadian cycle may be used to characterize the type of activity of the patient. Here it is suggested that the relative importance of each
distribution seems to be a promising indicator to estimate the sleep/vigil (SV) state of the patient. The
electroencephalogram (EEG) is the more accurate indicator to estimate the state SV while the estimation
based on actimetry sensor data is not so reliable. However, the analysis of the actimetry sensor data for
SV estimation purposes is usually based only on the output signal intensity.
Here, it is proposed a new approach. It is suggested that the state SV is better estimated if the
estimation is based on the relative importance of both distributions, pn (r) and pd (r), and not on the
signal intensity. The reasoning for this approach is based on the fact that the observed movements during
the sleep and vigil states are intrinsically different, not necessary related with its amplitude or intensity.
A sedentary activity during the day may be much less intense than a pathologic very active sleep. The
main concept that differentiate the two states is: purposeless. Our movements during the day have usually
11
an immediate purpose, are consistent and coordinated while during the sleep state they are involuntary
and usually not controlled.
The following difference is used to assess the preponderant distribution at instant n
sv(n) = α(n) − β(n)
(22)
where α(n) and β(n) are the weights associated with pd (r) (vigil) and pn (r) (sleep) respectively in the
mixture (2). This signal, represented at Fig.2.3, is an alternating signal according with the circadian
cycle. Its analysis may be used to assess the regularity and phase shift of the sleep circadian cycle.
Figure 2.3: The signal α − β for a 24 hour cycle.
Let us define the following Sleep/Vigil (SV) binary state variable,
0 if sleep
SV (n) =
1 otherwise
(23)
The state variable SV (n) may be estimated from the noisy signal sv(n) as follows
ˆ = arg min E(sv, SV)
SV
(24)
SV
where SV = {SV (1), SV (2), ..., SV (N )}T , sv = {sv(1), sv(2), ..., sv(N )}T and
E(sv, SV) =
X
n
|
sv(n)(1 − 2SV (n)) + α
{z
binarization
}
|
X
n
|SV (n) − SV (n − 1)|
where the first term forces the binarization of sv(n) according
0 if sv(n) < 0
SV (n) =
1 otherwise
12
{z
regularization
(25)
}
(26)
because for each sample
sv(n)(1 − 2SV (n)) =
is minimum.
sv < 0
if SV = 0 and sv < 0
(27)
−sv < 0 if SV = 1 and sv > 0
The regularization term is used to force a stepwise constant solution with abrupt transitions by
introducing temporal correlation between neighboring samples, |SV (n) − SV (n − 1)|, where differences
between consecutive samples of SV are penalized by α. As large is α as large is the penalization and
as stepwise constant is the solution. The value of α is manually chosen in order to keep the significant
transitions related with changes on the state of the patient and to eliminate the transition due the noise
present in sv(n).
The minimization of the energy function (25), formulated in (24), is a huge combinatorial optimization
problem in the {0, 1}N high dimensional space where N is the length of SV.
In [25] it is shown that several energy minimization problems in high dimensional discrete spaces can
be efficiently solved by using Graph-Cuts (GC) based algorithms. The authors have designed a very fast
and efficient algorithm to compute the global minimum of the energy function. However, the algorithm is
not completely general which means that some energy functions cannot be minimized with the proposed
method. In [26] the authors present a wide class of energy functions that may be minimized with the GC
method. Fortunately, the function (25) belongs to that class.
The overall processing algorithm is therefore developed in the following steps
1. Processing of the actigraphy signal, r(n),
(a) Computation of the histogram of a W length window located around each sample r(n),
T
T T
(b) Computation of the parameters of the mixture, θ(n) = {θN
, θM
} (n),
2. Elimination of the outliers in θ(n),
3. Smooth and fill the missing data in θ(n) by Kalman filtering to obtain sv(n),
4. Estimate the state binary variable Sleep/Vigil (SV), SV (n), from sv(n) by using Graph-Cuts.
13
Chapter 3
Results and Discussion
3.1
Experimental results
In this section, experimental results with real data are presented. Four actigraph sequences are used
but only for one there is accurate sleep diary information, acquired with a SeD implemented in the scope
of this work. For other sequence there is also sleep diary information but acquired by the traditional
paper based method and it is not totally reliable, presenting several obvious inconsistencies. For the
other two sequences there are no sleep diary information at all.
A typical actigraphy sequence is represented in Fig.3.1 where the actigraph sensor output is registered
during a week in a 24 hours basis.
Figure 3.1: The raw data collected from the actigraph.
3.2
A sleep apnea case with SeD data
This study was performed for approximately 7 days, comprising about 167 hours. The Fig.3.1 displays
the raw data where it is not possible clearly to distinguish between sleep and awake zones. This is in
part due to movements during the sleep caused by the sleep apnea which prevent the patient to fall in
14
a deep sleep. In a normal sleep case both regions are more distinguishable but the proposed estimation
algorithm still is helpful, mainly at the transitions, as it will be observed in the next cases.
Figure 3.2: Typical result from the statistical analysis. On the left are the three parameters respecting
the Maxwell distribution and on the right are the parameters relative to the Normal distribution. The
black vertical periodic lines represent the midnight.
The six components of θ(n) estimated from the data displayed in Fig.3.1 are displayed in Fig.3.2. In
this example they are visible the 7 periods corresponding to the seven consecutive days that the patient
wore the actigraph sensor. The values of σM range from 0 to 300 mG with cM ranging between -200 and
200 mG, thus representing the large and high intensities of the acceleration distribution, the Maxwell
component. The values associated with pn (r), are smaller. σN ranges from 0 to 10 mG and cM from 0
to 30 mG.
The signal α(n) − β(n), represented in Fig.3.3, is approximately one, with mean 0.98 and standard
deviation 0.096, which mean that the mixture is able to describe the signal almost of the time. Other
components than pn (r) and pd (r) are less important or it may be only noise.
Figure 3.3: Plot representing α + β considering the case of Fig.3.2.
15
Figure 3.4: Zoom from Fig.3.2 overlapped with data collected with the SeD, on a), b), e) and f) the red
x marks the time the patient went to bed, and the green circle is the respective time of awake. On c)
and d), the black square represents the time of exercise.
Let us now consider only one single day of analysis from 12 am until 12 am of the next day as it
is represented in Fig.3.4. It is clearly evident that the distribution function of accelerations intensities
registered by the actigraph is altered depending on the actions taken by the patient. For instance it
is visible that α is very close to zero between the x and the circle, where the patient is presumably
sleeping, and so is the β between the circle and the next x. This indicates that the Maxwell distribution
is predominant during the day time, as opposing to the Normal distribution that is predominant during
the night.
Other alteration induced in the resultant analysis is the high values of cM matching the time marked
in the SeD as exercise by the subject. This is due to the relatively constant high acceleration intensities
registered during pronounced exercise, as the Maxwell distribution component shifts to the right in the
acceleration intensities distribution. This suggests that the activity intensity can be measured mainly
through the cM variable.
The fact of α is associated to the vigil state and the β to the sleep state suggests that SV state can
be detected from the α and β signals. To assess this assumption the signal α(n) − β(n) is overlapped
with the SeD data in the Fig.3.5.
However the circles appear to coincide with the sleep to awake estimated transition and specially the
x’s with the estimated awake sleep transition, there is in average a delay of about 20 min, and an example
can be seen in Fig.3.6 The decreasing on the temporal resolution due the windowing method to estimate
the vector of parameters decreases the accuracy on the estimation of this delay. More sophisticated
methods may be used to try to estimate the sleep onset from these data which is an important clinical
indicator for the insomnia.
In this case we have an almost complete information about the subject daily routine, so it is know
16
Figure 3.5: Representation of sleep/awake state estimation by the graph cut method. The red x’s
represent the going to bed time and the green circles the awake time, both from the SeD
that the analysis was preformed from Monday until the next Monday morning, and it can be seen that
in the last two complete days of analysis, corresponding to the weekend, the signal α − β is substantially
different than in the other days, since it grows from morning until night, having its maximum before
going to bed, and it is know that in these two days the subject had a quiet relaxing time at home. On the
other hand, the first three days correspond to Monday, Tuesday and Wednesday, and they were normal
days of works, with α − β having its maximum in the morning and decreasing until the patient has gone
to bed, indicating more activity in the morning that decays along the day, as expected.
Figure 3.6: Zoom of the first day bed and awake times from the Fig.3.5
On the Thursday it was relatively normal day of work, but the patient stayed up until late, about 4
or 5 a.m., and so the α − β pattern of that day does not seem like one of the normal working days nor
the weekend days. On the Friday was waking up late, some exercise and sleeping early, so α − β is again
unusual, not low neither high.
3.3
Second case of disturbed sleep with SeD data
This second test was performed in 11 days and the sleep diary information was acquired with the
developed SeD method. Fig.3.7 display the estimated parameters. The α and β parameters may seem a
17
little more noisy then in the last case, indicating that the SV pattern was not as regular as with the last
case subject. Other remarkable difference is that cM never goes over 50 mG except for one peak that
reached about 100 mG, and since we have the SeD data available for this patient and it has no mark of
exercise, this reinforces the correlation between exercise and the parameter cM .
Figure 3.7: Second example of estimated parameters in a disturbed sleep condition.
Comparing the SeD data with the SV state estimation, it can be observed that sometimes the x’s (the
time that patient has marked as gone to bed) appear right before the awake to sleep transition, other
times we have two consecutive marks and some days there are not marks at all, so although some marks
confirm the sleep/awake transitions, others are not that reliable confirming the lack of accuracy of the
traditional method to collect the sleep diary information.
Figure 3.8: Sleep/awake state estimation respecting Fig.3.7 case.
The SV state variable shows clearly a non regular pattern along the circadian cycle with sleeping
episodes during the day and short and irregular sleeping periods. The sleeping disorders of this patient
are clearly reveled by the sv(n) = α(n) − β(n) signal.
18
3.4
An insomnia case
This example is about a diagnosed case of insomnia. Fig.3.9 displays the estimated parameters for this
patient. Although the patient passes considerable time in bed, he can’t get a good sleep, so he usually
takes a nap during the afternoon. The sleeping time can easily be seen in the α and β coefficients.
Figure 3.9: Parameters estimated from a case of insomnia.
If we look at the midnight bars, it is almost always when the subject goes to bed, a decrease in α and
an increase in β is observed, as expected, indicating that the patient is in the bed presumably sleeping.
But then again, before the next midnight, it can be observed the same behavior indicating the nap.
The analysis of the SV state signal, displayed in Fig.3.9, allows to conclude that the very same method
that was used to estimate the SV state in the first case, detects a sleep time between the night times in 4
out of the 7 days. Unfortunately there was no SeD available for this case, so it was impossible to confirm
the going to bed time and the number of naps that patient really took.
Figure 3.10: Graph cut sleep/awake estimation for the case of insomnia.
19
3.5
Model validation
In order to validate the Maxwell distribution in describing the day time actigraph sensor output signal
statistical tests are performed and comparison with the normal distribution are made.
The tests consist in compute the fitting error when using the proposed mixture with a Maxwell and
normal distributions with the fitting results by using a mixture of two normal distributions. The results
are shown in Table 3.1.
Table 3.1: Percentage of ǫMN ≤ ǫN N
Case
Kolmogorov
Norm(r)
Kullback
1
66.2512
70.3785
69.3588
2
63.9847
60.4691
59.6275
3
61.2173
60.8583
61.5839
The first column corresponds to Kolmogorov-Smirnov test, the second one is the Euclidean norm of
the residual vector, and the third one its from the Kullback-Leibler divergence. From the Table 3.1 can
be seen that in a general way, the distribution consisting of two Normal ones, is a worst approximation for
the data then the Normal-Maxwell one for about 60 to 70% of the samples. These tests and the fact of the
Normal-Maxwell model has a physical foundation, suggests that the probability distribution function for
the acceleration intensities composed by a Normal and a Maxwell distribution is an appropriated model
for the actigraph data. However, the small advantage of using the Maxwell-Normal model over a pure
mixture of Gaussians suggest that this last solution may be better because a lot of fast and optimized
algorithms are described in the literature for fitting with Gaussian mixtures.
3.6
Toward a definition of human Activity (ACT)
The analysis of the results described in this section, makes it possible to conclude that the ACT may
be characterized by a vector of parameters, e.g., θ = {α, σM , cM , β, σN , cN }T , where α and β represent
the importance of each distribution, or the prevalent vigil or sleep activity modes. The intensity of
each type of activity is associated with the variables cM and cN , the cM was showed to be higher when
intense exercise occurs, and in the same way, higher cN values might be used to measure the sleep physical
activity. Between the intense exercise category, each type of exercise may be distinguished by the set cM
and σM .
Additionally, the ACT may be characterized by these parameters jointly with another physiological
variables, such as the cardiac rhythm, breathing rate, EEG or even with non-physiological variables like
luminosity or the actigraph orientation. The specific set of parameters used to characterize the ACT
variable should depend on the objective of the study or the type of disorder.
20
Chapter 4
Conclusion
This thesis describes a methodology to the analysis of the actigraph sensor output signal in order to
reveal relevant characteristics used in the diagnosis of sleep disorders. It is suggested that the actigraph
signal may be accurately described by a mixture of a Maxwell and normal distributions. The derivation
of the Maxwell distribution is based on assumption based on the physical principles of the device sensor
and the normal distribution is an approximation of a Poisson distribution, derived from physiological
considerations.
The key issue in this method is the concept of purposeless activity. During the vigil state the movements have usually a purpose, they are coherent and coordinated which leads to a statistical distribution
of the actigraph signal different from the one obtain during the sleep state where the purposeless nature
of the movements, more impulsive, non coherent and usually more sparsely distributed along the time,
induces the generation of a very different distribution on the acigraph signal.
It was shown that the vector, θ, containing the parameters of the distributions involved in the mixture
is a promising candidate to this definition. In fact, more important than the signal intensity, the type of
movements seems to be better in the characterization of the state Sleep/Vigil of the patient. However,
the vector θ, allows also to extract the signal intensity, allowing to extract additional relevant information
about the activity.
The process used to estimate ACT involves a fitting procedure, outliers removing and Kalman filtering
of noisy signal with missing data.
The ACT signal is used to estimate the Sleep/Vigil (SV) state variable which is correlated with
information extracted from a Sleep e-Diary (SeD) developed in the scope of this work. The correlation
of both data have shown a good match suggesting that the proposed method to process the actigraph
signal is useful in the diagnosis of sleep disorders.
Experimental results using real data from true patients are presented and confirm the ability of the
method to detect abnormal pattern on the circadian cycle of the sleep.
Improvements on the method are needed in order to extract additional information, namely, quantification of the activity level during the sleep state or activity characterization during the vigil state.
21
Bibliography
[1] S. R. Pandi-Perumal and Damien Leger. Sleep Disorders: Their Impact on Public Health. December
2006.
[2] Roger J. Cole, Daniel F. Kripke, William Gruen, Daniel J. Mullaney, and J. Christian Gillin. Automatic sleep/wake identification from wrist activity. Sleep, 15(5):461–469, 1992.
[3] Anna Kawinska Jean Paquet and Julie Carrier. Wake detection capacity of actigraphy during sleep.
Sleep, 30(10):1362–1369, 2007.
[4] Jean-Louis G, Kripke DF, Cole RJ, Assmus JD, and Langer RD. Sleep detection with an accelerometer actigraph: comparisons with polysomnography. Physiology & behavior, 72(1-2):21–8, January
2001.
[5] Timothy Morgenthaler, Cathy Alessi, Leah Friedman, Judith Owens, Vishesh Kapur, Brian
Boehlecke, Terry Brown, Andrew Chesson, Jack Coleman, Teofilo Lee-Chiong, Jeffrey Pancer, and
Todd J. Swick. Practice parameters for the use of actigraphy in the assessment of sleep and sleep
disorders. Sleep, 30(4):519–529, 2007.
[6] Ancoli-Israel S, Cole R, Alessi C, Chambers M, Moorcroft W, and Pollak CP. The role of actigraphy
in the study of sleep and circadian rhythms. Sleep, 26(3):342–92, May 2003.
[7] Dean Cvetkovic and Irena Cosic. Sleep Onset Estimator: Evaluation of Parameters. Vancouver,
British Columbia, Canada, August 2008.
[8] DSc Avi Sadeh. Commentary: Comparing actigraphy and parental report as measures of children’s
sleep. Journal of Pediatric Psychology, 2008.
[9] Shao-Yu Tsai, Susan E. Labyak, Laura P. Richardson, Martha J. Lentz, Patricia A. Brandt,
Teresa M. Ward, and Carol A. Landis. Brief report: Actigraphic sleep and daytime naps in adolescent
girls with chronic musculoskeletal pain. Journal of Pediatric Psychology, December 2007.
[10] MD Avi A. Weinbroom, MD Ron Ben-Abraham, and BSC Jacob Zomer. Wrist actigraphy in anesthesia. Canadian Journal of Anesthesia, 48:713–714, 2001.
[11] Gerene S. Bauldoff, Nancy A. Ryan-Wenger, and Philip T. Diaz. Wrist actigraphy validation of
exercise movement in copd. Western Journal of Nursing Research, 29(7):789–802, November 2007.
22
[12] Isabelle Hourmand-Ollivier, Marie-Astrid Piquet, Jean Pierre Toudic, and Thông Dao Pierre Denise.
Actigraphy: A new diagnostic tool for hepatic encephalopathy. World Journal of Gastroenterology,
12(14):2243–2244, April 2006.
[13] http://www.sleepeducation.com/pdf/sleepdiary.pdf.
[14] http://www.shuteye.com/docs/pdf/sleepdiary.pdf.
[15] Rosekind MR, Smith RM, Gregory KB, and Miller DL. Nasa airlog: an electronic sleep/wake diary.
Sleep Research, 25:525, 1996.
[16] Stages of Sleep, 1998.
[17] Vctor Gimeno, Teresa Sagales, Luchi Miguel, and Mercedes Ballarin. The statistical distribution of
wrist movements during sleep. Neuropsychobiology, 38:108–112, 1998.
[18] Harumi Shinkoda, Kazuya Matsumoto, Jouji Hamasaki, Yoojin Seo, Young Man Park, and
Kwang Pak Park. Evaluation of human activities and sleep-wake identification using wrist actigraphy.
Psychiatry and Clinical Neurosciences, 52(2):157–159, 1998.
[19] MD Maria Sunseri, MD Craig B. Liden, MSc Jonny Farringdon, MS. LC Ray Pelletier, Scott Safier,
M.S John Stivoric, Ph.D. Astro Teller, and MS.EE SureshVishnubhatla. The sensewearT M armband
as a sleep detection device.
[20] http://www.analog.com/static/imported-files/data sheets/ADXL330.pdf.
[21] MD A. N. Vgontzas and M A. Kales. Sleep and iis disorders. Annual Review of Medicine, 50:387–400,
February 1999.
[22] G. A. F. Seber and C. J. Wild. ANonlinear Regression. John Wiley and Sons Incg, 1989.
[23] R. E. Kalman. ”a new approach to linear filtering and prediction problems”. ransaction of the
ASME-Journal of Basic Engineering, pages 35–45, March 1960.
[24] Greg Welch and Gary Bishop. An introduction to the kalman filter. July 2006.
[25] Yuri Boykov, Olga Veksler, and Ramin Zabih. Fast approximate energy minimization via graph cuts.
IEEE Trans. Pattern Anal. Mach. Intell., 23(11):1222–1239, 2001.
[26] Vladimir Kolmogorov and Ramin Zabih. What energy functions can be minimizedvia graph cuts?
IEEE Trans. Pattern Anal. Mach. Intell., 26(2):147–159, 2004.
[27] Milton Abramowitz and Irene A. Stegun. Handbook of Mathematical Functions with Formulas,
Graphs, and Mathematical Tables. Dover, New York, ninth dover printing, tenth gpo printing
edition, 1964.
23
Appendices
A
Maxwell distribution
Let us consider the acceleration vector a = {ax , ay , az } where the components are independent and normal
distributed with mean µx , µy and µz respectively and variance σ 2 , p(ax ) = N (µx , σ 2 ), p(ay ) = N (µx , σ 2 )
and p(az ) = N (µz , σ 2 ), leading to,
p(ax , ay , az ) =
2
2
2
1
1
√
e− 2σ2 ((ax −µx ) +(ax −µy ) +(ax −µz ) )
(σ 2π)3
(A.1)
By using the following polar coordinates transformation,
ax
= r cos(θ) sin(φ)
ay
= r sin(θ) sin(φ)
az
= r cos(φ)
(A.2)
and the equality p(r, θ, φ) = |J|p(ax , ay , az ), where J = −r2 sin(φ), is the Jacobian of the transformation,
it leads to
µz cos(φ)+t sin(φ) cos(θ−α)
r2 − r2 +T2 2
1
σ2
e 2σ | sin(φ)|er
p(r, θ, φ) = √
( 2π)3 σ 3
q
q
where T = µ2x + µ2y + µ2z , t = µ2x + µ2y and α = arctan (µy /µx ).
RπRπ
The distribution of the acceleration magnitude is p(r) = 0 −π p(r, θ, φ)dθdφ,
Z
Z π
r cos(φ)µz
rt
r2 − r2 +T2 2 π
1
2σ
σ2
|
sin(φ)|e
e σ2 sin φ cos (θ−α) dθ dφ
e
p(r) =
(2π)3/2 σ 3
0
−π
|
{z
}
(A.3)
(A.4)
2πI0 ( σrt2 sin(φ))
=
2π r2 − r2 +T2 2
e 2σ
(2π)3/2 σ 3
Z
π
sin(φ)e
r cos(φ)µz
σ2
0
I0
rt
sin(φ)
dφ
σ2
(A.5)
where I0 (x) is the zero order Modified Bessel Function of the First Kind [27] represented in Fig. A.1.
If
rt
σ2
sin(φ) < 1 then I0 ( σrt2 sin(φ)) ≈ 1 which leads to the following simplification
r
rµ r2 +T 2
2 r
z
p(r) =
e− 2σ2
sinh
π µz σ
σ2
(A.6)
and if µx = µy = µz = 0
p(r) =
r
2 r2 − r22
e 2σ
π σ3
24
(A.7)
First Kind Modified Bessel Function
2.5
I0(x)
2
1.5
1
0
0.2
0.4
0.6
0.8
1
x
1.2
1.4
1.6
1.8
2
Figure A.1: Modified Bessel Function of the First Kind.
Figure A.2: Maxwell distribution.
which is the Maxwell distribution [27] represented in Fig. A.2 with the following mean and standard
deviation,
r
2
µM = 2σ
π
r
3π − 8
σM = σ
π
(A.8)
(A.9)
The distribution defined in (A.5) is displayed in Fig. A.3 for different values of µx = µy = µz = µ =
{0, 1, ..., 20}. As may be observed different values of µ leads to Maxwell like shape distributions with
different shifting and spreadings. Therefore, the strategy adopted in the parameter estimation step to
compute a shifting value cM and a standard deviation σM of an arbitrary shifted Maxwell distribution
is in accordance with the actigraph sensor model adopted in this work, described in this appendix.
B
Sleep electronic diary
About the SeD developed, the main level block diagram of its operation is represented in Fig.B.1. It
operates based on a list of events, in there are kept the events registered by the user and the list can be
edited at will trough the main menu. At the same time, the alarm generator module analyzes the list
and checks for possible missing events, like at least two meals a day, or at least one going to bed and
25
`
0.06
P=0
0.05
0.04
P=20
0.03
0.02
0.01
0
0
10
20
30
40
50
60
Figure A.3: Distribution function for different values of µ = {0, 1, ..., 20}.
awake mark per day, prompting the user if he didn’t forget to introduce an event.
Figure B.1: Simple block diagram of the SeD operation
Now in the next Fig.B.1, is the block diagram for the SeD main menu, corresponding to the Fig.1.2.
Entering the main menu there are 4 choices, insert event, edit list, graphic mode and transferring data.
The second choice, edit list, allows the user to search trough the list of day with events registered,
from where he can select one and see what events are in that day. Once the day is selected, the patient
can either erase the event, or alter the type, date and time or intensity of the event.
Graphic mode is mainly to represent the events registered over a timeline, so that the user can have
a better spatial perception of his events along the time.
Finally, when transferring data is selected, it leads to choosing the transferring method, which can
be SMS, Bluetooth, E-mail or infrared, depending on the mobile phone capabilities. Once the user has
chosen the desired method, then information is transferred in an encrypted text file, so it can be read by
appropriate software.
26
Figure B.2: Block diagram of the SeD main menu
C
Submitted patent
Now, starting on the next page, it will be presented below the original text of the patent request
◦
n. PT 104157 submitted on August 8, respecting the SeD. The text is written in Portuguese language,
because that’s how it had to be for submission.
27
Resumo
Sistema de registo de eventos em diário electrónico,
implementado em telemóvel, para auxílio no diagnóstico de
distúrbios do sono
O presente evento é um diário electrónico do sono para
registo
de
eventos
quotidianos
relevantes
para
o
diagnóstico e análise de distúrbios do sono.
Este diário electrónico, desenhado para ser utilizado em
telemóveis ou agendas electrónicas (“palmtops”), pretende
tirar partido da crescente disseminação e contínuo aumento
da
capacidade
Desta
forma
computacional
pretende-se
funcionalidades
que
deste
tipo
de
disponibilizar
tipicamente
só
dispositivos.
a
estão
baixo
custo
disponíveis
em
equipamentos de alta tecnologia.
Os eventos, tais como deitar e acordar, são seleccionados
pelo
paciente
facilmente
a
partir
configurável
de
pelo
uma
lista
médico,
e
pré-definida,
registados.
A
inserção de eventos é guardada juntamente com o evento
seleccionado de forma automática, tal como o dia e a hora
da inserção, sendo no entanto possível inserir uma data e
hora diferentes caso se trate de um evento esquecido e
registado fora de tempo. Certos tipos de eventos, tais como
dores
de
cabeça
ou
fadiga,
podem
ser
adicionalmente
caracterizados e guardados no telemóvel.
O sistema permite a inserção de eventos numa lista que pode
ser editada e transferida por via electrónica para o médico
para análise e aplicação no diagnóstico de distúrbios de
sono.
28
Figura para publicação
29
Descrição
Sistema de registo de eventos em diário electrónico,
implementado em telemóvel, para auxílio no diagnóstico de
distúrbios do sono
O presente evento é um diário electrónico do sono para
registo
de
eventos
quotidianos
relevantes
para
o
diagnóstico de distúrbios do sono. No presente invento é
apresentado um sistema de registo de eventos desenhado para
funcionar
em
telemóveis
ou
agendas
electrónicas
("palmtops"). O sistema permite a inserção de eventos numa
lista
que
electrónica
pode
para
ser
o
editada
médico
para
e
transferida
análise
e
por
via
aplicação
no
diagnóstico de distúrbios de sono. A denominação do sistema
é diário electrónico de sono ou em inglês, “sleep e-diary”.
Palavras-chave
Biomedicina, diário do sono, diário electrónico, telemóvel,
distúrbios sono
Estado da arte
O registo de eventos do dia-a-dia quotidiano é necessário
em muitos contextos clínicos designadamente no diagnóstico
de
disturbios
de
sono.
Normalmente
este
processo
é
realizado manualmente anotando o evento em papel. Para esse
efeito foram desenhados formulários específicos como por
exemplo os que estão representados na Fig.1 ou na Fig. 2.
30
Mais
recentemente,
tecnologias,
com
começaram
o
desenvolvimento
a
ser
das
desenvolvidos
novas
diários
electrónicos tais como os descritos nas patentes americanas
D512042, 4385291 ou 4975842. Enquanto que estes diários são
para
registo
de
eventos
diversos,
há
também
diários
desenvolvidos especificamente para os disturbios de sono,
como por exemplo o NASA AIRLOG (ROSEKIND MR, SMITH RM,
GREGORY
KB,
MILLER
sleep/wake
DL,
diary,
NASA
Sleep
AIRLOG:
Research
an
electronic
1996;
25:
525,
http://www.websciences.org/cftemplate/NAPS/archives/indiv.c
fm?ID=19960539).
Os
dispositivos
electrónicos
utilizados
nos
sistemas
referidos são todos dedicados para efeito e o seu preço é
elevado.
Antecedentes e descrição do invento
A estimação da actividade humana diária e a sua correlação
com algumas variáveis fisiológicas ou eventos normais da
actividade
quotidiana
diagnóstico
e
afectam
grande
uma
é
um
tratamento
procedimento
de
fundamental
perturbações
percentagem
da
do
população
sono
dos
no
que
países
ocidentais.
As
variáveis
fisiológicas
electrocardiograma,
o
podem
pulso
ou
ser
o
a
temperatura,
o
electroencefalograma
(EEG). A actigrafia é particularmente útil neste contexto
pois é uma medida directa da actividade humana. Os dados da
actigrafia são obtidos a partir de um acelerómetro de 3
eixos
colocado
normalmente
no
pulso
do
paciente
e
que
regista os movimentos do pulso durante a actividade diária
e durante o sono.
31
A correlação dos dados do actígrafo com os eventos normais
do
dia-a-dia
permite
detectar
padrões
anormais
de
comportamento o que é fundamental no diagnóstico de alguns
distúrbios do sono.
Nesta patente é descrito um sistema constituído por um
diário electrónico do sono implementado num telemóvel. Este
diário
permite
ao
paciente
registar
facilmente
eventos
diários e respectivos marcadores temporais, tais como os
momentos de deitar, acordar, das refeições, etc. A difusão
generalizada de telemóveis, a sua cada vez maior capacidade
de processamento, armazenamento e transmissão, torna este
equipamento particularmente apropriado para esta aplicação.
Os dados do diário do sono são sobrepostos ao sinal do
actígrafo de forma a correlacionar as actividades diárias e
nocturnas como a informação da actividade.
Este diário electrónico, desenhado para ser utilizado em
telemóveis ou agendas electrónicas (“palmtops”), pretende
tirar partido da crescente disseminação e contínuo aumento
da
capacidade
Desta
forma
computacional
pretende-se
funcionalidades
que
deste
tipo
de
disponibilizar
tipicamente
só
estão
dispositivos.
a
baixo
custo
disponíveis
em
equipamentos de alta tecnologia.
A metodologia permite registar os eventos de forma simples,
tais como deitar e acordar, seleccionando-os a partir de
uma
lista
pré-definida.
Esta
lista
é
facilmente
configurável pelo médico consoante as necessidades de cada
paciente.
Durante
a
inserção
32
de
eventos
é
guardada
juntamente
com
o
evento
seleccionado,
e
de
forma
automática, o dia e a hora da inserção, sendo no entanto
possível inserir uma data e hora diferentes caso se trate
de um evento esquecido e registado fora de tempo. Certos
tipos de eventos, tais como dores de cabeça ou fadiga,
podem ser adicionalmente caracterizados por uma intensidade
que é também ela requerida ao utilizador e guardada no
telemóvel.
Além da inserção de eventos, o diário permite também a sua
visualização em modo de texto, devidamente organizados por
dias, ou em modo gráfico, representados num eixo temporal,
para uma melhor percepção da sua distribuição.
A lista de eventos pode ser editada permitindo a alteração
do conteúdo de qualquer campo, a eliminação completa de um
dado evento ou mesmo a inserção de novos eventos, sem ter
que utilizar a interface normal.
Este diário possui ainda um alarme que alerta o utilizador
para a não inserção de eventos que são espectáveis de ter
um
período
relativamente
bem
definido,
tais
como
o
deitar/acordar ou refeições.
No fim ou durante o período de registo o ficheiro onde
estão guardados os eventos pode ser transferido em formato
digital por Short Message Service (SMS), Bluetooth, correio
electrónico ou infravermelhos para um qualquer dispositivo
remoto compatível, designadamente para o computador pessoal
do médico.
33
Sistema de registo electrónico de eventos implementado num
telefone celular
Este sistema é uma ferramenta utilizada no diagnóstico de
distúrbios do sono e designa-se em inglês por sleep ediary. O sistema é desenvolvido para telefones celulares ou
agendas electrónicas ("palmtops") permitindo disponibilizar
ao
utilizador
desenvolvido
um
a
sistema
baixo
altamente
custo,
sofisticado
aproveitando
a
e
elevada
capacidade computacional e disseminação generalizada destes
dispositivos.
O sistema pode ser instalado no telemóvel ou na agenda
electrónica do paciente que esteja equipado com o sistema
operativo Symbian da Nokia ou Windows Mobile da Microsoft.
Assim evita-se a utilização de equipamentos dedicados e
dispendiosos que são utilizados normalmente neste tipo de
aplicações.
O sistema possui uma lista pré-definida pelo médico com os
eventos necessários para o diagnóstico que o paciente pode
seleccionar facilmente a partir de um menu com a lista dos
eventos.
A selecção de um evento conduz ao seu armazenamento num
ficheiro
juntamente
com
a
hora
e
a
data
em
que
foi
armazenado. Durante o processo, o utilizador pode alterar a
data
e
a
hora
presentes
apresentadas,
caso
esteja
a
introduzir um evento que já tenha ocorrido.
Para alguns tipos de eventos também é pedido ao utilizador
um valor de intensidade, como por exemplo, dor de cabeça ou
sonolência, de forma a caracterizar a intensidade do evento
que se está a registar.
O
Utilizador
armazenada,
pode
em
qualquer
acrescentando
altura
eventos
34
de
editar
que
a
se
lista
tenha
esquecido,
apagar
associados.
Pode
eventos
ainda
ou
alterar
acrescentar
os
dados
a
eles
comentários
a
cada
registo/evento.
O sistema permite a visualização da lista em modo de texto,
por dias ou em modo gráfico em que os vários eventos são
representados em modo gráfico sobre uma linha temporal com
os marcadores das horas e dos dias.
O sistema permite, em qualquer momento, a transferência da
lista, em formato digital, por Short Message Service (SMS),
Bluetooth, correio electrónico ou infravermelhos para um
qualquer dispositivo remoto compatível, designadamente para
o computador pessoal do médico para análise.
O sistema possui um mecanismo inteligente automático de
análise da lista que gera alarmes quando inconsistências
são detectadas ou acontecimentos esperados não acontecem.
Por
exemplo,
quando
alguns
eventos
periódicos
não
são
introduzidos ou o evento "deitar" aparece duas vezes de
seguida sem o evento "levantar" pelo meio.
Diagrama de blocos (Fig. 3)
A
estrutura
do
sistema
está
representada
na
Fig.
3.
O
sistema é constituído pelo menu principal (1) e pelo módulo
gerador de alarmes (3) que operam sobre uma lista guardada
em formato de texto no telemóvel onde estão guardados os
eventos (2). No menu principal estão disponíveis as opções
que permitem alterar a lista de eventos já armazenados,
tais como inserir um novo evento (4) ou editar um evento já
existente (5). No menu principal acede-se também ao modo
gráfico (6) e ao módulo de transferência de dados (7). O
módulo
gerador
guardados
na
de
alarmes
lista
e
apenas
gera
35
analisa
alarmes
em
os
eventos
caso
de
inconsistências na lista existente, como por exemplo quando
existem
dois
eventos
de
“deitar”
sem
haver
nenhum
de
“acordar” pelo meio, ou se não houver nenhum evento de
refeição num dia. Ou seja, em qualquer situação anormal que
seja possível detectar e que resulte provavelmente de um
esquecimento ou engano do paciente.
Diagrama de blocos do menu principal (Fig. 4)
O esquema detalhado do sistema está representado na Fig. 4.
A
partir
do
menu
principal
(1)
existem
quatro
opções.
Seleccionando a primeira, “Inserir evento” (4), passa-se
para a lista dos eventos disponíveis (8) cujo um exemplo
está na Fig. 5 (27). A lista dos eventos que aparecem
disponíveis é configurável consoante o tipo de diário que o
médico necessite e onde também é possível indicar quais os
eventos
que
associada.
têm
uma
Seleccionado
catracteristica
que
está
o
de
evento
intensidade
que
se
quer
registar é agora pedido que se insira a data (9) e (28) e
de seguida a hora (10) e (29). Por fim, caso o evento
esteja na lista de eventos disponíveis como um evento ao
qual esteja associada uma intensidade, no caso de ser uma
dor de cabeça por exemplo, é então requerido ao utilizador
que introduza uma intensidade de 1 a 5 por questões de
conveniência e padronização (12) e (30).
Seleccionando “Editar lista” (5) a partir do menu principal
aparece
uma
lista
com
os
dias
em
que
existem
eventos
registados (14) como está exemplificado na Fig. 6 (31), e
ao selecionar o dia pertendido aparece uma outra lista com
os eventos registados nesse dia (15) e (32). Ao seleccionar
o evento pretentido é então possível apagar o evento (16),
alterar o seu tipo (17), alterar a data e/ou hora a que
36
este
ocorreu
(18)
ou
alterar
a
intensidade
(19),
caso
aplicável.
Escolhendo o “Modo gráfico” (6) é possível visualizar os
eventos distribuidos ao longo de uma linha temporal.
Por último, ao seleccionar “transferir dados” (7) passa-se
ao
menu
com
os
meios
de
transferência
exemplificado na Fig. 7 (33).
Lisboa, 18 de Julho de 2008
37
possíveis
(21)
Reivindicações
1) Sistema de registo electrónico de eventos implementado
num telefone celular para diagnóstico de distúrbios do
sono, caracterizado por um sistema operativo Symbian da
Nokia
ou
Windows
Mobile
da
Microsoft
instalado
num
telemóvel ou agenda electrónica (“palmtop”), possuindo
uma lista pré-definida e configurável com os eventos
necessários ao diagnóstico, acessibilidades na inserção
dos dados e registo automático dos mesmos juntamente com
o dia e a hora da inserção dos dados registados, sendo o
registo
gerado
pela
selecção,
editável,
e
com
transferência da informação por via electrónica para um
outro equipamento, constituida por: menu principal (1),
lista de eventos (2) e gerador de alarmes (3).
2) Sistema de registo electrónico de eventos de acordo com
a reivindicação 1, caracterizado por o Menu Principal e
conter os seguintes caracteristicas e funções:
a) Inserir Evento (4), definindo o tipo de invento (8), a
data, a hora, e a intensidade (11), e finalizando
(output) com evento inserido (13);
b) Editar Lista (5), definindo o dia e o evento, podendo
este ser apagado, alterado no tipo, alterado na hora
e/ou alterado na intensidade, e finalizando (output)
com o “evento alterado”
c) Modo gráfico(6)
d) Transferência de dados (7), definindo a selecção do
meio
de
“Bluetooth”,
transferência,
“E-mail”,
nomeadamente
e
“Infravermelhos”
finalizando com os dados transferidos.
38
“SMS”,
e
3) Sistema de registo electrónico de eventos de acordo com
as
reivindicações
1
e
2,
caracterizado
por
passos
complementares e opcionais, nomeadamente:
a) Certos tipos de eventos, tais como dores de cabeça ou
fadiga
ou
sonolência,
caracterizados
por
poderem
uma
ser
intensidade
adicionalmente
e
guardados
no
telemóvel e posteriormente transferidos;
b) Possibilidade de inserir uma data e hora diferentes
caso se trate de um evento esquecido e registado fora
de tempo;
c) Possibilidade
de
acrescentar
comentários
a
cada
registo/evento.
4) Sistema de registo electrónico de eventos de acordo com
as
reivindicações
1
e
2,
caracterizado
pela
transferência da lista, em formato digital, por Short
Message Service (SMS), Bluetooth, correio electrónico ou
infravermelhos
para
um
qualquer
dispositivo
remoto
compatível, designadamente para o computador pessoal do
médico, para análise.
5) Sistema de registo electrónico de eventos de acordo com
as
reivindicações
1
e
2,
caracterizado
por
a
visualização da lista em modo de texto, por dias ou em
modo gráfico em que os vários eventos ser representados
em
modo
gráfico
sobre
uma
linha
temporal
com
os
marcadores das horas e dos dias.
6) Sistema de registo electrónico de eventos de acordo com
as reivindicações 1 e 2, caracterizado por um mecanismo
inteligente
alarmes
automático
aquando
de
de
análise
inconsistências
da
ou
lista
que
gera
acontecimentos
inesperados.
7) Sistema de registo electrónico de eventos de acordo com
as reivindicações 1, caracterizado pela sua visualização
39
conjunta no telemóvel com os dados de actigrafia obtidos
a partir de um actígrafo de 3 eixos colocado normalmente
no pulso do paciente e que regista os seus movimentos
durante a sua actividade diurna e nocturna.
Lisboa, 8 de Agosto de 2008
40
Fig.1
41
Fig. 2
42
Fig.3
Fig. 4
43
Fig. 5
Fig. 6
Fig. 7
44
D Code
All of the code here represented was written on Python, next follows the code for the sleep ediary to work on a cell phone.
import socket,appuifw,e32
from e32db import format_time
from time import *
f = open(u'c:\\data.txt','a')
f.close()
def lereventos():
f = open('c:\\sleepsetup.txt','r')
eventos = []
iev = []
s = f.readline().decode("iso-8859-1")
while s != '':
if s[0] == '$':
iev.append(1)
else:
iev.append(0)
if s[len(s)-1] == '\n':
eventos.append(s[1:len(s)-2])
else:
eventos.append(s[1:len(s)])
s = f.readline().decode("iso-8859-1")
f.close()
return [iev, eventos]
def neventos():
f = open(u'c:\\data.txt','r')
ma = 0
buf = f.read(17)
while buf != '':
ma = max(ma, int(buf[0:4]))
buf = f.read(17)
f.close()
return ma
def listadias():
f = open(u'c:\\data.txt','r')
lis = []
buf = f.read(17)
while buf != '':
num = int(buf[6:16])
a2 = gmtime(num)
flag = 1
for day in lis:
if (day[0] == a2[0]) and (day[1] == a2[1]) and (day[2] == a2[2]):
flag = 0
if flag:
lis.append((a2[0], a2[1], a2[2]))
buf = f.read(17)
f.close()
return [map(lambda x: unicode("%d-%d-%d" % (x[2], x[1], x[0])), lis), lis]
def ajuda(x):
global I
te = gmtime(x[2])
s1 = str(te[3])
if te[4] < 10:
s2 = "0" + str(te[4])
else:
s2 = str(te[4])
if I[0][x[1]] == 1:
return "%s:%s, %s: %d" % (s1, s2, I[1][x[1]], x[3])
else:
return "%s:%s, %s" % (s1, s2, I[1][x[1]])
def listaeventos(day):
f = open(u'c:\\data.txt','r')
temp = mktime((day[0],day[1],day[2],0,0,0,0,0,0))
temp = temp + 3600
lis = []
buf = f.read(17)
while buf != '':
num = int(buf[6:16])
if ((num - temp) < 86400) and ((num - temp) >= 0) :
lis.append((int(buf[0:4]), int(buf[4:6]), int(buf[6:16]), int(buf[16])))
buf = f.read(17)
45
f.close()
return [map(lambda x: x[0], lis), map(ajuda, lis)]
def apagar(iden):
f = open(u'c:\\data.txt','r')
ap = 1
st = ""
buf = f.read(17)
while buf != '':
if int(buf[0:4]) != iden:
st += buf
buf = f.read(17)
f.close()
f = open(u'c:\\data.txt','w')
f.write(st)
f.close()
def bt_send():
try :
file=(u'c:\\data.txt')
addr, services = socket.bt_obex_discover()
service = services.values()[0]
socket.bt_obex_send_file(addr,service,file)
appuifw.note(u"Dados enviados","info")
except Exception, e :
appuifw.note(u"Erro: %s" %e, "error")
def inserir(n, ev, tempo, nivel):
f = open(u'c:\\data.txt','r')
buf = f.read(17)
flag = 1
st = ""
while buf != '':
if flag and tempo < int(buf[6:16]):
st += u"%4d%2d%10d%d" % (n, ev, tempo, nivel)
flag = 0
st += buf
buf = f.read(17)
f.close()
if flag:
st += u"%4d%2d%10d%d" % (n, ev, tempo, nivel)
f = open(u'c:\\data.txt','w')
f.write(st)
f.close()
L = [u'Insert event', u'Edit list', u'Graphic mode', u'Transferring data']
T = [u'SMS', u'Bluetooth', u'E-mail', u'Infrared']
I = lereventos()
nev = neventos()
while(True):
appuifw.app.title=u"Sleep Diary"
index = appuifw.selection_list(choices=L , search_field=1)
if index == None:
break
if index == 0:
appuifw.app.title=u"Insert event"
while(True):
ind = appuifw.selection_list(choices=I[1] , search_field=1)
if ind == None:
break
if type(ind) == int:
data = appuifw.query(u"Insert date:", "date", time() - altzone)
if type(data) == int or type(data) == float:
hora = appuifw.query(u"Insert time:", "time", time() - altzone)
if type(hora) == int or type(hora) == float:
nev += 1
if I[0][ind] == 1:
intensi = appuifw.query(u"Insert intensity (1 to 5):", "number")
while (not (intensi > 0 and intensi < 6)):
intensi = appuifw.query(u"Insert intensity (1 to 5):", "number")
inserir(nev, ind, int(data + hora - altzone), intensi)
appuifw.note(u"Event saved", "conf")
else:
inserir(nev, ind, int(data + hora - altzone), 0)
appuifw.note(u"Event saved", "conf")
if index == 1 or index == 2:
if index == 1:
appuifw.app.title=u"Edit list"
else:
appuifw.app.title=u"Graphic mode"
[dias, nums] = listadias()
esc = 0
while esc != None:
46
esc = appuifw.selection_list(choices=dias , search_field=1)
if type(esc) == int and esc >= 0:
appuifw.app.title=dias[esc]
[indices, horas] = listaeventos(nums[esc])
escd = appuifw.selection_list(choices=horas , search_field=1)
if index == 2 and type(escd) == int:
if appuifw.query(u"Are you sure?", "query"):
apagar(indices[escd])
appuifw.note(u"Event erased", "conf")
if index == 3:
appuifw.app.title=u"Transfer data"
indext = appuifw.selection_list(choices=T , search_field=1)
bt_send()
Here is the code for the reader software that generated the Fig. 1.1:
from pylab import *
from easygui import fileopenbox
from time import *
f = fileopenbox(msg=None, title='Actigraphy data', argInitialFile=None)
while f == None:
f = fileopenbox(msg=None, title='Actigraphy data', argInitialFile=None)
f = open(f,'r')
s = f.readline()
hora = int(s[23:25])
minuto = int(s[26:28])
segundo = int(s[29:31])
tempo = 86400 - (3600*hora + 60*minuto + segundo)
for i in range(6):
s = f.readline()
act = []
if len(s) > 10:
while s != '':
act.append(int(s.strip('\n')[14:len(s)-1]))
s = f.readline()
f.close()
else:
while s != '':
act.append(int(s.strip('\n')))
s = f.readline()
f.close()
ndias = int((len(act)-tempo)/86400) + 2
ns = len(act)
if ndias > 8:
nc = 2
if ndias % 2:
(ndias/2) + 1
else:
nl = int(ndias/2)
else:
nc = 1
nl = ndias
xlbl = arange(0.0, 24.0, (24.0/86400.0))
f = fileopenbox(msg=None, title='Events set', argInitialFile=None)
while f == None:
f = fileopenbox(msg=None, title='Events set', argInitialFile=None)
f = open(f,'r')
I = []
inte = []
s = f.readline().decode("iso-8859-1")
while s != '':
if s[0] == '$':
)
else:
te.append(0)
if s[len(s)-1] == '\n':
I.append(s[1:len(s)-1])
else:
I.append(s[1:len(s)])
s = f.readline().decode("iso-8859-1")
f.close()
f = fileopenbox(msg=None, title='Diary data', argInitialFile=None)
47
while f == None:
f = fileopenbox(msg=None, title='Diary data', argInitialFile=None)
f = open(f,'r')
buf = f.read(17)
lis = []
while buf != '':
lis.append((float(buf[0:4]), float(buf[4:6]), float(buf[6:16]), float(buf[16])))
buf = f.read(17)
f.close()
comp = len(lis)
temp = gmtime(lis[0][2])
if (86400 - (3600*temp[3] + 60*temp[4])) <= tempo:
xs = map(lambda x: (x[2] - lis[0][2] + 3600*temp[3] + 60*temp[4])/86400, lis)
else:
xs = map(lambda x: (x[2] - lis[0][2] + 3600*temp[3] + 60*temp[4])/86400 + 1, lis)
ys = map(lambda x: x[1], lis)
zs = map(lambda x: x[3], lis)
n = 0
esc = (0,2,1,3)
for d in range(ndias):
pl = subplot(nl, nc, d+1)
xa = []
ya = []
aa = []
ia = []
if d == 0:
xd = list(zeros(86400-tempo,dtype = int))
xd.extend(act[0:tempo])
pl.plot(xlbl, xd, '#FFA07A')
pl.set_xlim(0.0, 24.0)
pl.set_ylim(0.0, 1400.0)
elif d == ndias-1:
xd = act[tempo + (d-1)*86400: ns]
xd.extend(list(zeros(86400-(ns-(tempo + (d-1)*86400)), dtype = int)))
pl.plot(xlbl, xd, '#FFA07A')
pl.set_xlim(0.0, 24.0)
pl.set_ylim(0.0, 1400.0)
else:
pl.plot(xlbl, act[tempo + (d-1)*86400:tempo + d*86400], '#FFA07A')
pl.set_xlim(0.0, 24.0)
pl.set_ylim(0.0, 1400.0)
for j in range(comp):
if int(xs[j]) == d:
xa.append((xs[j]-d)*24.0)
ya.append(ys[j])
aa.append(100 + 300*esc[(n-(int(n/4)*4))])
ia.append(zs[j])
n = n + 1
pl.plot(xa, aa, 'go')
pl.set_xlim(0.0, 24.0)
pl.set_ylim(0.0, 1400.0)
compa = len(xa)
for k in range(compa):
if ia[k] == 0:
text(xa[k], aa[k], I[int(ya[k])], color = 'k', fontsize=16)
else:
text(xa[k], aa[k], '%s: %d' % (I[int(ya[k])],ia[k]), color = 'k',
fontsize=16)
show()
Here at last is the code for reading the SeD data only to generate a text output:
from pylab import *
from easygui import fileopenbox
from time import *
f = fileopenbox(msg=None, title='Events set', argInitialFile=None)
while f == None:
f = fileopenbox(msg=None, title='Events set', argInitialFile=None)
f = open(f,'r')
I = []
inte = []
s = f.readline().decode("iso-8859-1")
while s != '':
if s[0] == '$':
inte.append(1)
else:
inte.append(0)
if s[len(s)-1] == '\n':
48
I.append(s[1:len(s)-1])
else:
I.append(s[1:len(s)])
s = f.readline().decode("iso-8859-1")
f.close()
fpath = fileopenbox(msg=None, title='Diary data', argInitialFile=None)
while fpath == None:
fpath = fileopenbox(msg=None, title='Diary data', argInitialFile=None)
f = open(fpath,'r')
buf = f.read(17)
lis = []
while buf != '':
lis.append((float(buf[0:4]), float(buf[4:6]), float(buf[6:16]), float(buf[16])))
buf = f.read(17)
f.close()
def listadias():
f = open(fpath,'r')
lis = []
buf = f.read(17)
while buf != '':
num = int(buf[6:16])
a2 = gmtime(num)
flag = 1
for day in lis:
if (day[0] == a2[0]) and (day[1] == a2[1]) and (day[2] == a2[2]):
flag = 0
if flag:
lis.append((a2[0], a2[1], a2[2]))
buf = f.read(17)
f.close()
return [map(lambda x: unicode("%d-%d-%d" % (x[2], x[1], x[0])), lis), lis]
def ajuda(x):
global I
te = gmtime(x[2])
s1 = str(te[3])
if te[4] < 10:
s2 = "0" + str(te[4])
else:
s2 = str(te[4])
if x[1] > 4:
return unicode("%s:%s, %s: %d" % (s1, s2, I[x[1]], x[3]))
else:
return unicode("%s:%s, %s" % (s1, s2, I[x[1]]))
def listaeventos(day):
f = open(fpath,'r')
temp = mktime((day[0],day[1],day[2],0,0,0,0,0,0))
lis = []
buf = f.read(17)
while buf != '':
num = int(buf[6:16])
if ((num - temp) < 86400) and ((num - temp) >= 0) :
lis.append((int(buf[0:4]), int(buf[4:6]), int(buf[6:16]),
int(buf[16])))
buf = f.read(17)
f.close()
return [map(lambda x: x[0], lis), map(ajuda, lis)]
dias = listadias()
ndias = len(dias[0])
if ndias <= 9:
nl = 3
nc = 3
else:
nl = 4
nc = 4
figure(facecolor = 'w')
for d in range(len(dias[0])):
pl = subplot(nl, nc, d+1)
axis('off')
eventos = listaeventos(dias[1][d])
title(dias[0][d], color = 'blue', fontsize = 14, fontweight = 'bold' )
pl.set_ylim(0.0, 14.0)
for j in range(len(eventos[1])):
text(0.1, 12 - j, eventos[1][j], color = 'black', fontsize = 13)
show()
title(u'Sleep e-diary')
49
Baixar