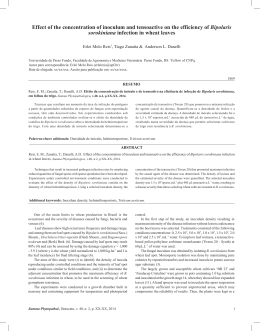
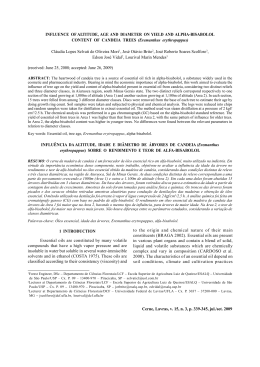
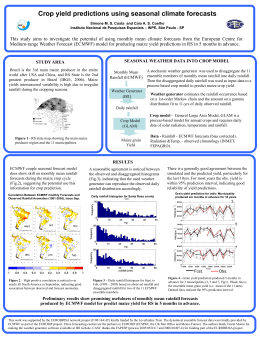
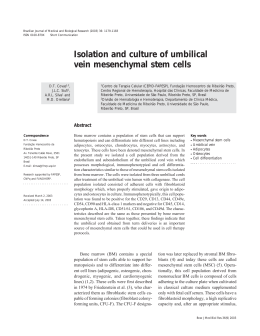
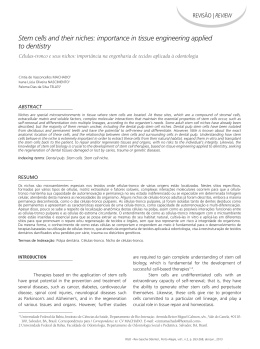
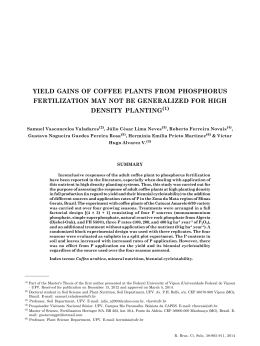
DOI: 10.5433/1679-0359.2014v35n2p589
Tillering affected by sowing density and growth regulators in wheat
Perfilhamento do trigo afetado pela densidade de semeadura e
aplicação de reguladores vegetais
Samuel Luiz Fioreze1*; João Domingos Rodrigues2
Abstract
Tillering capacity of wheat is highly influenced by environmental conditions and management practices.
This research had as objective to evaluate tiller emission, survival and contribution to grain final yield
affected by increasing sowing densities and growth regulators application in wheat. The experiment
was conducted under completely randomized block design, with subdivided plots and four replications.
Treatments consisted of four plant densities (30, 50, 70 and 90 plants m-1) combined with the application
of growth regulators [control, (IBA+GA+KT), Trinexapac-Ethyl and (IBA+GA+KT) + TrinexapacEthyl]. Tiller emission, contribution to dry matter accumulation and grain yield, survival and yield
potential in relation to the main stem were evaluated, as well as yield components and grain final yield.
The application plant growth regulators did not affect tiller emission or any other yield parameters
related to the main stem. Increasing plant densities reduced tiller emission and dry matter accumulation,
which led to lower tiller contribution and yield potential. Reduced plant densities increased grain yield
due to higher grain number and mass per ear, making up for lower number of ears per area.
Key words: Triticum aestivum L., yield potential, assimilate accumulation, IBA+GA+KT, TrinexapacEthyl
Resumo
A capacidade de perfilhamento do trigo é altamente influenciada pelo ambiente e as práticas de manejo.
Objetivou-se avaliar a emissão, a sobrevivência e a participação de perfilhos de trigo na produção de
grãos de trigo em densidades crescentes de plantas e submetido à aplicação de reguladores vegetais.
O delineamento experimental utilizado foi o de blocos casualizados em esquema de parcelas subdivididas com quatro repetições. As parcelas constaram de quatro densidades de semeadura (30, 50, 70
e 90 plantas m-1) e as sub-parcelas, pela aplicação de reguladores vegetais [controle, (IBA+GA+KT),
Etil-Trinexapac e (IBA+GA+KT) + Etil-Trinexapac]. Foram avaliados a emissão, a sobrevivência e o
potencial produtivo de perfilho em relação ao colmo principal bem como os componentes da produção
e a produtividade de grãos da cultura. A aplicação dos reguladores vegetais não afetou a emissão de
perfilhos e os parâmetros produtivos do colmo principal em plantas de trigo. A redução na emissão de
perfilhos e do acúmulo de matéria seca foi observada para elevadas densidades de plantas, reduzindo
sua participação e do potencial produtivo. A maior produção de grãos nas menores densidades de plantas
ocorreu pelo aumento do número e da massa de grãos por espiga, compensando o menor número de
espigas por metro quadrado.
Palavras-chave: Triticum aestivum L., potencial produtivo, acúmulo de assimilados, IBA+GA+KT,
Etil-Trinexapac
Prof. Auxiliar do Deptº de Ciências Agronômicas, Curso de Agronomia ,Universidade Federal de Santa Catarina, UFSC, Campus
de Curitibanos, Curitibanos, SC, Brasil. E-mail: [email protected]
2
Prof. Titular do Deptº de Botânica, Universidade Estadual Paulista Júlio de Mesquita Filho, UNESP, Instituto de Biociências,
Distrito de Rubião Júnior, Botucatu, SP, Brasil. E-mail: [email protected]
*
Author for correspondence
1
Recebido para publicação 07/11/11 Aprovado em 11/12/13
Semina: Ciências Agrárias, Londrina, v. 35, n. 2, p. 589-604, mar./abr. 2014
589
Fioreze, S. L.; Rodrigues, J. D.
Introduction
Tiller emission, development and survival have
been reported as extremely important in wheat crop
(ALVES; MUNDSTOCK; MEDEIROS, 2000;
VALÉRIO et al., 2008; VALÉRIO et al., 2009) and
pointed out as the main quantitative component
to influence grain yield (HARTWIG et al., 2007).
Tillering may affect wheat yield positively or
negatively depending on availability of natural
resources such as water, light and nutrients
(ELHANI et al., 2007).
The relationship between tillers and the main
stem is influenced by environmental conditions
during primordia initiation and in subsequent stages
(ALMEIDA; MUNDSTOCK, 2001). The effects
of competition are relevant in tiller emergence and
may affect directly final yield and yield components
(OZTURK; CAGLAR; BULUT, 2006). For the
same reason, plant density is especially important
in wheat for it influences final yield and yield
components (OZTURK; CAGLAR; BULUT, 2006)
according to cropping conditions (LLOVERAS et
al., 2004).
Hormonal balance involved in tiller emission and
development is rather complex and influenced by
auxin (Ax) and cytokinin (CK); these hormones are
related to apical dominance and dormancy breaking
of lateral buds (VALÉRIO et al., 2009; VEIT, 2006).
Altering hormonal balance through the application
of growth regulators may significantly improve plant
development, although there are few studies about
effects in wheat. This research had as objective to
evaluate tiller emission, survival and contribution
to grain final yield affected by sowing densities and
growth regulators application in wheat.
Material and Methods
590
The experiment was carried out from April to
August 2010 in Botucatu (SP), Brazil (22º49’ S,
48º25’W and 770 m asl). According to Köeppen’s
classification, climate is Cwa, which corresponds to
tropical altitude with dry winter and hot wet summer.
Soil in the area was a clayey Hapludox (FAO, 2006)
with the following physical and chemical attributes:
clay: 420.0 g kg-1; organic matter: 21.0 g dm-3; pH
(CaCl2): 5.8; Ca, Mg, K and Al: 53.0, 28.0, 2.7 and
1.0 cmolc dm-3, respectively; Presin: 33.0 mg dm-3;
base saturation: 74%.
The experimental design was the completely
randomized block, with subdivided plots and four
replications. Main plots consisted of four plant
densities (30, 50, 70 and 90 plants m-1). Subplots
consisted of the application of growth regulators
[control, (IBA+GA+KT), Trinexapac-Ethyl and
(IBA+GA+KT) + Trinexapac-Ethyl], totaling 64
experimental units. Each unit or subplot consisted
of 13 rows with 10 m length spaced 0.17 m. The
useful area was the seven central rows, except 1.0
m of each extremity, totaling 9.18 m2.
Wheat cultivar IAC 370, with intermediate height
and good adaptability in the cropping conditions
(EMBRAPA, 2010), was sown under no tillage
system in succession to soybean. Sowing densities
were 38, 63, 88 and 113 seeds m-1, which were
adjusted according to results of the germination
test (BRASIL, 2009). Sowing was carried out
mechanically at 4 cm depth with a seed drill.
Base fertilization consisted of 160 kg ha-1 of the
NPK formula 08-28-16. Side dressing consisted
of 45 and 30 kg ha-1 of N and K, respectively,
applied as ammonium sulphate and potassium
chloride at tillering stage; additionally, 45 kg ha-1
of N was applied at the end of tillering stage,
which corresponded to stages 2 and 5 in Feeks’
classification (LARGE, 1954). Water availability
was monitored in soil based on a set of mercury
tensiometers installed down to 20 cm depth and
irrigation took place whenever mercury column
reached 40 cm height. Accumulated rainfall and
total irrigation depth during the cycle was 315 mm,
which is considered optimal for wheat requirements
(EMBRAPA, 2010).
The application of 500 mL ha-1 of IBA+GA+KT
(0.05 mg L-1 of indolbutiric acid, 0.05 g L-1
Semina: Ciências Agrárias, Londrina, v. 35, n. 2, p. 589-604, mar./abr. 2014
Tillering affected by sowing density and growth regulators in wheat
gibberellic acid, and 0.09 g L-1 of kinetin) took
place at the beginning of tillering (14 days after
seedling emergence – DAE) and Trinexapac-Ethyl
was applied at 400 mL ha-1 (100 g ha-1 a.i) rate
when the first node was visible in the main stem
(60 DAE), which corresponded to stages 2 and 6 at
Feeks’ classification (LARGE, 1954), respectively.
Leaf application of both growth regulators were
conducted with a pressurized boom sprayer
equipped with 110.02 flat spray tips adjusted to
volume of 150 L ha-1.
Tiller emission was evaluated throughout
tillering stage every four days. Forty-five plants per
plot were evaluated, distributed at random in three
distinct spots. Tillers were identified according to
instructions from Masle (1985): tillers were named
after letter T, followed by the number of the leaf/
node where that tiller was originated from [MS –
main stem; T0 – tiller originated from the coleoptile
node; T1 – tiller originated from the node of the first
leaf in the main stem; Tth – tiller originated from
the node of the (n)th leaf in the main stem]. Tillers
were identified using colored cotton threads; plants
were later used for the evaluation of dry matter
accumulation and yield components.
Dry matter accumulation of both tillers and main
stem were determined at the end of tillering (42
DAE) and in the beginning of the reproductive stage
(anthesis) (73 DAE). In each stage, 10 plants with
their tillers previously identified were sampled for
dry matter evaluation of leaves, stem+leaf sheath
and reproductive structures. Yield components
were determined in 15 plants per plot through the
number of spikelets per spike, number of grains per
spikelet, number of grains per spike and mass of
grains per spike for both the main stem and tillers.
The number of spikes m-2 and the increase in the
number of spikes after tiller emission were also
evaluated. Grain yield (kg ha-1) adjusted to 13%
moisture and mass of 1,000 grains were calculated
right after harvest.
Tiller survival was determined by comparing
the number of tillers at the end of tillering and
anthesis with the number of tillers at the end of the
cycle. Tiller contribution to final grain yield was
calculated by the relationship between the final
grain production per plant and the sum of all tillers
production. Average yield potential of tillers was
calculated by the relation between the average grain
yield per tiller and the average grain yield in the
main stem, considering that main stem shows 100%
as yield potential.
Data was submitted to variance analysis by the
F test (p ≤ 0.05). Means for growth regulators were
compared by the Tukey test (p ≤ 0.05) and plant
densities by regression analysis.
Results and Discussion
Increasing plant density significantly reduced
tiller emission per plant and per m2 throughout
tillering stage (Table 1), with minimum values for
the highest densities (Figures 1 and 2). The number
of tillers per plant was close to zero in the highest
densities, similarly to the number of tillers m-2. In
this case, this is due to adjustment in the number
of plants per area, mainly in the end of tillering
(Figures 2d, 2e and 2f).
Application of growth regulators did not affected
tiller emission and dry matter accumulation.
Is important highlight that the application of
Trinexapac-Ethyl was carried out in the end of
tillering. Until this stage, only the application of
IBA+GA+KT had been accomplished whit the
objective of to stimulate the tiller emission, mainly
for higher plant densities, result no verified. The
beginning of plant elongation in wheat can be
observed at the mean stem, then for the tillers, thus,
the inhibition of mean stem elongation (TrinexapacEthyl application) could result in better development
and dry matter accumulation on tillers and great
survival rates. However, this result was not verified.
Hormonal balance involved in tiller emission and its
relationship with mean stem need, wherefore, more
research, so the plant growth handling, by growth
regulators could become a tool to improve the yield
in wheat.
591
Semina: Ciências Agrárias, Londrina, v. 35, n. 2, p. 589-604, mar./abr. 2014
Fioreze, S. L.; Rodrigues, J. D.
Table 1. Variance analysis (F values) of number of tillers per plant and square meter affected by plant densities and
growth regulators in wheat (IAC 370). Botucatu (SP), Brazil, 2010.
Bloc
Densities (D)
Growth regulator (G)
DxG
CV (%) 1
CV (%) 2
14 DAE1
1,03*
4,73*
2,11*
1,82*
301,54*
189,73*
Bloc
Densities (D)
Growth regulator (G)
DxG
CV (%) 1
CV (%) 2
14 DAE
1,71*
4,14*
1,99*
1,55*
254,34*
177,78*
Number of tillers per plant
18 DAE
22 DAE
26 DAE
1,43**
3,76**
5,34**
39,01**
52,83**
75,92**
2,81**
1,29**
0,77**
2,14**
1,89**
1,62**
68,81**
47,87**
32,17**
43,49**
31,65**
23,79**
Number of tillers per square meter
18 DAE
22 DAE
26 DAE
1,78**
3,39**
3,78**
11,91**
10,09**
10,12**
2,15**
0,69**
0,39**
1,35**
1,39**
1,35**
85,76**
65,85**
47,94**
53,26**
35,56**
26,71**
30 DAE
8,88**
135,06**
1,01**
0,99**
21,01**
19,73**
34 DAE
5,58*
126,11*
1,41*
1,34*
21,26*
17,86*
38 DAE
5,76**
120,05**
1,11**
1,01**
22,72**
16,12**
30 DAE
5,15**
11,29**
0,64**
0,79**
32,87**
22,78**
34 DAE
11,04**
30,01**
1,71**
1,13**
15,19**
20,54**
38 DAE
17,04**
48,69**
1,51**
0,88**
12,93**
19,64**
*, **Significant by the F test (p < 0.05 and <0.01 respectively); 1 plot coefficient of variation; 2 subplot coefficient of variation; 3
days after emergence.
Source: Elaboration of the authors.
Tillering potential of each genotype is the main
factor involved with the performance of a given
material and its interactions with the environment
(VALÉRIO et al., 2009). Wheat cultivar IAC 370
showed high capacity for tiller emission under low
cropping densities; however, it was significantly
influenced by the competition among plants
increased within the row. According to Destro et al.
(2001), wheat plants cropped under low densities
produce more tillers and show similar number
of spikes m-2 in the end of the cycle compared to
denser cropping.
Apical dominance is affected by the quality
of the light absorbed by phytocromes, i.e., by the
relationship between red and far red wavelengths
from total radiation (BALLARÉ et al., 1992).
Almeida e Mundstock (2001) observed that light
quality improved by adding red radiation increased
tiller emission and improved dry matter distribution
between the tillers and the main stem in wheat;
conversely, poor light quality, obtained by adding
extreme red radiation inter rows, led to high dry
matter accumulation in the main stem. Therefore,
it is noticeable there is positive interaction between
light and hormones related to the signaling cascade
that control tiller emission and development in
grasses (ALVES; MUNDSTOCK; MEDEIROS,
2000).
Competition among plants increased along with
sowing density (Table 2). Under lower densities,
increased dry matter accumulation was a clear
effect of a high number of tillers in plants cropped
in this conditions (Figures 1 and 2), once every
tiller emerged is consisted of its own stem and
leaves, which actively take part in processes of
assimilation and dry matter accumulation. Under
higher densities, reduced dry matter accumulation
at the end of tillering (Figure 3) and anthesis (Figure
4) stages was observed. The application of growth
regulators did not influence dry matter accumulation
per plant nor per area.
592
Semina: Ciências Agrárias, Londrina, v. 35, n. 2, p. 589-604, mar./abr. 2014
application of growth regulators did not influence dry matter accumulation per plant nor per area.
Tillering affected by sowing density and growth regulators in wheat
Figure 1. Number of tillers per plant affected by plant densities in wheat (IAC 370) at 18
Figure 1.(a),
Number
of tillers
per30
plant
plant
wheat
(IAC 370)
at 18 (a), 22
(b), 26 (c),
30 (d), 34
22 (b),
26 (c),
(d),affected
34 (e) by
and
38 densities
(f) daysinafter
seedling
emergence.
Botucatu
(SP),
(e) and 38Brazil,
(f) days
after
seedling
emergence.
Botucatu
(SP),
Brazil,
2010.
**p
<
0.01.
2010. **p < 0.01.
4,5
4,5
(a)
4,0
y=
0.0004x2
- 0.0603x + 2.6743
R2 = 0.99**
3,0
2,5
2,0
2,0
1,0
1,0
0,5
0,5
30
50
Plants m-1
70
90
2,5
2,0
1,0
0,5
0,5
90
Plants m-1
4,5
4,0
0.0003x2
- 0.0648x + 3.8884
R2 = 0.99**
0,0
2,5
2,0
1,0
0,5
0,5
0,0
Plants m-1
90
(e)
y = 0.0009x2 - 0.1535x + 7.9110
R2 = 0.98**
2,0
1,0
70
70
Plants m-1
2,5
1,5
50
50
3,0
1,5
30
30
3,5
Tillers plant -1
3,0
0,0
y = 0.0007x2 - 0.1348x + 7.1328
R2 = 0.98**
4,0
y=
3,5
(d)
4,5
(c)
90
2,0
1,5
70
70
2,5
1,0
50
Plants m-1
3,0
1,5
30
50
3,5
Tillers plant -1
3,0
0,0
30
4,0
y = 0.0004x2 - 0.0677x + 3.3846
R2 = 0.99**
3,5
0,0
4,5
(b)
4,0
Tillers plant -1
2,5
1,5
4,5
Tillers plant -1
3,0
1,5
0,0
y = 0.0004x2 - 0.0776x + 4.6932
R2 = 0.99**
3,5
Tillers plant -1
Tillers plant -1
3,5
(d)
4,0
90
30
50
Plants m-1
70
90
Source: Elaboration of the authors.
Source: Elaboration of the authors.
593
Semina: Ciências Agrárias, Londrina, v. 35, n. 2, p. 589-604, mar./abr. 2014
Fioreze, S. L.; Rodrigues, J. D.
Figure 2. Number of tillers per m2 affected
by plant densities in wheat (IAC 370) at 18 (a), 22 (b), 26 (c), 30 (d), 34
2. Number
tillers emergence.
per m2 affected
by (SP),
plantBrazil,
densities
wheat
(IAC 370) at 18 (a), 22 (b), 26
(e)Figure
and 38 (f)
days afterof
seedling
Botucatu
2010.in**p
< 0.01.
(c), 30 (d), 34 (e) and 38 (f) days after seedling emergence. Botucatu (SP), Brazil, 2010. **p < 0.01.
800
800
(a)
y = -3.2125x + 305
R2 = 0.99**
600
600
500
500
Tillers m-2
Tillers m-2
700
400
300
100
100
50
70
90
Plants m-1
800
Tillers m-2
400
300
100
70
90
Plants m-1
0
y = -3.9303x + 813.25
R2 = 0.71**
50
70
(f)
y = -4.6237x + 887.587
R2 = 0.75**
600
y = -4.0658x + 553.54
R2 = 0.79**
Tillers m-2
500
400
300
500
400
300
200
200
100
100
50
70
Plants m-1
90
Plants m-1
700
600
30
30
800
(c)
700
0
(e)
300
100
50
90
400
200
800
70
Plants m-1
500
200
30
50
600
y = -3.848x + 427.67
R2 = 0.93**
500
0
30
700
600
Tillers m-2
0
800
(b)
700
Tillers m-2
300
200
30
y = -3.5889x + 629.5
R2 = 0.66**
400
200
0
(d)
700
90
0
30
50
70
Plants m-1
Source: Elaboration of the authors.
Source: Elaboration of the authors.
594
Semina: Ciências Agrárias, Londrina, v. 35, n. 2, p. 589-604, mar./abr. 2014
90
Tillering affected by sowing density and growth regulators in wheat
Table 2. Variance analysis (F values) of dry matter accumulation in the main stem (MSDW), leaves (LDW),
total (TDW) and dry matter ratio between stem and leaves (S/L) at the end of tillering and dry
Table 2. Variance analysis (F values) of dry matter accumulation in the main stem (MSDW), leaves (LDW), total
matter accumulation in the main stem (MSDW), leaves (LDW), spikes (SDW) and total per plant
(TDW) and dry matter ratio between stem and leaves (S/L) at the end of tillering and dry matter accumulation in
(TDW) at anthesis stage affected by plant densities and growth regulators in wheat (IAC 370).
the main stem (MSDW), leaves (LDW), spikes (SDW) and total per plant (TDW) at anthesis stage affected by plant
(SP),
Brazil,in2010.
densitiesBotucatu
and growth
regulators
wheat (IAC 370). Botucatu (SP), Brazil, 2010.
End of tillering
Anthesis
MSDW
LDW
TDW
S/L
MSDW
LDW
TDW
End of tillering
Anthesis SDW
Bloc
4,73*
7,68**
6,379**
0,47
0,39
3,08
0,23
0,62
MSDW
LDW
TDW
S/L
MSDW
LDW
SDW
TDW
Densities
(D)
65,86**
86,38**
79,29**
6,24*
96,78**
155,30**
25,69**
88,12**
Bloc
4,73*
7,68** 6,379**
0,47
0,39
3,08
0,23
0,62
Growth
regulator
0,53 86,38**
0,69 79,29**
0,64 6,24*
0,1396,78**
1,04 155,30**
0,87 25,69**
0,42 88,12**
0,76
Densities
(D) (G) 65,86**
D
x
G
0,61
0,69
3,61
1,07
0,06
1,18
1,26
Growth regulator
(G)
0,53
0,69
0,64
0,13
1,04
0,87
0,42
0,761,33
1
CVD(%)
25,11
18,84
21,07
10,88
19,13
16,13
35,43
20,16
x G2
0,61
0,69
3,61
1,07
0,06
1,18
1,26
1,33
CV
(%)
22,19
19,24
19,98
10,08
18,71
19,54
23,90
18,32
1
CV (%)
25,11
18,84
21,07
10,88
19,13
16,13
35,43
20,16
1
2
*, **Significant
coefficient of19,54
variation; 23,90
subplot coefficient
of
2 the F test (p < 0.05 and <0.01 respectively);
CV (%)by
22,19
19,24
19,98
10,08 plot18,71
18,32
variation;
*, **Significant
by the
testauthors.
(p < 0.05 and <0.01 respectively); 1 plot coefficient of variation; 2 subplot coefficient of variation;
Source:
Elaboration
ofFthe
Source: Elaboration of the authors.
Figure 3. Dry matter accumulation in the main stem (a), leaves (b), total (c) and dry matter ratio
Figure
3. Dry
the main
stem
(a), leaves
(b), total
and densities
dry matterin
ratio
between
stem
and
between
stemmatter
and accumulation
leaves (d) atinthe
end of
tillering
affected
by (c)
plant
wheat
(IAC
370).
leaves
(d)
at
the
end
of
tillering
affected
by
plant
densities
in
wheat
(IAC
370).
Botucatu
(SP),
Brazil,
2010.
**p
<
0.01
Botucatu (SP), Brazil, 2010. **p < 0.01
(a)
0,5
0,3
0,2
0,1
0,0
y = 0.0002x2 - 0.0401x + 2.1821
R2 = 0.99**
1,0
0,8
0,6
0,4
0,2
30
50
70
90
Plants m-1
(b)
0,5
0,4
0,3
0,2
0,1
30
50
70
Plants m-1
0,0
30
(d)
0,95
90
50
70
90
Plants m-1
1,00
y = 0.0001x2 - 0.0207x + 1.157
R2 = 0.99**
Main stem/Leaves ratio (g g-1)
0,6
0,0
(c)
1,2
0,4
0,7
Dry matter of leaves (g plant -1)
1,4
y = 0.0001x2 - 0.0195x + 1.0258
R 2 = 0.99**
Total dry matter (g plant -1)
Dry matter of the main stem (g plant -1)
0,6
y = -0.002x + 0.894
R 2 = 0.93**
0,90
0,85
0,80
0,75
0,70
0,65
0,60
0,55
0,50
30
50
70
90
Plants m-1
Source: Elaboration of the authors.
Source: Elaboration of the authors.
595
Semina: Ciências Agrárias, Londrina, v. 35, n. 2, p. 589-604, mar./abr. 2014
Fioreze, S. L.; Rodrigues, J. D.
Figure
4. Dry
matter
accumulation
in the in
main
leaves
spikes
(c)spikes
and total
plant
(d)per
at anthesis
stage
Figure
4. Dry
matter
accumulation
thestem
main(a),
stem
(a),(b),
leaves
(b),
(c)per
and
total
plant (d)
at
affected
by
plant
densities
in
wheat
(IAC
370).
Botucatu
(SP),
Brazil,
2010.
**p
<
0.01.
anthesis stage affected by plant densities in wheat (IAC 370). Botucatu (SP), Brazil, 2010. **p < 0.01.
0,9
y = 0.0002x2 - 0.0308x + 1.5283
R2 = 0.99**
0,7
0,6
0,5
0,4
0,3
0,2
Dry matter of spikes (g plant -1)
0,8
Dry matter of leaves (g plant -1)
0,7
(a)
30
70
90
0,5
0,4
0,3
0,2
30
1,4
1,2
1,0
0,8
0,6
0,4
50
70
90
Plants m-1
(d)
3,0
Total dry matter (g plant -1)
y = 0.0004x2 - 0.0656x + 3.4823
R2 = 0.99**
1,6
0,0
3,5
(b)
1,8
Dry matter of the main stem (g plant -1)
50
Plants m-1
2,0
y = 0.0007x2 - 0.119x + 6.2342
R2 = 0.99**
2,5
2,0
1,5
1,0
0,5
0,2
0,0
y = 0.0001x2 - 0.0227x + 1.2236
R2 = 0.99**
0,1
0,1
0,0
(c)
0,6
30
50
70
Plants m-1
90
0,0
30
50
70
90
Plants m-1
Source: Elaboration of the authors.
Source: Elaboration of the authors.
senescence,
which
is even plant
more densities,
accentuated
Under
environmental
conditions
of good
lightlightleaf
Under
environmental
conditions
of good
quality,
observed
in reduced
dry
quality, observed in reduced plant densities, dry under water deficit conditions and high-demanding
matter accumulation in tillers may be related to improved development of leaves, mainly due to a higher
matter accumulation in tillers may be related to sink (ELHANI et al., 2007). Hence, reserves from
number
of cells
(ALMEIDA;
MUNDSTOCK,
2001);
is in turn
related to to
themaintain
emissionappropriate
of new leaves
and
are essential
yield
improved
development
of leaves,
mainly due
to a thisstems
tillers
(SKINNER;
NELSON,
1994).MUNDSTOCK,
As plant density was
higher,
leaf development
was reduced in relation
levels
(BLUM,
1998).
higher
number of cells
(ALMEIDA;
this is
in turn
related
the emission
of newthe same
to 2001);
the main
stem
(Figure
3d)to once
plants within
closer
to each other.
Totalrow
drywere
matter
accumulation
per Assimilate
area was
leaves and tillers (SKINNER; NELSON, 1994). not influenced by plant densities, demonstrating
accumulation in pre-anthesis stage plays an important role in grain filling and, consequently, wheat yield.
As plant density was higher, leaf development was the flexibility of wheat plants to develop under
From
this stage
on, production
of photoassimilates
due to leaf senescence, which is even more
reduced
in relation
to the main
stem (Figure 3d)is reduced
low-density conditions, mainly at anthesis stage.
accentuated
under
water
high-demanding
sink (ELHANI et al., 2007). Hence, reserves
once plants
within
thedeficit
sameconditions
row wereand
closer
to Tiller emission,
as well as dry matter accumulated
each
other.
Assimilate
accumulation
in
pre-anthesis
from stems are essential to maintain appropriate yield levels
(BLUM,by
1998).
individually
each plant, worked as a compensation
stage plays an important role in grain filling and, mechanism for the reduced number of plants per
Total dry matter accumulation per area was not influenced by plant densities, demonstrating the
consequently, wheat yield. From this stage on, area. Valério et al. (2009) reported that wheat
flexibility
of wheat
plants to develop
low-density
production
of photoassimilates
is under
reduced
due to conditions, mainly at anthesis stage. Tiller emission,
as well as dry matter accumulated individually by each plant, worked as a compensation mechanism for the
596
Semina: Ciências Agrárias, Londrina, v. 35, n. 2, p. 589-604, mar./abr. 2014
Tillering affected by sowing density and growth regulators in wheat
capacity to make up for a lower number of plants
through tiller emission and assimilate accumulation
is variable and depends on genotype.
In wheat, grain yield consists of several
individual components such as the number of spikes
per plant, spikelets per spike, grains per spike,
grains per spikelet and grain mass, but directly
depends on genotype and environmental conditions
(CRUZ et al., 2003). Grain yield of cereals cropped
under constant populations may be obtained mainly
through three components, i.e. number of spikes per
area, number of grains per spike and grain mass;
these in turn may vary independently until a given
limit (NEDEL, 1994).
Increasing plant density within the row reduced
yield components (Table 3) individually (Figure
5) as a consequence of intense competition among
plants and thus low dry matter accumulation per
plant, mainly at anthesis stage. The number of grains
m-2 is closely related to plant capacity in biomass
accumulation and transference to reproductive
structures at pre-anthesis (RODRIGUES et al.,
2002). Path analysis in wheat shows that shoot
biomass accumulation is one of the main components
to influence final yield (OKUYAMA; FERERIZZI;
BARBOSA NETO, 2004), along with the number
of spikes per area and grains per spike.
Table 3. Variance analysis (F values) of rachis length (RL), number of fertile spikelets (FE), number of grains per
spike (NGS) mass of grains per spike (MGS), number of spikes per m2 (NSM), increase in the number of spikes (INS),
grain yield (GY) and mass of 1,000 grains (TGW) affected by plant densities and growth regulators in wheat (IAC
370). Botucatu (SP), Brazil, 2010.
RL
Bloc
1,80
Densities (D)
171,83**
Growth regulator (G)
0,62
DxG
1,02
CV (%) 1
12,86
CV (%) 2
18,02
FE
0,99
101,16**
0,52
0,87
16,32
20,12
NGS
1,29
103,47**
0,50
1,06
18,35
21,26
MGS
1,33
114,81**
0,49
1,04
17,49
22,48
NSM
0,78
73,42**
0,19
0,61
10,67
11,80
INS
GY
0,65
0,14
70,88**
8,54**
0,24
0,57
0,57
1,78
66,41
35,07
59,89
13,70
TGW
7,16
7,73**
5,62**
0,60
2,46
4,81
*, **Significant by the F test (p < 0.05 and <0.01 respectively); 1 plot coefficient of variation; 2 subplot coefficient of variation.
Source: Elaboration of the authors.
Maintaining final grain yield under different
plant densities is possible by compensating other
yield components, once wheat is highly capable
of modifying or adjusting some of them whenever
another is deficient or excessive (FREEZE;
BACON, 1990). Although higher tiller emission
was attributed to lower plant densities (Figures 1 and
2), it was not sufficient to make up for the number of
spikes m-2, upon comparing to the denser cropping
(Figure 6a). Nevertheless, increased number of
spikes m-2 in lower populations is indicative of this
cultivar to potentially compensate an unoccupied
area with tiller emission and maintenance, once it
is a characteristic highly dependent on genotype
(VALÉRIO et al., 2009).
Even with reduced number of spikes per area
(Figure 6a), higher yields were obtained with lower
plant densities; on the contrary, yield was reduced as
the number of plants within the row was increased
(Figure 6c). These results show that plant density
effects on dry matter accumulation (Figures 3 and
4) and, consequently, on the number and mass of
grains per spike (Figure 5) were determinant to
expressing yield potential in the conditions of this
experiment.
597
Semina: Ciências Agrárias, Londrina, v. 35, n. 2, p. 589-604, mar./abr. 2014
L.; Rodrigues,
J. D.
Figure 5. Rachis length (a), number ofFioreze,
fertile S.
spikelets
(b), number
of grains per spike (c) and mass of
grains per spike (d) affected by plant densities in wheat (IAC 370). Botucatu (SP), Brazil, 2010. **p <
0.01. 5. Rachis length (a), number of fertile spikelets (b), number of grains per spike (c) and mass of grains per spike
Figure
(d) affected by plant densities in wheat (IAC 370). Botucatu (SP), Brazil, 2010. **p < 0.01.
20,0
(a)
16,0
12,0
10,0
8,0
6,0
4,0
2,0
30
70
(b)
30
60
50
40
30
20
10
0
90
30
25
20
15
10
50
70
90
Plants m-1
3,5
y = 0.0068x2 - 1.0873x + 55.872
R2 = 0.98**
(d)
3,0
Mass of grains per spike (g)
Number of fertile spikelets per spike
50
Plants m-1
35
y = 0.0006x2 - 0.0963x + 5.2577
R2 = 0.98**
2,5
2,0
1,5
1,0
0,5
5
0
y = 0.0154x2 - 2.6264x + 140.20
R2 = 0.99**
70
14,0
0,0
(c)
80
Number of grains per spike
Rachis length (cm)
18,0
90
y = 0.0041x2 - 0.6456x + 32.747
R2 = 0.98**
30
50
70
Plants m-1
90
0,0
30
50
70
90
Plants m-1
Source: Elaboration of the authors.
Source: Elaboration of the authors.
the end
theofcycle
4 andg) Figure
7ab)
Trinexapacapplicationreduced
reduced
Trinexapac-Ethyl
Ethyl application
significantly
the of
mass
1,000 (Table
grains (41.1
compared
to
significantly the mass of 1,000 grains (41.1 g) varied as showed for the end of tillering (Figure
the control (43.4 g). Although grain mass is an important component, final yield was not reduced. Growth
compared to the control (43.4 g). Although grain 1f). The number of tillers was lower in denser
regulators
didimportant
not differcomponent,
significantlyfinal
from
eachwas
other,populations.
even considering
the combination
between
Nevertheless,
higher abortion
ratethem.
was
mass is an
yield
the have
cyclebeen
for all
densities (Figure
not reduced.
regulators
did notof differ
Results
of grainGrowth
mass after
the application
growth observed
regulatorsduring
in wheat
controversial.
Some
Competition
effects are determinant
for others
tiller
significantly
from each
other,
even considering
the or7c).
studies
have shown
positive
(ZAGONEL
et al., 2002)
negative
effects (ESPINDULA
et al., 2009);
combination between them. Results of grain mass development (OZTURK; CAGLAR; BULUT,
have also shown variable responses depending on the genotype (ZAGONEL; FERNANDES, 2007).
after the application of growth regulators in wheat 2006). Growth rate of leaves from both main stem and
-2
The
number of tillers
at anthesis
by thetillers
end ofare
thesimilar
cycle (Table
4 andconditions
Figure 7ab)(MASLE,
varied as
under ideal
have been
controversial.
Somemstudies
have and
shown
1985);of
even
so, competition
among
plants
for light
showed
the end of
tillering
(Figure
1f).effects
The number
tillers
was lower in
denser
populations.
positivefor
(ZAGONEL
et al.,
2002) or
negative
in
initial
growth
stages
limits
tiller
emission
under
(ESPINDULA
et
al.,
2009);
others
have
also
shown
Nevertheless, higher abortion rate was observed during the cycle for all densities (Figure 7c). Competition
variable responses depending on the genotype high plant densities. In these conditions, apical
effects are determinant for tiller development (OZTURK; CAGLAR; BULUT, 2006). Growth rate of leaves
dominance is intensified by a faster development
(ZAGONEL; FERNANDES, 2007).
from both main stem and tillers are similar under idealofconditions
(MASLE,
even
so, competition
the main stem,
which1985);
prevents
lateral
buds from
The number of tillers m-2 at anthesis and by
develop (VEITT, 2006).
598
Semina: Ciências Agrárias, Londrina, v. 35, n. 2, p. 589-604, mar./abr. 2014
buds from develop (VEITT, 2006).
Tillering affected by sowing density and growth regulators in wheat
Figure 6. Number of spikes per m2 (a), increase in the number of spikes (b), grain yield (c) and mass of
2
Figure
Number
spikes per
(a),densities
increase in
number
spikesBotucatu
(b), grain(SP),
yield Brazil,
(c) and mass
1,000
grains
1,0006.grains
(d)ofaffected
by m
plant
inthe
wheat
(IACof370).
2010.of**p
< 0.01.
(d) affected by plant densities in wheat (IAC 370). Botucatu (SP), Brazil, 2010. **p < 0.01.
600
(a)
y=
R2
- 4.5x + 407.02
= 0.99**
500
450
400
350
5000
4000
3000
1000
250
30
50
70
0
90
Plants m-1
50
(b)
45
30
45
y = 0.0202x 2 - 3.1484x + 120.95
R2 = 0.99**
40
35
Mass of 1,000 grains (g)
Increase in the number of spikes (%)
y = 1.0687x2 - 166.47x + 9967.9
R2 = 0.98**
2000
300
200
(c)
6000
Yield (kg ha-1 )
Number of spikes per m-2
550
7000
0.0659x 2
30
25
20
15
10
50
70
90
Plants m-1
(d)
43
40
38
y = -0.0007x2 + 0.0392x + 40.491
R2 = 0.32*
5
0
30
50
70
90
35
30
50
Plants m-1
70
90
Plants m-1
Source: Elaboration of the authors.
Source: Elaboration of the authors.
Table 4. Variance analysis (F values) number of tillers per m2 before anthesis (TNBA) and harvest (TNH), percentage
2
Table
4. tillers
Variance
analysis
(F values)
number
tillers per m
anthesis of(TNBA)
(TNH),
of fertile
(FT%),
Contribution
to dry
matterof
accumulation
andbefore
yield potential
tillers atand
the harvest
end of tillering
percentage
of
fertile
tillers
(FT%),
Contribution
to
dry
matter
accumulation
and
yield
potential
(1), at anthesis (2) and at harvest (3) affected by plant densities and growth regulators in wheat (IAC 370). Botucatuof
tillers
at the end of tillering (1), at anthesis (2) and at harvest (3) affected by plant densities and
(SP), Brazil,
2010.
growth regulators in wheat (IAC 370). Botucatu (SP), Brazil, 2010.
1
1
2
2
3
3
TNBA TNH
TNH
FT%
MSP
1
2
3
TNBA
FT%
MSP
PP1PP
MSPMSP
PP2 PP MSPMSP
PP3 PP
Bloc
0,55
0,78
0,31
13,72** 2,43**
2,43 0,89**
0,89 0,26**
0,26 1,06**
1,06 0,59**
0,59
Bloc
0,55**
0,78**
0,31**
13,72**
Densities
(D)
40,86**
42,64**
23,11**
277,02**
7,30**
112,14**
15,35**
174,91**
18,54**
Densities (D)
40,86** 42,64** 23,11** 277,02** 7,30** 112,14** 15,35** 174,91** 18,54**
Growth
regulator
(G)
0,30
0,19
0,12
2,84
2,41 0,03**
0,03 0,61**
0,61 0,72**
0,72 0,41**
0,41
Growth regulator (G)
0,30**
0,19**
0,12**
2,84**
2,41**
D
x
G
0,90
0,61
0,78
0,86
0,47
0,68
1,04
37,95
0,56
DxG 1
0,90**
0,61**
0,78**
0,86** 0,47**
0,68**
1,04** 37,95**
0,56**
CV
(%)
72,66
80,06
102,69
12,2
29,98
54,68
101,98 43,83
109,84
CV (%) 12
72,66** 80,06** 102,69**
12,2** 29,98** 54,68** 101,98** 43,83** 109,84**
CV (%) 2
83,16
88,56
90,02
18,79
44,7
59,08
80,65
69,78
59,45
CV (%)
83,16**
88,56**
90,02**
18,79**
44,7**
59,08**
80,65**
69,78**
59,45**
*, **Significant by the F test (p < 0.05 and <0.01 respectively); 1 plot coefficient of variation; 2 subplot coefficient of
*, **Significant by the F test (p < 0.05 and <0.01 respectively); 1 plot coefficient of variation; 2 subplot coefficient of variation.
variation.
Source: Elaboration
Source:
Elaborationofofthe
theauthors.
authors.
599
Semina: Ciências Agrárias, Londrina, v. 35, n. 2, p. 589-604, mar./abr. 2014
Fioreze, S. L.; Rodrigues, J. D.
2
2
Figure7. 7.
Number
of tillers
m before
(a) and(b),harvest
(b), of
percentage
of (c)
fertile
tillers
(c)
Figure
Number
of tillers
per mper
before
anthesisanthesis
(a) and harvest
percentage
fertile tillers
affected
by plant
densities
370). Botucatu
2010. **p (SP),
< 0.01.Brazil, 2010. **p < 0.01
affectedinbywheat
plant(IAC
densities
in wheat (SP),
(IACBrazil,
370). Botucatu
200
25
(a)
y=
160
- 11.5x + 471.52
R2 = 0.93**
140
Tillers per m-2
y = 0.0074x2 - 1.2023x + 48.666
R2 = 0.99**
(c)
0.0713x2
120
100
80
Tiller survival (%)
180
20
15
10
60
40
5
20
0
30
50
70
90
Plants m-1
200
(b)
180
0
30
50
70
90
Plants m-1
y = 0.0659x2 - 10.38x + 407.02
R2 = 0.99**
160
Tillers per m-2
140
120
100
80
60
40
20
0
30
50
70
90
Plants m-1
Source: Elaboration of the authors.
Source: Elaboration of the authors.
According
to Figure
7c, low
tillertiller
survival
was wasroots
start
(SKINER;
NELSON, 1994).
According
to Figure
7c, low
survival
found
in developing
the conditions
of this experiment.
Alves,
found in the conditions of this experiment. Alves, Nevertheless, it is not entirely clear if assimilates
Mundstock and Medeiros (2000) stated that small-grain cereals produced in Brazil such as wheat, oat, barley
Mundstock and Medeiros (2000) stated that small- and minerals accumulated in certain tillers can be
and
rye cereals
developproduced
a large number
of unfertile
tillers. Low tiller survival may be affected by physiological
grain
in Brazil
such as wheat,
redistributed to other parts of the plants in case they
conditions
of and
the main
stem by the
time number
tillers emerge.
Competition
effects In
forthis
photoassimilates
in tillers
wheat
oat, barley
rye develop
a large
of become
non-viable.
case, unfertile
unfertile
tillers. Low
tiller survival
be affected
become reserve
organs(VALÉRIO
for plants during
their
may
be reflected
on reduced
numbermay
of tillers
per plantmay
or deficient
grain filling
et al, 2008).
by physiological conditions of the main stem by development, preventing losses from abortion.
Tillers are physiologically dependent on the main stem for assimilates, until they show their own completely
the time tillers emerge. Competition effects for
Contribution of tiller yield in final production
expanded
leaf, andinforwheat
mineral
nutrients,
until their
photoassimilates
may
be reflected
on roots start developing (SKINER; NELSON, 1994).
of wheat plants is extremely variable according to
Nevertheless,
it is of
nottillers
entirely
reduced number
per clear
plantiforassimilates
deficient and minerals accumulated in certain tillers can be
genotype and environmental conditions (ELHANI
grain fillingto(VALÉRIO
et the
al, 2008).
are become non-viable. In this case, unfertile tillers may
redistributed
other parts of
plants inTillers
case they
et al., 2007). The same authors stated that
physiologically dependent on the main stem for
become reserve organs for plants during their development,
preventingof
losses
from abortion.
development
the main
stem is prioritized under
assimilates, until they show their own completely
stress
conditions,
also found
in this according
experiment
Contribution
tiller yield
in final
production
of wheat
plants isasextremely
variable
to
expanded
leaf, and forofmineral
nutrients,
until
their
600
Semina: Ciências Agrárias, Londrina, v. 35, n. 2, p. 589-604, mar./abr. 2014
Tillering affected by sowing density and growth regulators in wheat
(Figure 8). Competition among plants for resources
can be observed by comparing both sowing density
and evaluation times.
denser population (90 plants m-1). This behavior
was not observed at anthesis stage and in the end
of the cycle; in this case, tiller contribution was
null. Even under environments where competition
Higher number of plants in the row reduced
among plants for resources is less intense (e g.
contribution to assimilate accumulation as well as
lower densities), tiller contribution to dry matter
genotype of
andtillers,
environmental
(ELHANI
yield potential
in allconditions
evaluation
times.et al., 2007). The same authors stated that development of
accumulation was reduced until anthesis; average
the there
main stem
under stress conditions,
However,
wasis prioritized
a little contribution
to dry as also found in this experiment (Figure 8). Competition
yield
of tillers
compared
to the main stem
among plants forin
resources
canof
be observed
comparing
bothpotential
sowing density
and evaluation
times.
matter accumulation
the end
tilleringbystage
reached maximum (70%) by the end of the cycle.
and tillers showed high yield potential, even in the
Figure 8. Contribution to dry matter accumulation and yield potential of tillers at the end of tillering
(a, b), at anthesis (c, d) and at harvest (e, f) affected by plant densities in wheat (IAC 370).
Figure 8. Contribution
dry matter
Botucatu(SP),toBrazil,
2010.accumulation
**p < 0.01. and yield potential of tillers at the end of tillering (a, b), at anthesis
(c, d) and at harvest (e, f) affected by plant densities in wheat (IAC 370). Botucatu(SP), Brazil, 2010. **p < 0.01.
80
(a)
y = 0.0063x2 - 1.5049x + 102.62
R2 = 1.0**
50
40
30
20
30
50
(c)
Tiller contribution to dry matter (%)
60
50
40
30
20
30
80
y = 0.018x2 - 2.8006x + 106.92
R2 = 0.98**
40
30
20
10
50
70
90
Plants m-1
(d)
y = -1.0989x + 94.91
R2 = 0.96**
70
60
50
40
30
20
10
30
50
70
0
90
Plants m-1
30
y = 0.0169x2 - 2.6482x + 101.65
R 2 = 0.99**
50
40
30
20
10
50
70
90
Plants m-1
80
(e)
60
0
y = -0.2419x + 46.096
R2 = 0.95**
60
0
90
50
70
Tiller contribution to dry matter (%)
70
Plants m-1
70
0
(b)
70
10
Yield potential of tillers (% of DW)
10
Yield potential of tillers (% of DW)
Tiller contribution to dry matter (%)
60
Yield potential of tillers (% of DW)
70
(f)
70
y = -1.315x + 108.87
R2 = 0.92**
60
50
40
30
20
10
30
50
70
Plants m-1
90
0
30
50
70
90
Plants m-1
Source: Elaboration of the authors.
Source: Elaboration of the authors.
601
Semina: Ciências Agrárias, Londrina, v. 35, n. 2, p. 589-604, mar./abr. 2014
Fioreze, S. L.; Rodrigues, J. D.
Conclusions
The application of IBA+GA+KT and TrinexapacEthyl, either isolated or combined, does not affect
tillering or any other yield parameters related to the
main stem of wheat plants;
Reducing in plant densities increase tiller
emission, survival and contribution to dry matter
accumulation and grain yield in wheat.
Higher grain yield is obtained due to individual
yield increases per spike in lower plant densities.
Acknowledgements
and Tiller Contribution to Wheat Cultivars Yield Under
Different Irrigation Regimes. Brazilian Archives of
Biology and Technology, Curitiba, v. 44, n. 4, p. 325-330,
2001.
ELHANI, S.; MARTOS, V.; RHARRABTI, Y.; ROYO,
C.; MORAL, L. F. G. Contribution of main stem and
tillers to durum wheat (Triticum turgidum L. var. durum)
grain yield and its components grown in Mediterranean
environments. Field Crops Research, Amsterdam, v. 103,
n. 1, p. 25-35, 2007.
EMPRESA
BRASILEIRA
DE
PESQUISA
AGROPECUÁRIA – EMBRAPA. Centro Nacional
de Pesquisa de Trigo. Informações técnicas para trigo
e triticale safra 2011. In: REUNIÃO DA COMISSÃO
BRASILEIRA DE PESQUISA DE TRIGO E
TRITICALE, 4., Cascavel: COODETEC, 2010. 170 p.
The first author acknowledges a master’s degree
scholarships granted by FAPESP, Brazil.
ESPINDULA, M. C.; ROCHA, V. S.; GROSSI, J. A. S.;
SOUZA, M. A.; SOUZA, L. T.; FAVARATO, L. F. Use
of growth retardants in wheat. Planta Daninha, Viçosa,
v. 27, n. 2, p. 379-387, 2009.
References
FOOD AND AGRICULTURE ORGANIZATION OF
THE UNITED NATIONS – FAO. World reference base
for soil resources. Rome: FAO, 2006. 128 p.
ALMEIDA, M. L.; MUNDSTOCK, C. M. A qualidade
da luz afeta o afilhamento em plantas de trigo, quando
cultivadas sob competição. Ciência Rural, Santa Maria,
v. 31, n. 3, p. 401-408, 2001.
ALVES, A. C.; MUNDSTOCK, C. M.; MEDEIROS, J.
D. Sistema vascular e controle do desenvolvimento de
perfilhos em cereais de estação fria. Revista Brasileira de
Botânica, São Paulo, v. 23, n. 1, p. 59-67, 2000.
BALLARÉ, C. L.; SCOPEL, A. L.; SÁNCHEZ, R. A.;
RADOSEVICH, S. R. Photomorphogenic processes
in the agricultural environment. Photochemistry and
Photobiology, Hoboken, v. 56, n. 5, p. 777-788, 1992.
BLUM, A. Improving wheat grain filling under stress by
stem reserve mobilization. Euphytica, Wageningen, v.
100, n. 1, p. 77-83, 1998.
BRASIL. Ministério da Agricultura, Pecuária e
Abastecimento. Regras para análise de sementes.
Ministério da Agricultura, Pecuária e Abastecimento.
Secretaria de Defesa Agropecuária. Brasília, DF: Mapa/
ACS, 2009. 395 p.
CRUZ, P. J.; CARVALHO, F. I. F.; SILVA, S. A.; KUREK,
A. J.; BARBIERI, R. L.; CARGNIN, A. Influência
do acamamento sobre o rendimento de grãos e outros
caracteres em trigo. Revista Brasileira de Agrociências,
Pelotas, v. 9, n. 1, p. 05-08, 2003.
DESTRO, D.; MIGLIORANZA, E.; ARIAS, C. A. A.;
VENDRAME, J. M.; ALMEIDA, J. C. V. Main Stem
FREEZE, D. M.; BACON, R. K. Row-spacing and
seeding rate effects on wheat yields in the Mid-South.
Journal of Production Agriculture, Madison, v. 3, n. 3, p.
345-348, 1990.
HARTWIG, I.; CARVALHO, F. I. F.; OLIVEIRA,
A. C.; VIEIRA, E. A.; SILVA, J. A. G.; BERTAN, I.;
RIBEIRO, G.; FINATTO, T.; REIS, C. E. S.; BUSATO,
C. C. Estimativa de coeficientes de correlação e trilha
em gerações segregantes de trigo hexaplóide. Bragantia,
Campinas, v. 66, n. 2, p. 203-2018, 2007.
LARGE, E. C. Growth stages in cereals illustration of
the feeks scale. Plant Pathology, New York, v. 3, n. 4, p.
128-129, 1954.
LLOVERAS, J.; MANENT, J.; VIUDAS, J.; LÓPEZ,
A.; SANTIVERI, P. Tillering rate influence on yield
and yield components of irrigated winter wheat in a
Mediterranean climate. Agronomy Journal, Madison, v.
96, n. 5, p. 1258-1265, 2004.
MASLE, J. Competition among tillers in winter wheat:
consequences for growth and development of the crop.
In: DAY, W.; ATKIN, R. K. (Ed.). Wheat growth and
modeling. New York: Plenum, 1985. p. 33-54.
NEDEL, J. L. Progresso genético no rendimento de grãos
de cultivares de trigo lançadas para cultivo entre 1940 e
1992. Pesquisa Agropecuária Brasileira, Brasília, v. 29,
n. 10, p. 1565-1570, 1994.
602
Semina: Ciências Agrárias, Londrina, v. 35, n. 2, p. 589-604, mar./abr. 2014
Tillering affected by sowing density and growth regulators in wheat
OKUYAMA, L. A.; FERERIZZI, L. C.; BARBOSA
NETO, J. F. Correlation and path analysis of yield and
its components and plant traits in wheat. Ciência Rural,
Santa Maria, v. 34, n. 6, p. 1701-1708, 2004.
OZTURK, A.; CAGLAR, O.; BULUT, S. Growth and
yield response of facultative wheat to winter sowing,
freezing sowing and spring sowing at different seeding
rates. Journal of Agronomy Crop Science, Erzurum, v.
192, n. 1, p. 10-16, 2006.
RODRIGUES, O.; DIDONET, A. D.; LHAMBY, J. C. B.;
TEIXEIRA, M. C. C.; DEL DUCA; L. J. Características
fisiológicas associadas ao avanço no potencial de
rendimento de grãos de trigo. Passo Fundo: Embrapa
Trigo, 2002. 26 p.
SKINNER, R. H.; NELSON, C. J. Role of leaf appearance
rate and the coleoptile tiller in regulating tiller production.
Crop Science, Madison, v. 34, n. 1, p. 71-75, 1994.
VALÉRIO, I. P.; CARVALHO, F. I. F.; OLIVEIRA,
A. C.; BENIN, G.; SOUZA, V. Q.; MACHADO, A.
A.; BERTAN, I.; BUSATO, C. C.; SILVEIRA, G.;
FONSECA, D. A. R. Seeding density in wheat genotypes
as a function of tillering potential. Scientia Agricola,
Piracicaba, v. 66, n. 1, p. 28-39, 2009.
VALÉRIO, I. P.; CARVALHO, F. I. F.; OLIVEIRA, A.
C.; MACHADO, A. A.; BENIN, G.; SCHEEREN, P.
L.; SOUZA, V. Q.; HARTWIG, I. Desenvolvimento de
afilhos e componentes do rendimento em genótipos de
trigo sob diferentes densidades de semeadura. Pesquisa
Agropecuária Brasileira, Brasília, v. 43, n. 3, p. 319-326,
2008.
VEIT, B. Stem cell signalling networks in plants. Plant
Molecular Biology, Zurich, v. 60, n. 6, p. 793-810, 2006.
ZAGONEL, J.; FERNANDES, E. C. Doses e épocas
de aplicação do regulador de crescimento afetando
cultivares de trigo em duas doses de nitrogênio. Planta
Daninha, Viçosa, MG, v. 25, n. 2, p. 331-339, 2007.
ZAGONEL, J.; VENÂNCIO, W. S.; KUNZ, R. P.;
TANAMATI, H. Doses de nitrogênio e densidades de
plantas com e sem regulador de crescimento afetando o
trigo, Cultivar OR-1. Ciência Rural, Santa Maria, v. 32,
n. 1, p. 25-29, 2002.
603
Semina: Ciências Agrárias, Londrina, v. 35, n. 2, p. 589-604, mar./abr. 2014
Download