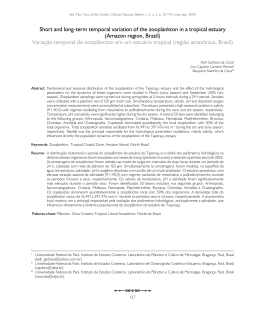
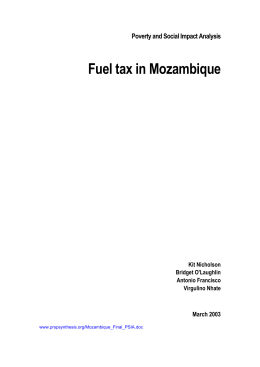
J. Braz. Chem. Soc., Vol. 20, No. 9, 1565-1573, 2009.
Printed in Brazil - ©2009 Sociedade Brasileira de Química
0103 - 5053 $6.00+0.00
Mauro C. S. Machado,a Josiane Loyola,b Simone L. Quiterio,b,c Gisele O. da Rocha,d,e,f
Jailson B. de Andraded,e and Graciela Arbilla*,b
a
Analytical Solutions, Rio de Janeiro-RJ, Brazil
b
Instituto de Química, Universidade Federal do Rio de Janeiro, 21949-900 Rio de Janeiro-RJ, Brazil
c
Centro Federal de Educação Tecnológica de Química de Nilópolis, Unidade Maracanã, Rua Senador Furtado, 121,
Maracanã, 20270-020 Rio de Janeiro-RJ, Brazil
d
Instituto de Química, Universidade Federal da Bahia, Campus de Ondina, 40170-290 Salvador-BA, Brazil
e
Centro Interdisciplinar de Energia e Ambiente, Universidade Federal da Bahia, 40110-040 Salvador-BA, Brazil
f
Instituto Nacional de Ciência e Tecnologia de Energia e Ambiente, Universidade Federal da Bahia,
40170-290 Salvador-BA, Brazil
Amostras de material particulado total e MP10 foram coletadas entre agosto de 2006 e fevereiro
de 2007 na estação rodoviária Prefeito José Carlos Lacerda. Foram analisados os 16 HPAs
considerados prioritários, emitidos pelos veículos pesados em condições típicas de operação, usando
CG/EM. Α ΣΗPA correspondeu a 0,0018% da massa de MPT e 0,0012% da massa de MP10. O
conteúdo total de HPAs foi de 3,57 ng m-3 e 2,59 ng m-3 para o MPT e o MP10, respectivamente.
A contribuição dos compostos carcinogênicos, conforme a USEPA, (B[a]An, B[b]F, B[k]F, B[a]
Py, IPy e DB[ah]A) foi 1,86 ng m-3 (52% do total de HPAs) e 1,40 ng m-3 (54% do total de HPAs),
para as amostras de MPT e MP10, respectivamente. As relações características e a análise estatística
multivariada deram, em geral, resultados similares aos obtidos para poeira de solos, exceto para a
relação Flt/(Flt+Py), 0,34, compatível com emissões de diesel. Os fluxos de deposição seca estão
no intervalo 0,022-0,603 e 0,016-0,436 µg m-2 dia-1 para os compostos contidos no MPT e MP10,
respectivamente.
Total particulate matter and PM10 samples were collected from August 2006 to February 2007
in Mayor José Carlos Lacerda bus station. 16 priority PAHs compounds emitted by heavy-duty
vehicles on typical conditions of operation were analyzed by using GC/MS. ΣPAH accounted for
0.0018% of the TSP mass and 0.0012% of the PM10 mass. Total PAH contents on the particle phase
were 3.57 ng m-3 and 2.59 ng m-3 for TSP and PM10, respectively. Contributions of carcinogenic
USEPA priority PAHs (B[a]An, B[b]F, B[k]F, B[a]Py, IPy and DB[ah]A) were 1.86 ng m-3 (52%
of total PAHs) and 1.40 ng m-3 (54% of total PAHs), for TSP and PM10 samples, respectively.
Diagnostic ratios and multivariate statistical analysis were, in general, similar to those reported for
soil dust except for the Flt/Flt+Py) ratio, 0.34, compatible with diesel emissions. Dry deposition
fluxes were in the range of 0.022-0.603 and 0.016-0.436 µg m-2 day-1 for compounds in TSP and
PM10, respectively.
Keywords: polycyclic aromatic hydrocarbons, TSP, PM10, diagnostic ratios, bus station, dry
deposition, diesel emissions
Introduction
The atmosphere is the major transport pathway for the
movement of PAHs through the global environment. Once
*e-mail: [email protected]
they are released into the atmosphere, PAHs can redistribute
between gas and particle phases according to their vapor
pressures and atmospheric conditions, and are subjected to
removal mechanisms such as oxidative and photocatalytic
reactions and wet and dry deposition.1,2 The majority of
PAHs (70-90%) is sorbed on suspended particles at ambient
!"#$%&'
Particle-Associated Polycyclic Aromatic Hydrocarbons and their Dry Deposition Fluxes
from a Bus-Station in the Rio de Janeiro Metropolitan Area, Brazil
1566
Particle-Associated Polycyclic Aromatic Hydrocarbons and their Dry Deposition Fluxes
temperature. Lighter PAHs with 2-3 benzene rings are
mostly found in the gas phase while the heavier ones are
mainly associated with airborne particles. The carcinogenic
larger PAHs (5-7 rings) are associated with particles in
the atmosphere. Some of the 3 and 4 rings PAHs are also
bound to particles. Also, most of the mutagens in ambient
air were proved to be particle-associated. Moreover, PAHs
are mostly sorbed on small inhalable particles mainly on
airborne particles of submicron diameter which can deposit
in the respiratory tract, hence increasing the potential
hazardous effects.3,4
PAHs are ubiquitous environmental contaminants.
Both the United States Environmental Protection Agency
(US EPA) and the European Environmental Agency
have mentioned them as priority pollutants. They are
originated from both natural and anthropogenic sources.
Sources related to energy production are the most
important in releasing PAHs. They can be classified as
either pyrogenic (mainly from incomplete combustion
of organic materials, such as coal, oil, vegetation or
fossil fuels) or petrogenic inputs.5-7 PAHs have received
attention in air pollution studies because some of these
compounds, for instance, benzo[a]pyrene, chrysene,
indeno[1,2,3-cd]pyrene, and benzo[b]fluoranthene, have
produced carcinogenic, genotoxic and/or mutagenic effects
in animals. Accordingly, breathing PAHs may represent a
health hazard for humans.8-10
The risk associated with human exposure to atmospheric
PAHs is higher in urban environments8 where high vehicle
density and the dispersion of atmospheric pollutants
contribute to the increase of their concentrations. Indeed, in
urban areas, exhaust from diesel and gasoline vehicles play
an important role on PAH emissions. Otherwise, emissions
of PAHs on highways are strongly influenced by heavyduty diesel vehicles.11 Occurrence of PAHs in ambient
air is a growing concern due to the continuous nature of
exposures and the size of populations at risk, especially
in urban, suburban and industrial areas. Therefore, in
light of the mutagenicity, carcinogenicity and ubiquity of
some PAHs in the atmosphere, the setting of air quality
standards and guidelines to limit human exposure should
be of primary concern for public health policy. However,
difficulties in interpreting heterogeneous experimental
data and epidemiological findings9 limit the empirical data
needed to establish standards or guidelines.
Several articles were published on the emissions of
PAHs from mobile sources.12-19 Rogge et al.,20 determined
the chemical composition of organic fine particulate matter
(PM2.5) emitted from six non-catalyst vehicles, seven
catalyst-equipped automobiles and two heavy duty diesel
trucks. More than 100 organic compounds, including
J. Braz. Chem. Soc.
PAHs, were determined in this work. In 1999, Marr et
al.21 determined the PAHs concentrations in gasoline and
diesel fuel samples collected in northern California and
also in particulate matter collected in a tunnel using both
filter (PM2.5) and impactor methods. Emission factors were
determined separately for light-duty vehicles and for heavyduty diesel trucks. The authors reported that light-duty
vehicles were found to be a significant source of heavier
(four- and five-ring) PAHs, whereas heavy-duty diesel
engines were the dominant source of three-ring PAHs,
such as fluoranthene and pyrene. The obtained results
showed no correlation between heavy-duty diesel truck
PAH emission factors and PAH concentrations in diesel
fuel. In a rather recent study conducted in the centre of
Athens (Greece),22 the concentration of PAHs and metals
adsorbed to total suspended particulate and finer fractions
of airborne particulate matter (PM 10 and PM2.5) were
determined. The authors reported that the most common
PAHs in PM10.2 and PM2.1 were pyrene, phenanthrene,
acenapthylene and fluoranthene, which are associated with
diesel and gasoline exhaust particles. In another study,
Turrio-Baldassarri et al.23 compared the emissions of diesel,
a blend of diesel and 20% vegetable oil and compressed
natural gas engines. The experimental design focused
carcinogenic compounds on particulate matter and vapor
phase. The results were compared with a previous work24 on
the emissions of diesel and biodiesel bus engines. Chrysene
followed by benzo[a]anthracene, benzo[b]fluoranthene and
benzo[k]fluoranthene were identified as the most abundant
compounds.
Most of the data obtained in Brazilian cities refer to
total suspended particles.6,25-43 Data for inhalable particles
and PM2.5 are rather sparse.40,42,44-47 Some studies were
fulfilled in locations highly affected by diesel emissions.
Pereira et al.38 determined 16 selected polycyclic aromatic
hydrocarbons in total particulate matter, in the Lapa
bus station (Salvador, Bahia). Pyrene, fluoranthene and
chrysene showed the highest average concentrations. In
January 2002, Tavares et al.48 determined the concentrations
of vapor phase polycyclic aromatic hydrocarbons at
the Londrina Central Bus Station, where only dieselpowered vehicles circulated. The species that presented
higher concentration were phenanthrene, fluorene and
naphthalene. In 2006, Correa and Arbilla49 reported the
analysis of the polycyclic aromatic compounds collected in
the vapor and aerosol exhaust of a diesel engine. The major
compounds were phenanthrene, fluorene and naphthalene.
Clearly, PAHs with lower liquid vapor pressures are mainly
found in the vapor phase38,50 while compounds with vapor
pressures lower than 1 × 10⁻³ Pa are mainly in the aerosol
phase.
Vol. 20, No. 9, 2009
Machado et al.
The objective of this paper is to determine the 16
priority particle-associated (TSP and PM10) PAHs emitted
by heavy-duty vehicles, fueled by diesel, on typical
conditions of operation. The samplings were performed in
a bus station located in the city of Duque de Caxias, in the
State of Rio de Janeiro. The studied bus station is poorly
ventilated and the intense and frequent movement and
parking of buses (which remain with their motors on during
passenger accesses) may cause releases of many kinds
of hazardous chemicals to the atmosphere. As described
bellow, emissions in that location are mainly due to diesel
engines. The results are accordingly discussed.
Experimental
Sampling site
The sampling site was the Prefeito José Carlos Lacerda
Bus Station, placed in the Centenário Quarter, in the city of
Duque de Caxias (22º46’50.44”S, 43º18’28.35”W), State of
Rio de Janeiro. The city occupies an area of 468.3 km2 and
has a population of about 842,890 inhabitants distributed in
forty Quarters and four Districts.51 According to DETRAN,
the total number of vehicles in the city is around 160,000
units. Nowadays, 64.7% of vehicles are fueled with gasohol
(gasoline with 24% of ethanol), 11.7% with neat ethanol,
12.3% with compressed natural gas (CNG), 2.5% are flexfueled cars (gasohol and ethanol) and 8.8% are heavy-duty
diesel vehicles.52 The city has about 3,000 buses and 690
micro-buses.
The bus station is located in a residential area with
reduced commercial activity and no industries in its
surroundings. There is no other activity inside the station
except for traffic of buses. The station occupies a 10,621 m2
area in one floor and is composed by 8 platforms (each
one for four vehicles) for arrivals and departures of urban
heavy-duty diesel buses. The confluence of 14 bus lines
coming from six other districts of Duque de Caxias and
eight other cities of the Metropolitan Region of Rio de
Janeiro occurs at the station. Besides the movement of
arrival and departure, many vehicles that are waiting for
the next departure remain with their motors on. Buses stay
about one minute commuting in the station.
No other activities are developed in the bus station and
its surroundings. Vehicle count was performed in parallel
with particulate matter sampling. The total number of buses
is about 180 vehicles a day and light-duty cars represent
about 2% of the total flux. No noticeable differences in
the vehicle flux were observed during weekdays. Since the
only significant emission sources are buses, the location is
representative of a diesel impacted environment.
1567
Sampling procedure
The TSP and PM10 samplers were installed beside one
of the platforms at a height of 2 m from ground level. TSP
and PM10 samplings were performed twice a week using
high volume samplers (Sibata, Japan) and borosilicate
glass microfiber filters (110 mm diameter, 0.22 mm
thickness, Sibata, Japan). Samplings were performed
randomly from Monday to Friday. No samplings were
performed in the afternoon and at night because the
main goal of this work was to identify typical emissions
of diesel-powered vehicles. Experiments at night and
during weekends were not possible to be performed
because of security reasons and availability of samplers.
Vehicles were counted in parallel with particulate matter
sampling. A flow rate of 500 L min-1 and 6 hour sampling
time were adopted for the collection of 66 samples (33
for TSP samples and 33 for PM10 samples) from August
2006 to February 2007 in Prefeito José Carlos Lacerda
bus station. After sampling, the filters were wrapped with
aluminum foil, placed inside sealed plastic bags and stored
at −20 ºC up to 14 days until weighing, extraction and
analysis. Due to instrumental availability, only TSP and
PM10 samples were collected.
Extraction procedure and analysis
Gravimetric determinations were carried out as
described in Method IO-3.1, 1999.53
Sixteen PAHs specified on USEPA Method 61054
in a mixture, internal standards (naphthalene-D8,
acenaphthene-D10, phenanthrene-D10, chrysene-D12,
and perylene-D12) and surrogates (2-Fluorobiphenyl
and D14-Terphenyl) were obtained from AccuStandard
(AccuStandard, USA).
Extraction procedures followed Method 3550b55 as
described by Quiterio et al.42 Briefly, surrogate mix was
added to the filter samples before extraction procedure,
then those filters were sonicated four times with 50 mL
dichloromethane (DCM) for 15 min and then with
100 mL for 20 min.56 The organic extract was filtered and
concentrated to 2 mL on a rotatory evaporator. Surrogate
recoveries ranged from 48 to 72%. Afterwards, PAH
concentrations were corrected according to the efficiency
of recovery during extraction.
Prior to injection, 1 µg of internal standards mix was
added to the extracts. All samples were analyzed using
a Gas Chromatograph (GC Agilent Model 6890, USA)
hyphenised to a Mass Spectrometry selective detector
(Agilent Model 5973, USA), equipped with a HP-5
(30 m × 0.25 mm dia. × 0.25 µm film thickness, Agilent,
1568
Particle-Associated Polycyclic Aromatic Hydrocarbons and their Dry Deposition Fluxes
USA) GC column. 1 µL samples were injected on splitless
mode at an injector temperature of 300 oC. The carrier
gas was helium at a constant flow of 1.2 mL min-1. Oven
temperature was programmed as follows: 50 ºC (2 min) →
300 oC (12 ºC min-1) → 300 ºC (10 min). Quantitative
analyses were performed using a single ion monitoring
(SIM) method under 70 eV of electron energy.
Chromatographic peaks were identified and quantified,
based on their GC-MS acquired retention times and mass
spectra of the authentic standards used as reference:
naphthalene (Na)-128, acenaphthylene (Acy)-152,
acenaphthene (Ace)-153, fluorene (Flu)-166, phenanthrene
(Phe)-178, anthracene (An)-178, fluoranthene (Flt)-202,
pyrene (Py)-202, benzo[a]anthracene (B[a]An)-228,
chrysene (Chry)-228, benzo[b]fluoranthene (B[b]F)-252,
benzo[k]fluoranthene (B[k]F)-252, benzo[a]pyrene (B[a]
Py)-252, indene[1,2,3-c,d]pyrene (IPy)-276, dibenz[a,h]
anthracene (DB[ah]A)-278, and benzo[ghi]perylene
(B[ghi]P)-276. Field blanks, which accompanied samples
from the collecting sites, were used in order to avoid
background contamination of results.
Quantification limit (QL) and detection limit (DL)
were determined as 10 ng and 8 ng, respectively. The QL
was the first point (the point of lowest concentration) from
each linear calibration curve. DL was determined from the
standard deviation from the responses of seven replicates
of the lowest point in the calibration curve, multiplied by
the correspondent t-factor for 95% confidence interval.
Considering the total sampled air volume (1600 m3), the QL
and DL from this method were estimated to be 0.006 ng m-3
and 0.005 ng m-3, respectively.
Statistical analysis
Experimental data were analysed using STATISTICA
6.0 (Statsoft, USA) software pack. Principal Component
Analysis (PCA) and Cluster Analysis (CA), using Euclidian
distances and Ward’s Method, were also performed, as
classification and ordination methods.
J. Braz. Chem. Soc.
Results and Discussion
PAH levels in TSP and PM10 samples
TSP levels were in the range of 39 to 52.4 µg m-3 and
the arithmetic mean was 200 µg m-3. Similarly, values for
PM10 ranged from 38 to 434 µg m-3, with a mean value of
210 µg m-3.
The concentrations of the studied PAH samples are
shown in Table 1. The average values (in ng m-3) are
mean values for the 33 samples (33 TSP and 33 PM10
samples). Individual concentrations were between the
detection limit for acenaphtylene, acenaphthene, anthracene
and fluorene and 2.27 and 1.74 ng m-3 for benzo[ghi]
perylene (B[ghi]P) for TSP and PM10, respectively. The
concentrations of naphthalene (Na), acenaphtylene (Acy),
acenaphthene (Ace), fluorene (Flu) are not reported because
samplings were performed for rather long periods (6 h) in
unfavorable temperature conditions. The platform area is
not well ventilated and samples were collected in spring
and summer when ambient temperatures are very high in
Brazil. The obtained concentrations values are probably
underestimated due to volatilization of the low molecular
weight compounds. Long sampling periods may alter the
chemical composition of samples because of volatilization,
chemical and photochemical transformations leading to
underestimated PAH concentrations. A comparative study
of PAH concentrations determined in PM10 and GF/PUF
(glass fiber filters and a polyurethane foam filter) samples
collected at two urban stations in the city of Brno, Czech
Republic,57 showed that the GF/PUF method gave an amount
of low molecular weight U.S.EPA priority PAHs (Na, Acy,
Ace, Flu, Phe, An, Flt, Py) several times higher than the
high volume sampling of the PM10 fraction. Ciganek et al.57
concluded that sampling using the PM10 method could lead
to an underestimation of overall PAH concentrations and,
particularly, of low molecular weight compounds.
ΣPAH accounted for 0.0018% of the TSP mass and
0.0012% of the PM10 mass. The total PAHs contents on
Table 1. PAH concentration (ng m-3) and PAH particle content of PM collected in this study (units in µg g-1)
Phe
Flt
Py
B[a]An
Chry
B[b]F
B[k]F
B[a]Py
Ipy
DB[ah]A B[ghi]P
Total
TSP
0.116
0.174
0.288
0.166
0.262
0.557
0.131
0.363
0.524
0.117
0.866
3.564
PM10
0.087
0.119
0.203
0.132
0.191
0.424
0.107
0.268
0.365
0.118
0.611
2.625
TSP
0.58
0.87
1.44
0.83
1.31
2.78
0.65
1.81
2.61
0.58
4.32
17.78
PM10
0.41
0.57
0.97
0.63
0.91
2.02
0.51
1.28
1.74
0.56
2.91
12.49
PAH concentration / (ng m-3)
PAH content / (µg g-1)
Vol. 20, No. 9, 2009
1569
Machado et al.
the particle phase were 17.8 µg g-1 and 12.5 µg g-1 for
TSP and PM10, respectively. Individual PAH content on
both particle phase fractions are described on Table 1.
Contribution of carcinogenic USEPA priority PAHs
(B[a]An, B[b]F, B[k]F, B[a]Py, IPy and DB[ah]A)
were 9.27 µg g-1 (52% of total PAHs) and 6.73 µg g-1
(54% of total PAHs), respectively. Carcinogenic PAHs
contributions show similar percentual values thus
evidencing serious health concerns.
Unfortunately, there are few studies reporting PAH
concentrations in Brazilian areas emitted from heavyduty diesel vehicles.38,48 Tavares Jr. et al.48 determined
the concentration of vapor phase PAHs at the central bus
station of Londrina (Brazil) where only diesel-powered
vehicles circulate. PAHs were collected using XAD-2
resin cartridges and analyzed by gas chromatography with
both flame ionization and mass spectrometer detectors.
Ten PAH were found (naphthalene, acenaphthylene,
acenaphthene, fluorene, phenanthrene, anthracene,
fluoranthene, pyrene, benzo(a)anthracene and chrysene)
and the most abundant compounds were phenantrene,
fluorene and naphthalene. Pereira et al.38 used a TSP high
volume sampler with quartz fiber filters. Samples were
collected at the Lapa bus station located in a downtown
area of Salvador, Bahia (Brazil). Chrysene presented
the highest average concentration but relative high
concentrations were obtained for fluorantene, pyrene,
benzo[a]anthracene, benzo[b]fluoranthene, benzo[k]
fluoranthene, benzo[a]pyrene, indene[1,2,3-cd]pyrene
and benzo[ghi]perylene as well. Our results are in quite
good agreement with these data.
Diagnostic ratios
PAH concentrations and molecular ratios have been
used to distinguish emissions and indicate the impact of
different sources of airborne compounds.58-62
Diagnostic ratios between PAHs are presented in
Table 212,20,38,63-68 both for TSP and PM10 samples. Ratios
are very similar for PM10 and TSP samples. Values obtained
in PM10 samples are indicated in italics.
In 2004, Manoli et al.12 published the PAHs profiles
for several urban, industrial and geological sources, in
particular diesel fueled buses, paved road dust and soil dust
absorbed on PM10 samples. In general, diagnostic ratios for
ambient urban samples were similar to those obtained for
paved road and soil dust. Ratios obtained from the exhaust
of diesel vehicles are rather different suggesting that the
PM10 fraction has an important contribution of mechanical
sources and ressuspension of dust. In Table 2, typical ratios
for diesel vehicles, light cars, urban TSP and PM10 samples,
paved road dust, soil dust are listed for comparison.
Urban samples were those determined by Mantis et al.63
in an Aristotelous street, in downtown Athens, with dense
vehicular traffic and commercial activities, and by Manoli
et al.12 in the city center of Thessalonike, Greece, an area
with high commercial activities and traffic density. It must
be noted that the reported ratios are, in many cases, spread
in a wide range of values and there is not a clear difference
between diesel and gasoline emissions.
The sum of concentrations of the nine combustion PAHs
(CPAH) (see Table 2) divided by the total concentration
of PAHs gave the values 0.93 and 0.91 for TSP and PM10
Table 2. Diagnostic PAH ratios of samples obtained at Mayor José Carlos Lacerda Bus Station
This study
TSP
This study
PM10
Diesel vehicles
Gasoline vehicles
Urban Samples
Soil dust
Paved road dust
CPAH/∑PAH
0.93 ± 0.03
0.91 ± 0.17
0.77;12 0.8863
0.73;12 0.6068
0.95;12 1.18;33
0.9263
0.89;12 0.8312
0.82;12 0.86;12
0.8712
B[ghi]Pe/B[a]Py
2.44 ± 0.80
2.27 ± 0.88
0.11;12 3.69;65
1.2-2.264
3.05;12 1.72;12
2.5-3.364
2.00;12 1.26;33 1.18;12 0.25;12
4.3663
0.8612
2.70;12 1.09;12
3.67;12 0.9120
IPy/(Ipy + B[ghi]Pe)
0.37 ± 0.05
0.37 ± 0.05
0.96;12 0.350.7064
0.26;12 0.5112
0.38;12 0.38;33
0.3263
0.61;12 0.9112
0.51;12 0.57;12
0.5212
B[a]An/(B[a]An + Chry)
0.39 ± 0.03
0.40 ± 0.08
0.73;12 0.3763
0.76;12 0.5812
0.43;12 0.20;33
0.4063
0.29;12 0.2012
0.67;12 0.42;12
0.32;12 0.5065,66
Flt/(Flt + Py)
0.37 ± 0.03
0.36 ± 0.07
0.38;12 0.46;63 0.14;12 0.17;12 0.47;67 0.37;12 0.34;33
0.3620
0.41;65,66 0.4064
0.3963
0.52;12 0.6112
0.42;12 0.52;12
0.4264
B[a]Py/(B[a]Py + Chry)
0.56 ± 0.12
0.55 ± 0.15
0.38-0.65;65,66
0.4668
na
na
na
0.1833
CPAH: Flt +Py+B[a]An+Chry+B[b]F+B[k]F+B[a]Py+B[ghi]Pe+IPy.
12
Manoli et al.; 33Pereira Netto et al.; 63Mantis et al.; 20Rogge et al.; 64Rogge et al.; 65Kavouras et al.; 66Kavouras et al.; 67Sienra et al.; 68Oda et al.; na: not
available.
1570
Particle-Associated Polycyclic Aromatic Hydrocarbons and their Dry Deposition Fluxes
samples, respectively. This value is in the same range of
previous reported ratios for downtown areas.12,63 As shown
in Table 2, these values are also similar to those obtained
for soil and road dust samples.
The ratios B[ghi]Pe/B[a]Py, calculated as 2.44 and
2.27 for TSP and PM10, respectively, are compatible with
values reported for road dust and some urban areas.63 Values
obtained directly from buses exhausts are significantly
smaller, ranging from 0.1112 to 1.2-2.2.63
Considering the carcinogenic compounds, the ratios,
B[a]An/(B[a]An + Chry) and B[a]Py/(B[a]Py + Chry) were
calculated as 0.38-0.39 and 0.56-0.55, respectively, values
also associated to urban areas with high density traffic and
road dust.12,63,65,66 The value determined from the direct
exhaust of diesel buses is 0.73.12
The ratio Flt/(Flt+Py) was calculated as 0.37 and 0.36
for TSP an PM10, respectively. These values are in good
agreement with the ratio obtained for diesel buses,12 diesel
trucks20 and urban areas12,63 and they are also similar to the
value obtained by Quiterio et al.42 in an area with a high
contribution of diesel buses and trucks. These data may
be compared with those determined by Pereira et al.38 at
the Lapa bus station in Salvador for TSP samples. The
diagnostic ratios displayed in Table 2 were calculated using
the mean concentrations reported by the authors. The value
for the CPAH/∑PAH ratio is similar to that reported in
this work. The other ratios are, in general, similar to those
reported for soil dust12 except for the Flt/(Flt+Py) ratio,
0.34, compatible with diesel emissions.
The benzo[a]pyrene equivalent carcinogenic power
(BaPE) 69,70 was also estimated. This index tries to
parameterize the health risk for humans related to
ambient PAH exposition and is calculated by multiplying
the concentrations of each carcinogenic congener, as
follows:
J. Braz. Chem. Soc.
Statistical analysis
In order to obtain an insight on the main correlations
among PAHs, cluster analysis (CA) and factorial analysis
(FA) were applied for each set of data.
Table 3. Results of PCA for the correlation matrix [33 × 11] obtained
with TSP and PM10 data at the bus station
TSP
[33 × 11]
PC
PM10
[33 × 11]
1
2
1
2
Eigenvalues
7.4
1.6
7.5
1.5
% total variance
66.8
14.1
68.0
13.8
Phe
0.7
0.4
0.7
0.4
Flt
0.9
0.2
0.8
0.3
Py
0.9
0.2
0.8
0.3
B[a]An
0.2
0.9
0.2
0.9
Chry
0.2
1.0
0.2
0.9
B[b]F
0.8
0.2
0.9
0.2
B[k]F
0.9
0.2
0.8
0.4
B[a]Py
0.9
0.3
0.8
0.4
IPy
0.8
0.3
0.8
0.5
DB[ah]An
0.9
0.0
0.9
-0.1
B[ghi]Pe
0.7
0.4
0.6
0.6
Loading
Factor loadings > 0.5 are in bold.
For TSP samples (Figure 1, Table 3), the correlation
matrix [33 × 11] gave two main clusters and two significant
principal components (PCs) which explain 81% of the total
variance. The elements Chry and B[a]An are together in
PC2 and in the same cluster. The other elements are in
PC1 and also in the other cluster. The correlation matrix
[33 × 11] gave the same cluster and PCs for PM10 samples
B[a]An × 0.06 + {B[b]F + B[k]F} × 0.07 + B[a]Py +
DB[ah]An × 0.6 + IPy × 0.08.
The calculated values are 0.17 and 0.41 ng m-3 for
TSP and PM10 samples, respectively. These values do
not represent a significant cancer risk for passengers and
workers in the bus station area.
This is, to our knowledge, the first reported diagnostic
ratio for a diesel fleet in Brazil and may be considered
as a typical value for emissions of high-duty vehicles in
the country. Anyway it is clear that a further study in the
PM2.5 fraction is highly desirable in order to assess both
the inhalable fraction and the fraction due predominately
to combustion processes.
Figure 1. Dendogram of the cluster analysis of PAHs at the bus station
for TSP samples.
Vol. 20, No. 9, 2009
1571
Machado et al.
mechanisms. Indeed, some authors, such as Vardar et al.71
and Chang et al.,8 have modeled Vd and they have found
results comparable to those from Sheu et al.72 In this study
PAH particle dry depositions were calculated using Vd as
stated on the latter cited study as shown in Table 4.
Dry deposition flux for the total PAHs (Fd of ΣPAH)
showed the highest value (0.603 µg m-2 day-1) for TSP
followed by PM10 (0.436 µg m-2 day-1). Individual deposition
fluxes are found in Table 4. In most sites B[ghi]P was the
PAH with the highest deposition flux followed by IPy.
The apparent dry deposition fluxes from Table 4
were calculated taking into account both the geometric
average concentration level of an individual PAH sorbed
on particulate matter and the dry deposition velocity but it
should also have been taken into account PAH reactivity
which can be an important parameter in interpreting the
dataset. Nilsen74 has developed a reactivity scale that
groups PAHs into five classes of reactivity (from Class
I-the most reactive group-to Class V-the least reactive one)
toward nitrating species generating then either nitro-PAHs,
oxy-PAHs or quinones (these are PAH derivatives much
more carcinogenic and/or mutagenic than the originating
species and then of greater concern in health issues). If a
PAH is more reactive than other, it is more easily modified
(removed) by a photochemical reaction and it would be not
found at high levels in PM and then dry or wet deposition
mechanisms would not be its main atmospheric fate. On the
other hand, the less reactive the PAH the more probable is to
sink by either dry or wet depositions, depending on its vapor
pressure and water solubility (being, therefore, probably
promoted to any terrestrial and/or aquatic systems). This
should be considered when analyzing some isomer pairs
such as Phe and An, Flt and Py, B[b]F and B[k]F, and IPy
and DB[ah]A. Flt belongs to Class V and Py is Class III
then it is reasonable to accept that Py, being more reactive
than Flt, would be more readily modified to any of its
possible nitro-derivatives and less Py would be available
to be dry deposited.75 The same occurs with IPy (Class V)
Figure 2. Dendogram of the cluster analysis of PAHs at the bus station
for PM10 samples.
(Figure 2, Table 3) than for total particulate matter. The only
noticeable difference is that B[ghi]Pe is associated both to
PC1 and PC2. Also, two subgroups may be identified within
the second cluster according to their liquid vapor pressures.
The Flt/Py correlation coefficient was 0.96, in close
agreement with that obtained by Pereira et al.38 It is
noteworthy that these were the only compounds that gave
a diagnostic ratio compatible with direct diesel emissions.
Particle-associated PAHs dry deposition fluxes
Dry atmospheric deposition fluxes (Fd) were calculated
by multiplying the geometric mean of each PAH
concentration (Ci) in the particulate matter times the PAH
dry settling velocity (Vd) as follow:
Fd = Ci × Vd
(1)
Deposition velocity, V d, may vary 1-2 orders of
magnitude8,71-73 due either to particle size, climatic or
physical conditions in the atmosphere Even considering
those uncertainties, the particulate matter dry deposition
flux calculations help to better understand PAHs removal
Table 4. Estimates of particle PAH dry deposition fluxes (Fd)
Bus Station, Duque de Caxias, RJ
Phe
Flt
Py
B[a]An
Chry
B[b]F
B[k]F
B[a]Py
IPy
Dry settling velocity / (Vd) (cm s-1)*
0.23
0.41
0.2
0.35
0.54
0.55
0.62
0.71
0.89
DB[ah]A B[ghi]Pe
0.76
0.97
TSP
Geometric mean / (ng m-3)
0.11
0.15
0.25
0.15
0.24
0.48
0.12
0.31
0.41
0.10
0.72
Dry deposition flux (Fd) / (µg m-2 day-1)
0.022
0.053
0.043
0.045
0.112
0.228
0.166
0.190
0.315
0.066
0.603
0.080
0.13
0.18
0.12
0.17
0.37
0.097
0.24
0.30
0.11
0.52
0.016
0.046
0.031
0.036
0.079
0.176
0.052
0.147
0.231
0.072
0.436
PM10
Geometric mean / (ng m-3)
-2
-1
Dry deposition flux (Fd) / (µg m day )
*According to Sheu et al.,72 1996.
1572
Particle-Associated Polycyclic Aromatic Hydrocarbons and their Dry Deposition Fluxes
and DB[ah]A (Class IV), the latter apparently possessing
lower dry deposition fluxes. In the case of B[b]F and B[k]
F pair, both belong to the same reactivity class (Class V)
and their high fluxes derive from both high concentration
levels and deposition velocities. Summing up, if dry
deposition were the main removal mechanism for Phe,
Flt, IPy, B[b]F, B[k]F and in minor extension, for DB[ah]
A (and the other Class IV, Chry), those particle airborne
once deposited might be resuspended by any mechanical/
physical perturbation being then able to be enriched of some
PAH freshly generated (vapor-PAH converted to particle or
by any physical interaction as accumulation, coagulation,
etc acting in both freshly and aged particulate PAH) and
be again dry deposited. This cyclic path of the PAHs could
occur continuously and the particulate matter be aged in
relation to some less reactive PAH.
J. Braz. Chem. Soc.
2. Bodnar, E.; Hlavay, J.; Microchem. J. 2005, 79, 213.
3. Nielsen, T.; Atmos. Environ. 1996, 30, 3481.
4. Bae, S. Y.; Yi S. M.; Kim Y. P.; Atmos. Environ. 2002, 36, 5491.
5. Meudec, A.; Dussauze, J.; Deslandes, E.; Poupart, N.;
Chemosphere 2006, 65, 474.
6. Vasconcellos, P. C.; Zacarias, D.; Pires, M. A. F.; Pool, C. S.;
Carvalho, L. R. F.; Atmos. Environ. 2003, 37, 3009.
7. Albinet, A.; Leoz-Garziandia, E.; Budzinski, H.; Villenave, E.;
J. Chromatogr., A 2006, 1121, 106.
8. Chang, K. F.; Fang, G. C.; Lu, C.; Bai, H.; Aerosol Air Qual.
Res. 2003, 3, 41.
9. Chen, S. C.; Liao, C. M.; Sci. Total Environ. 2006, 366, 112.
10. Dabestani, R.; Ivanov, I. N.; Photochem. Photobiol. Sci. 1999,
70, 10.
11. Shah, S. D.; Ogunyoku, T. A.; Miller, J. W.; Cocker, D. R.;
Environ. Sci. Technol. 2005, 39, 5276.
12. Manoli, E.; Kouras, A.; Samara, C.; Chemosphere 2004, 56,
Conclusions
867.
13. Fromme, H.; Oddoy, A.; Piloty, M.; Krause, M.; Lahrz, T.; Sci.
In this work the atmospheric concentrations of
priority PAHs associated to TSP and PM10 samples were
determined. Individual concentrations were between the
detection limit (acenaphtylene, acenaphthene, anthracene
and fluorene) and 2.27 and 1.74 ng m-3 for benzo[ghi]
perylene (B[ghi]P) for TSP and PM10, respectively.
ΣPAH accounted for 0.0018% of the TSP mass and
0.0012% of the PM10 mass. The total PAH contents on the
particle phase were 17.8 µg g-1 and 12.5 µg g-1 for TSP
and PM10, respectively. Contributions of carcinogenic
USEPA priority PAHs (B[a]An, B[b]F, B[k]F, B[a]Py, IPy
and DB[ah]A) were 9.27 µg g-1 (52% of total PAHs) and
6.73 µg g-1 (54% of total PAHs), respectively, then, a serious
health concern.
Diagnostic ratios were, in general, quite different
from those determined in the exhaust of diesel vehicles
suggesting an important contribution of mechanical sources
and ressuspension of dust. A further study in the respirable
fraction is highly desirable in order to assess the contribution
of PAHs due predominantly to combustion processes.
Total Environ. 1998, 217, 165.
14. Kendall, M.; Duarte, A.; Rocha-Santos, T.; Hamilton, R.;
Williams, I.; J. Environ. Monit. 2002, 4, 890.
15. Hien, T. T.; Nam, P. P.; Yasuhiro, S.; Takayuki, K.; Norimichi,
T.; Hiroshi, B.; Sci. Total Environ. 2007, 382, 70.
16. Abrantes, R.; Assunção, J. V.; Pesquero, C. R.; Atmos. Environ.
2004, 38, 1631.
17. Devos, O.; Combet, E.; Tassel, P.; Paturel, L.; Polycyclic Aromat.
Compd. 2006, 26, 69.
18. Durán, A.; de Lucas, A.; Carmona, M.; Ballesteros, R;
Chemosphere 2001, 44, 921.
19. Yang, H. H.; Chien, S. M.; Chao, M.-R.; Lin, C. C.; J. Hazard.
Mater. 2005, 125, 154.
20. Rogge, W. F.; Hildemann, L. M.; Mazurek, M. A.; Cass, G. R.;
Simoneit, B. R. T.; Environ. Sci. Technol. 1993, 27, 636.
21. Marr L.C.; Kirchstter W.; Harley R. A.; Miguel A. H.; Herings
S. V.; Hammonds S. K.; Environ. Sci. Technol. 1999, 33, 3091.
22. Valavanidis, A.; Fiotakis, K.; Vlahogianni, T.; Bakeas, E.
B.; Triantafillaki, S.; Paraskevopoulou, V.; Dassenakis, M.;
Chemosphere 2006, 65, 760.
23. Turrio-Baldassarri, L.; Battistelli, C.L.; Conti, L.; Crebelli, R.;
Acknowledgments
De Berardis, B; Iamiceli, A.L.; Gambino, M.; Iannaccone, S.;
Sci. Total Environ. 2006, 355, 64.
The study was partially funded by CNPq. We would
like to thank the collaboration of Marcos Menezes and
Luiz Carlos de Oliveira, FIOCRUZ, for lending the high
volume samplers.
25. Vasconcellos, P. C.; Zacarias, D.; Carvalho, L. R. F.; Pires, M.
References
26. Azevedo, D. A.; Moreira, L. S.; Siqueira, D. S.; Atmos. Environ.
24. Turrio-Baldassarri, L.; Battistelli, C.L.; Conti, L.; Crebelli, R.;
De Berardis, B; Iamiceli, A.L.; Gambino, M.; Iannaccone, S.;
Sci. Total Environ. 2004, 327, 147.
A. F.; Pool, C.; Atmos. Environ. 2003, 37, 3009.
1999, 33, 4987.
1. Mastral, A. M.; Lopez, J. M.; Callen, M. S.; Garcia, T.; Murillo,
R.; Navarro, M. V.; Sci. Total Environ. 2003, 307, 111.
27. Oliveira, A. S.; Fernandes, M. B.; Moreira, J. C.; Ferreira, L.
F. V.; J. Braz. Chem. Soc. 2002, 13, 245.
Vol. 20, No. 9, 2009
1573
Machado et al.
28. Fernandes, M. B.; Brickus, L. S. R.; Moreira, J. C.; Cardoso,
J. N.; Chemosphere 2002, 47, 417.
29. Ré-Poppi, N.; Santiago-Silva, M.; Atmos. Environ. 2005, 39,
2839.
30. Ströher, G. L.; Ré-Poppi, N.; Raposo Jr., J. L.; Souza, J. B. G.;
Microchem. J. 2007, 86, 112.
31. Pereira Netto, A. D.; Cunha, I. F.; Muniz, F. C.; Rego, E. C. P.;
Bull. Environ. Contam. Toxicol. 2001, 67, 271.
32. Pereira Netto, A. D.; Muniz, F. C.; Rego, E. C. P.; Bull. Environ.
Contam. Toxicol. 2002, 68, 831.
33. Pereira Netto, A. D.; Barreto, R. P.; Moreira, J. C.; Arbilla, G.;
Bull. Environ. Contam. Toxicol. 2002, 69, 173.
34. Pereira Netto, A. D.; Sisinno, C. L.; Moreira, J. C.; Arbilla, G.;
Dufrayer M. C., Bull. Environ. Contam. Toxicol. 2002, 68, 148.
35. Pereira Netto, A. D.; Krauss, T. M.; Cunha, I. F.; Rego, E.C.P.;
Water, Air, Soil Pollut. 2006, 176, 57.
36. Lima, F. M.; MSc Dissertation, Universidade Federal
Fluminense, Brazil, 2006.
37. Azevedo, D. A.; Dos Santos, C. Y. M.; Aquino Netto, F. R.;
Atmos. Environ. 2002, 36, 2383.
38. Pereira, P. A. P.; de Andrade, J. B.; Miguel, A. H.; J. Environ.
Monit. 2002, 4, 558.
39. Miguel, A. H.; Pereira, P. A. P.; Aerosol Sci. Technol. 1989, 10,
292.
40. Martinis, B.; Okamoto, R. A. B.; Kado, N. Y.; Gundel, L.;
Carvalho, L. R. F.; Atmos. Environ. 2002, 36, 307.
41. Santos, C. Y. M.; Azevedo, D. A.; Aquino Neto, F. R.; Atmos.
Environ. 2002, 36, 3009.
42. Quiterio, S. L.; Arbilla, G.; Bauerfeldt, G. F.; Moreira, J. C.;
Water, Air, Soil Pollut. 2007, 179, 79.
43. Miguel, A. H.; de Andrade, J. B.; Hering, S. V.; Int. J. Environ.
Anal. Chem. 1986, 26, 265.
44. Bourotte, C.; Forti, M. C.; Taniguchi, S.; Bícego, C.; Lotufo,
P. A.; Atmos. Environ. 2005, 39, 3799.
45. Dallarosa, J. B.; Mônego, J. G.; Teixeira, E. C.; Stefens, J. L.;
Wiegand, F.; Atmos. Environ. 2005, 39, 1609.
46. Dallarosa, J. B.; Teixeira, E. C.; Meira L.; Wiegand, F.; Atmos.
Environ. 2008, 89, 76.
47. Dallarosa, J. B.; Teixeira, E. C.; Pires, M.; Fachel, J.; Atmos.
Environ. 2005, 39, 6587.
48. Tavares Jr, T.; Pinto, J. P.; Souza, A. L.; Scarmínio, I. S.; Solci,
M. C.; Atmos. Environ. 2004, 38, 5039.
52. http://www.detran.rj.gov.br, accessed in July 2007.
53. http://www.epa.gov/ttnamti1/files/ambient/inorganic/mthd-3-1.
pdf, accessed in July 2006
54. http://www.epa.gov/Region9/qa/pdfs/40cfr136_03.pdf,
accessed in July 2006
55. http://www.epa.gov/epaoswer/hazwaste/test/pdfs/3550c.pdf,
accessed in July 2006
56. http://www.epa.gov/epaoswer/hazwaste/test/pdfs/8270c.pdf ,
accessed in July 2006
57. Ciganek, M.; Neca, J.; Adamec, V.; Janosek, J.; Machala, M.;
Sci. Total Environ. 2004, 334-335, 141.
58. Guo, H.; Lee, S. C.; Ho, K. F.; Wang, X. M.; Zou, S. C.; Atmos.
Environ. 2003, 37, 5307.
59. Venkataraman, C.; Lyons, J. M.; Friedlander, S. K.; Environ.
Sci. Technol. 1994, 28, 555.
60. Cotham, W. E.; Bidleman, T. F.; Environ. Sci. Technol. 1995,
29, 2782.
61. Harrison, R. M.; Smith, D. J. T.; Luhana, L.; Environ. Sci.
Technol. 1996, 30, 825.
62. Alves, C.; Pio, C.; Duarte, A.; Atmos. Environ. 2001, 35, 5485.
63. Mantis, J.; Chaloulakou, A.; Samara, C.; Chemosphere 2005,
59, 593.
64. Rogge, W. F.; Hildemann, L. M.; Mazurek, M. A.; Cass, G. R.;
Simoneit, B. R. T.; Environ. Sci. Technol. 1993, 27, 1892.
65. Kavouras, I. G.; Lawrence, J.; Koutrakis, P.; Stephanou, E. G.;
Oyola, P.; Atmos. Environ. 1999, 33, 4977.
66. Kavouras, I. G.; Koutrakis, P.; Tsapakis, M.; Lagoudaki, E.;
Stephanou, E. G.; Von Baer, D.; Oyola, P.; Environ. Sci. Technol.
2001, 35, 2288.
67. Sienra, M. R.; Rosazza, N. G.; Préndez, M.; Atmos. Res. 2005,
75, 267.
68. Oda, J.; Nomura, S.; Yasuhara, A.; Shibamoto, T.; Atmos.
Environ. 2001, 35, 4819.
69. Alves, C.; An. Acad. Bras. Ciênc. 2008, 80, 21.
70. Marino, F; Cecinato, A; Siskos, P.A.; Chemosphere 2000, 40,
533.
71. Vardar, N.; Odabasi, M.; Holsen, T. M.; J. Environ. Eng. 2002,
128, 269.
72. Sheu, H.-L.; Lee, W. J.; Su, C. C.; Chao, H. R.; Fan, Y. C.;
J. Environ. Eng. 1996, 122, 1101.
73. Fang, G. C.; Chang, K. F.; Lu, C.; Bai, H.; Chemosphere 2004,
55, 787.
49. Corrêa, S. M.; Arbilla, G.; Atmos. Environ. 2006, 40, 6821.
74. Nielsen, T.; Environ. Sci. Technol. 1984, 18, 157.
50. Wingfors, H.; Sjodin, A.; Haglund, P.; Brorstrom-Lundén, E.;
75. Tasdemir, Y.; Esen, F.; Atmos. Environ. 2007, 41, 1288.
Atmos. Environ. 2001, 35, 6361.
51. http://www.duquedecaxias.rj.gov.br/web/cgi/cgilua.exe/sys/
start.htm, accessed in April 2007.
Received: November 4, 2008
Web Release Date: August 31, 2009
Baixar