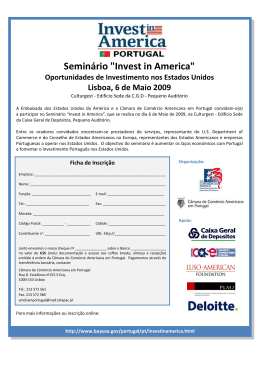
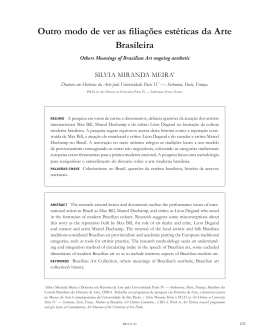
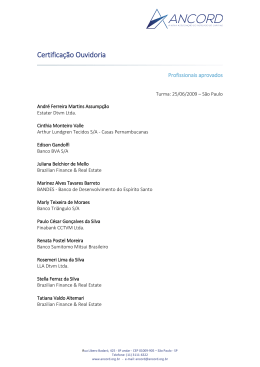
Brazilian Ports: Institutional overview and Investment opportunities Presentation for the World Economic Forum on Latin America Panama City – April 2014 MINISTRY OF PORTS SECRETARIA DE PORTOS DA PRESIDÊNCIA DA REPÚBLICA SEP/PR New Port Law: Federal Law 12.815/2013 Legal references: • Federal Law n. 12.815, 2013; and • Federal Decree n. 8.033, 2013. Main changes: Centralized Intermodal Logistic Planning; Realocation of responsabilities and competences among public players (Ministry of Ports, Federal Agency and Port Authorities); Main goals: logistic cost reduction and efficiency; and Competition enhancement Brazilian Ports: Institutional Overview and Investment Opportunities Brazilian Public Ports: 37 Ports AP RR AM MA PA CE RN PI PB PE AC AL PI RD SE BA MT DF GO MG ES MS SP RJ PR SC RS Brazilian Ports: Institutional Overview and Investment Opportunities Porto de MANAUS Porto de MACAPÁ Porto de SANTARÉM Porto de VILA DO CONDE Porto de BELÉM Porto de ITAQUI Porto de FORTALEZA Porto de AREIA BRANCA Porto de NATAL Porto de CABEDELO Porto de RECIFE Porto de SUAPE Porto de MACEIÓ Porto de SALVADOR Porto de ARATU Porto de ILHEUS Porto de BARRA DO RIACHO Porto de VITÓRIA Porto do FORNO Porto de NITEROI Porto do RIO DE JANEIRO Porto de ITAGUAÍ Porto de ANGRA DOS REIS Porto de SÃO SEBASTIÃO Porto de SANTOS Porto de ANTONINA Porto de PARANAGUÁ Porto de SÃO FRANCISCO DO SUL Porto de ITAJAÍ Porto de IMBITUBA Porto de LAGUNA Porto de ESTRELA Porto de CACHOEIRA DO SUL Porto de PORTO ALEGRE Porto de PELOTAS Porto de RIO GRANDE Porto de PORTO VELHO Brazilian Private Terminals: 146 Terminals 20 Amazonas AM: 14 TUPs 6 ETCs 15 Pará PA : 14 TUPs 1 ETC 2 Amapá AP: 1 TUP 1 ETC 3 Maranhão MA : 3 TUPs 1 Ceará CE : 1 TUP 1 Rio Grande do Norte RN : 1 TUP AP RR 1 Pernambuco PE: 1 TUP AM MA PA CE RN PI 1 Alagoas AL : 1 TUP PB PE AC AL PI RD SE 2 Sergipe SE : 2 TUPs BA 8 Rondônia RO: 7 TUPs 1 ETC 11 Bahia BA : 11 TUPs MT DF 1 Mato Grosso MT 1 TUP GO MG ES 6 Mato Grosso do Sul MS 5 TUPs 1 ETC 11 Espírito Santo ES : 11 TUPs MS SP RJ PR SC 25 8 4 10 Rio de Janeiro RJ : 25 TUPs São Paulo SP : 8 TUPs Paraná PR : 4 TUPs Santa Catarina SC : 9 TUPs 1 IPT RS 16 Rio Grande do Sul RS : 16 TUPs TUP – Terminal de Uso Privado ETC – Estação de Transbordo de Carga IPT – Instalação Portuária de Turismo Posição de: 21/02/2014 Fonte: CGAPEE/DOP/SEP/PR Brazilian Ports: Institutional Overview and Investment Opportunities Demand forecast 2030 (by cargo) ANTAQ e SEP/PR (PNLP) 2500 Total = 2.260 177 108 2000 Million of Ton 754 1500 Demand Average Annual Growth Rate (2010-2030) 1000 Total = 904 BY CARGO 87 45 217 1221 Solid Bulk 5.68% per year Liquid Bulk 6.81% per year General Cargo** 3.37% per year Container 6.33% per year Total 5.70% per year 500 554 0 2012 Granel sólido 2030 Granel Líquido Carga Geral** Brazilian Ports: Institutional Overview and Investment Opportunities Contêiner **Excluding container Port Infrastructure Investiment Opportunities NEW CONCESSIONS • 159 areas organized in 4 Groups (U$ 7,2 billion investment) • Port Efficiency • Goal: to reduce logistic costs in Brazil PRIVATE TERMINALS • Simplified granting proceeding • No limitation to third party cargo handling • Trade off: higher investments – lower regulation EARLY RENEWAL OF ONGOING CONCESSION CONTRACTS • Additional investment on public ports of U$ 4 billion • Improvements on efficiency and capacity Brazilian Ports: Institutional Overview and Investment Opportunities Concessions: general view Public Port Concession Plan: 4 Groups 1st Group 2nd Group Santos/SP Vila do Conde/PA Santarém/PA Belém/PA Miramar/PA Outeiro/PA São Sebastião/SP Salvador/BA Aratu/BA Paranaguá/PR 54,2 bilhões Investment: U$ 3,9 billion 3rd Group 4th Group Maceió/AL Rio Grande/RS Suape/PE Porto Alegra/RS Recife/PE Imbituba/SC até 2014/15 Itajaí/SC Cabedelo/PB Fortaleza/CE São Francisco do Itaqui/MA Sul/SC Santana/AP Rio de Janeiro/RJ Niterói/RJ bilhões Itaguaí/RJ Vitória/ES em 2016/17 Manaus/AM 23,2 Concessions: 1st Group - Santos Investment: R$ 1,7 bi 20 areas reorganized into 9 terminals Capacity increase Cargo handled in 2012 27 105 105 Thousand ton Port of Santos Brazilian Ports: Institutional Overview and Investment Opportunities Concessions: 1st Group - Pará Investment: R$ 3,7 bi 20 areas for concession Capacity increase 21,2 Current capacity 105 22,4 Thousand ton Ports of Pará Brazilian Ports: Institutional Overview and Investment Opportunities Concessions: 2nd Group - Paranaguá Investment: R$ 2,6 bi 17 areas reorganized into 10 terminals 6 new docks Capacity increase Current capacity 36 105 40,4 Millions of ton Port of Paranaguá Brazilian Ports: Institutional Overview and Investment Opportunities Concessions: 2nd Group – Salvador Investment: R$ 662 thousand New container terminal and a new dock Capacity increase 456 Cargo handled in 2012 105 456 Thousand of TEUs Port of Salvador Brazilian Ports: Institutional Overview and Investment Opportunities Concessions: 2nd Group – Aratu Investment: R$ 659 mi 4 areas reorganized into 2 terminals and the construction of a new terminal. Capacity increase Cargo handled in 2012 8,1 14,2 105 Thousand ton Port of Aratu Brazilian Ports: Institutional Overview and Investment Opportunities Authorization – Private Terminals PRIVATE TERMINALS End of cargo ownership limitations: terminal is allowed to handle third parties and proprietary cargo without limitation New authorizations shall be granted only regarding areas outside public ports region Expedite Granting proceeding BETTER ENVIROMENT FOR PRIVATE INVESTMENTS Brazilian Ports: Institutional Overview and Investment Opportunities Authorizations (Private Terminals) id 1 2 3 4 5 6 7 8 9 10 11 12 13 14 15 16 17 18 Empresa (Razão Social) Estaleiro Brasa Flexibras - TUP Technimp Saipem do Brasil Fundação Municipal Perto Belo AMAGGI Exp e Imp Ltda BAMIN - Bahia Mineração Porto Sul Estaleiro Jurong (Aracruz) ETC - RONAV Transporte Bertolini Transporte Bertolini Transporte Bertolini Intermoor do Brasil Serviços Offshore de Instalação Ltda. Manabi Logística S.A. Mineração Buritirama S.A. Louis Dreyfus Commodities Brasil S.A. RIO TURIA SERVIÇOS LOGÍSTICOS LTDA- TERFRON Total Parcial Município Niterói São João da Barra Guarujá Porto Belo Porto Velho Ilhéus Ilhéus Aracruz Manaus Juruti Manaus Porto Velho UF RJ RJ SP SC RO BA BA ES AM PA AM RO Modalidade Estaleiro TUP - Apoio Off Shore TUP - Apoio Off Shore IPT TUP TUP TUP TUP - Estaleiro ETC ETC ETC ETC São João da Barra RJ TUP Linhares Barcarena ES PA TUP TUP São Simão GO Itaituba PA 54,2 bilhões Ultrafértil* Santos SP Total Geral * Expansão de TUP existente; não participou do anúncio de 2013. Valor de Investimento R$ 60.000.000,00 R$ 142.450.000,00 R$17.000.000,00 R$ 1.750.000,00 R$ 100.000.000,00 R$ 898.000.000,00 R$ 2.421.980.000,00 R$ 500.000.000,00 R$ 3.000.000,00 R$ 1.157.000,00 R$ 180.000,00 R$ 3.332.000,00 até 2014/15 R$ 73.600.000,00 13/02/2014 R$ 1.500.000.000,00 R$ 52.350.000,00 27/02/2014 18/03/2014 ETC R$ 12.196.671,00 27/03/2014 TUP R$ 50.505.000,00 27/03/2014 23,2 bilhões R$ 5.837.500.671,00 TUP (expansão)* R$ 2.257.000.000,00 R$ 8.094.500.671,00 em 2016/17 17 new authorizations granted = U$ 2,45 billion 41 terminals currently under analysis = U$ 2,56 billion Brazilian Ports: Institutional Overview and Investment Opportunities Data da Assinatura 11/12/2013 11/12/2013 11/12/2013 11/12/2013 03/01/2014 06/01/2014 06/01/2014 20/01/2014 07/02/2014 12/02/2014 12/02/2014 12/02/2014 03/12/2013 www.portosdobrasil.gov.br Antonio Henrique P. Silveira MINISTER MINISTRY OF PORT - BRAZIL SECRETARIA DE PORTOS DA PRESIDÊNCIA DA REPÚBLICA - SEP/PR Brazilian Ports: Institutional Overview and Investment Opportunities
Baixar