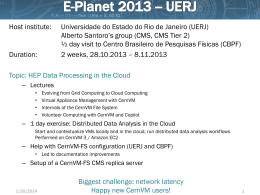
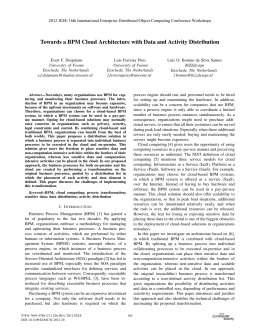
ASSESSMENT OF SUITABLE OBSERVATION CONDITIONS FOR A
MONTHLY OPERATIONAL REMOTE SENSING BASED CROP
MONITORING SYSTEM
Isaque Daniel Rocha Eberhardt1,*, Marcio Pupin Mello2, Rodrigo Rizzi3, Antonio Roberto Formaggio1,
Clement Atzberger4, Alfredo José Barreto Luiz5, William Foschiera1, Bruno Schultz1,
Kleber Trabaquini1, Elizabeth Goltz1
1
National Institute for Space Research – INPE
Avenida dos Astronautas 1758, 12227-010, São José dos Campos - SP, Brazil
*[email protected]
2
The Boeing Company
Boeing Research & Technology – Brazil (BR&T-Brazil)
Estrada Dr. Altino Bondesan 500 (Parque Tecnologico), Sao Jose dos Campos - SP, Brazil 12247-016
3
Universidade Federal de Pelotas – UFPel
Campus Universitário, Caixa postal 354, 96001-970, Capão do Leão - RS, Brazil
4
Institute of Surveying, Remote Sensing and Land Information (IVFL)
University of Natural Resources and Life Sciences (BOKU), Peter Jordan Str. 82, Vienna, Austria
5
Empresa Brasileira de Pesquisa Agropecuária – EMBRAPA Meio Ambiente,
Rodovia SP 340 - Km 127.5, Caixa postal 69, Jaguariúna - SP, Brazil, 13820-000
ABSTRACT
1. INTRODUCTION
Cloud cover is the main issue to consider when remote
sensing images are used to identify, map and monitor
croplands, especially over the summer season (October to
March in Brazi). This paper aims at evaluating clear sky
conditions over four Brazilian states (São Paulo, Paraná,
Santa Catarina, and Rio Grande do Sul) to assess suitable
observation conditions for a monthly basis operational crop
monitoring system. Cloudiness was analyzed using MODIS
Cloud Mask product (MOD35), which presents four labels
for cloud cover status: cloudy, uncertainty, probably clear
and confident clear. R software was used to compute average
values of clear sky with a confidence interval of 95% for each
month between July 1st, 2000 and June 30th, 2013. Results
showed significant differences within and between the four
tested states. Moreover, the period from November to March
presented 50% less clear sky areas when compared to April
to October.
Brazil plays an important role in the agricultural production
worldwide. Cropped area of soybean, corn, and sugarcane,
was about 27.7, 15.9, and 8.7 million hectares in crop season
2012/2013 [1]. Approximately 40% of their area is in the
states of São Paulo (SP), Paraná (PR), Santa Catarina (SC)
and Rio Grande do Sul (RS) [1]. Because of the wide area and
the small period of crop vegetation, remote sensing
technologies present great potential to be used for operational
crop monitoring systems.
Indeed, Landsat-like images have been shown capability
for crop acreage estimation over large areas [2, 3], but cloudfree images acquired during key periods within the crop
calendar is required. Provision of cloud free image makes
satellite-based agriculture monitoring at regional to national
scale a big challenge [3, 4, 5].
To develop a consistent, systematic and continuous
acreage estimation system using remote sensing it is
necessary to assess suitable observation conditions to
quantify clear sky trend through space and time. Several
studies claim that cloud cover is an important issue in the use
of satellite images [3, 4, 5], but few ones quantified their clear
Index Terms— Cloud cover, Brazilian agriculture,
MODIS, acreage estimation
978-1-4799-5775-0/14/$31.00 ©2014 IEEE
2126
IGARSS 2014
sky areas [4]. The aim of this study is to evaluate monthly
clear sky (i.e., cloud free) area available in the States of SP,
PR, SC, and RS over the last 13 years (2000 to 2013) based
on almost-daily coverage images from MODIS sensor.
2. MATERIAL AND METHODS
The study area is located between latitudes South 19º 42’ and
33º 48’ and longitudes West 44º and 57º 41’ and comprises
four Brazilian states: SP, PR, SC, and RS. These states are
divided into 38 mesoregions delimited by: a) social process
determinant; b) natural resources as conditionant and social;
and c) physical network, by the Brazilian Institute of
Geography and Statistics (IBGE) [6].
The MODIS Cloud Mask product is at the level two (L2)
of processing in the Earth Observation System program
(EOS), and two files are necessary for its: one containing the
values of cloud cover (MOD35) and one containing
geolocation fields for each cloud cover image (MOD03) [7].
The MOD35 is produced by probabilistic algorithms that use
22 out of the 36 MODIS wavebands to define cloud presence
at pixel level [7], in 1 km of spatial resolution. This MODIS
product has four labels representing distinct cloud cover
conditions registered: cloudy (<60% confidence interval),
uncertain (60 to 95%), probably clear (>95 to 99%) and
confident clear (>99%) [7]. The MOD35 product are
composed by five bytes were bits 1 and 2 of byte 0 show the
value of cloud cover for each MODIS pixel [7]. We acquired
15,321 images (parts of region of interest) for each MODIS
product to compose 4,748 daily images of the Cloud Mask
product (MOD35) available from July 1 st 2000 to June 31th
2013 (13 crop seasons).
The first step of data processing was to extract the images
from HDF to GEOTIFF format using Reprojection MODIS
Swath Tool. In the next step, the R software was used [8]
(mainly packages modiscloud [9] and raster [10]) to extract
first and second bits of each daily image we analyzed. This
process uses the function get_bitgrid_2bits in modiscloud
package, which returns the two chosen bits [9]. A mosaic with
cloud-cover labels was created using the mosaic function of
the raster package [10] by mosaicking all daily images
portions available for each day. The process to compute
values of clear sky was performed using the aggregate
function of raster package to obtain the values for the four
classes of cloud mask product present in each date for each
state or mesoregion. The four original classes defined in the
cloud mask product were regrouped in two new classes: clear
sky (confident clear) and cloud (probably clear + uncertain
+ cloudy). The clear sky calculation was performed by the
proportion of classes regarding either state or mesoregion
level. In order to identify space as well as temporal variation
of clear sky conditions we calculated the percentage of clear
sky for each state and mesoregion at daily basis. Using these
values we aggregated clear sky values considering two
periods: global (over all 13 crop seasons), and monthly (by
grouping every month along all the 13 crop seasons). In both
cases, we calculated the average and confidence interval (CI)
with 5% of significance, for each state and mesoregion. The
data analysis at the two different scales (state and
mesoregion) was chosen because for an agricultural
monitoring system it is necessary to evaluate the differences
inter (states) and intra (mesoregions) states.
3. RESULTS AND DISCUSSION
The state analysis showed that averaged clear sky values for
all states were less than 40% with CI of approximately ± 1%
(Fig.1). The monthly analyses showed a seasonality of clear
sky for SP and PR (Fig. 1). In these states, the value of clear
sky is lower than in RS and SC from November to February,
which is a key periods to identify soybean and corn. For PR
our result was similar to that reported by Sugawara et al. [3],
who analyzed Landsat images over seven crop seasons. This
jeopardizes the mapping or acreage estimation based on
remote sensing images, using traditional remote sensing
techniques (i. e. visual interpretation of wide regions like a
state).
On the other hand, the average values of clear sky in SC
and RS were similar along time. In general, the CI and
variance were similar for all months for all states (around
±4%) (Fig. 1). However, the low values of clear sky in images
are probably insufficient to map the entire state area in a two
month interval (Fig. 1).
The mesoregion analysis showed similar trend when
compared to the state scale for SP and PR. In mesoregion
level the seasonality of clear sky is concentrated in April to
September (Fig. 2). This period is crucial to map sugarcane,
which is the main crop in SP and in the north portion of PR.
On other hand, the same mesoregions show small values of
clear sky over the summer crops period (September to March)
(Fig. 2). Between November and January, the clear sky values
are less than 20% for important mesoregions in SP state, like
Assis, which has great producer of soybean and corn in SP
state (Fig. 2).
For the same region, mapping summer crops such as
soybean and corn requires images acquired during January
and March, when clear sky values are small for all crop
season [3, 4] (Fig. 2). The mesoregion analysis showed that
along the coast clear sky values are similar throughout year.
For SC and RS, the average value of clear sky is larger than
PR and SP, but not greater than 55%, for example, in Litoral
Sul Paulista and Metropolitana de Curitiba (Fig. 2).
2127
Fig. 1. Average and CI values of clear sky for SP, PR, SC and RS states.
The CI in mesoregion level for all states is similar, with
greater values of ± 4% around the average. During the
safrinha (i.e., second crop within the same crop year), which
begins around March in SP and PR, the values of clear sky
are larger and gradually rise up to September, which increases
the possibility of successful crop monitoring in this period
(Fig. 2).
Our results emphasize the difficult to map wide regions
(state) using satellite images such as Landsat-like. Especially
over summer crop season (November to March) which
demands cloud-free images acquired during a short period
when clear sky values area low. Thus, to overcome this issue
a sample probabilistic method can be apply since it does not
require an entire cloud-free image to retrieve the acreage
estimation.
Fig. 2. Average and CI values of clear sky for all mesoregions of SP, PR, SC, and RS states.
2128
4. CONCLUSIONS
Our analysis reveals that for the two summer crops analyzed
(i.e. soybean and corn in first cropseason) and the beginning
of safrinha the values of clear sky (and so the possibility of
mapping this crops for all extension of states) are very small.
This cloud coverage jeopardizes acreage estimation for
summer crops using traditional remote sensing approaches
over wide regions (map all region using Landsat-like
images). On the other hand, the mapping of sugarcane should
be easier since this crop tends to stay longer in the field, and
over the months with higher clear sky values (April and
September).
Cloud cover may seriously limit an operational program
of crop monitoring based on mapping remote sensing images
as source of information, especially for monthly acreage
estimates of summer crops over large areas.
ACKNOWLEDGEMENTS
We thank the Brazilian Research Council CAPES
(Coordenação Coordenação de Aperfeiçoamento de Pessoal
de Nível Superior – 402597/2012-5, 33010013005P0) for
financial support.
This research has been conducted under a cooperative
project between Brazil’s National Institute for Space
Research (INPE) and the University of Natural Resources and
Life Sciences (BOKU), in Vienna, Austria, in which the
second author was a postdoctoral research fellow. Currently,
the second author has joined Boeing Research & Technology
– Brazil (BR&TB), and kindly acknowledges the opportunity
to work on this subject within BR&TB.
5. REFERENCES
[1] IBGE - Instituto Brasileiro de Geografia e Estatística.
Levantamento sistemático da produção agrícola. Junho,
2013.
Available
in:<
http://www.ibge.gov.br/home/estatistica/indicadores/agrope
cuaria/lspa/lspa_201306.pdf>. Access in: 10 Jan. 2014.
[3] Sugawara, L. M., Rudorff, B. F. T., Adami, M.
Viabilidade de uso de imagens do Landsat em mapeamento
de área cultivada com soja no Estado do PR. Pesq. Agropec.
Bras., Brasília, v.43, n.12, p.1777-1783, Dec. 2008.
[4] Asner, G. P. Cloud cover in Landsat observations of the
Brazilian Amazon. International Journal of Remote Sensing,
vol. 22, no. 18, 3855–3862, 2001.
[5] Wilson, A. M., Parmentier, B., Jetz, W. Systematic land
cover bias in Collection 5 MODIS cloud mask and derived
products — A global overview. Remote Sensing of
Environment, n.141, p.149-154, 2014.
[6] IBGE - Instituto Brasileiro de Geografia e Estatística.
Divisão do Brasil em Mesorregiões e Microrregiões
Geográficas. Rio de Janeiro, 1990.
Available in:<
http://biblioteca.ibge.gov.br/visualizacao/monografias/GEBI
S%20-%20RJ/DRB/Divisao%20regional_v01.pdf >. Access
in: 12 Dec. 2013.
[7] Ackerman, S., Frey, R., Strabala, K., Liu, Y. Gumley, L.
Baum, B., Menzel, P. Discriminating clear-sky from cloud
with MODIS algorithm theoretical basis document
(MOD35). Cooperative Institute for Meteorological Satellite
Studies, University of Wisconsin – Madison, V. 6.1, 2010.
[8] R Development Core Team, R: A Language and
Environment for Statistical Computing, R Foundation for
Statistical Computing, Vienna, Austria, 2014.
[9] Matzke, N. J. (2013). Modiscloud: An R Package for
processing MODIS Level 2 Cloud Mask products. University
of California, Berkeley, Berkeley, CA. Ecology Letters, 16
(3), 307-314. doi: 10.1111/ele.12039. Available in:
<http://cran.r-project.org/web/packages/modiscloud/
index.html>. Access in: 10 Dec. 2013.
[10] Hijmans, R. J. Raster: Geographic data analysis and
modeling. R package version 2.1-49. Available in:
<http://CRAN.R-project.org/package=raster>. Access in: 10
Dec. 2013.
[2] Rizzi, R., Rudorff, B. F. T. Estimativa da área de soja no
RS por meio de imagens Landsat. Revista Brasileira de
Cartografia, v.57, p.226-234, 2005.
2129
Baixar