1H2014
REPORT
PAGE 2
1H2014 REPORT
MANAGEMENT
REPORT
PAGE 4
1H2014 REPORT
01
Martifer Group
01 | MARTIFER GROUP
HIGHLIGHTS
Total Revenues in the 6M14 of 167 M€ (299 M€ in the 6M13)
Consolidated Net Profit of -38 M€, which compares with -49 M€ in the 6M13
Total Order book of 543 M€: Metallic Construction (316 M€) and Solar (227 M€)
Total Consolidated Net Debt of 351 M€ (336 M€ FY13)
Martifer Metallic Constructions increases equity in 28 million euros
MAIN FINANCIAL INDICATORS
M€
Revenues
EBITDA
EBITDA margin
Jun-14
Jun-13
Var. (%)
167.0
298.8
-44%
-3.3
2.3
n.m.
-2.8 pp
-2%
1%
EBIT
-22.3
-27.4
19%
EBIT margin
-13%
-9%
-4.1 pp
Financial Results
-14.0
-19.4
28%
Profit before taxes
-36.2
-46.8
23%
-2.0
-1.8
-11%
-38.3
-48.7
21%
-7.8
1.5
n.m.
-30.5
-50.1
39%
-0.312
-0.512
39%
Income tax
Net Profit
Attributable to non-controlling interests
Attributable to Group
per share €
PAGE 6
1H2014 REPORT
MAIN EVENTS
JANUARY 2014
West Sea signs contract for the Sub-concession of Estaleiros Navais de Viana do Castelo
Following an international public tender, Martifer Energy Systems and Navalria, subsidiaries of the Martifer Group, were awarded
with the sub-concession for “private use of public domain and of the areas allocated to the dominial concession” attributed to the
company Estaleiros Navais de Viana do Castelo (ENVC).
Martifer Group, via its new subsidiary West Sea – Estaleiros Navais, Lda., aims to develop its activity in the national and international
markets and implement, in the areas included in the ENVC sub-concession, a shipbuilding and repair project, which is expected to
create 400 new work places throughout the next three years. With this sub-concession, Martifer Group increases its capacity for the
shipbuilding and repair. The contract was signed in January 2014.
Martifer Solar USA INC and Martifer Aurora LLC begin the voluntary process for Chapter 11
On 21 January 2014 the affiliates Martifer Solar USA INC and Martifer Aurora Solar LLC started voluntary restructuring processes under
Chapter 11 (US Bankruptcy Code).
FEBRUARY 2014
Martifer Renewables concludes the sale of Rosa dos Ventos
On 27 of February, Martifer Renewables has concluded, through its subsidiary Martifer Renováveis Geração de Energia e
Participações, S.A., controlled at 55%, the sale of 100% shares in the company Rosa dos Ventos Geração e Comercialização de
Energia, by the $R70.3m total amount to the Brazilian company CPFL. Rosa dos Ventos Geração e Comercialização de Energia
SA owns the wind farm with 14.7 MW of energy capacity. The sale agreement by both entities has been established on 18 June
2013.
MARCH 2014
Martifer concludes two new ships for Douro Azul
Navalria, Martifer‘s subsidiary, concluded, in March, the construction of the two hotel ships Viking Hemming and Viking Torgil, for
the company Douro Azul.
The ships, which will operate cruises in the Douro River, were built in one year and have a distinctive feature: a round shaped bow
that allows the creation of an exterior deck with capacity for 42 passengers.
Martifer Metallic Constructions restructures debt
Martifer Metallic Constructions completed the conversion of part of its debt from short term to medium and long term.
1H2014 REPORT
PAGE 7
APRIL 2014
Martifer Metallic Constructions increases equity
Martifer Metallic Constructions increased, via Martifer SGPS’ main shareholders, its equity in around 28 million euros.
Martifer Solar and Adenium Energy Capital awarded PPA for 10 MW PV plant in Jordan
Martifer Solar and Adenium Energy Capital were awarded a Power Purchase Agreement (PPA) with the national utility of Jordan,
NEPCO (National Electric Power Company) for a 10 MW AC solar PV plant.
Martifer Solar has been selected as the lead developer and will provide engineering, procurement and construction (EPC) services.
Following the connection of the plant, Martifer Solar will be responsible for the related operations and maintenance (O&M) service.
The project will be developed with Adenium Energy, which will finance it in around USD$ 26 million.
Martifer Solar concludes the construction of a 78.4 MW PV portfolio for Lightsource
Renewable Energy in the UK
Martifer Solar concluded a 78.4 MW portfolio of photovoltaic plants in the United Kingdom. The utility-scale combined capacity
consists of five plants, which are located in the counties of Cambridgeshire, Devon, Nottingham and Swindon, and was built for
Lightsource Renewable Energy.
Martifer SGPS, S.A. Annual General Meeting
On 28 April 2014, Martifer SGPS, S.A. Annual meeting took place, with a participation of 79.85 % of its total share capital, having all
the proposals in the Agenda present in the Call Notice been approved by unanimity.
MAY 2014
WEST SEA takes possession of the Establishment of the Sub-concession
On 2 May 2014, the company West Sea - Estaleiros Navais, Lda, a part of the Martifer Group, took possession of the Subconcession, following the “Sub-concession for private use of public domain and of the areas allocated to the dominial concession”
attributed to the company Estaleiros Navais de Viana do Castelo (ENVC).
JUNE 2014
Martifer Renewables signs conditional sale agreement of the Gizalki wind farm to the Ikea
Group
A conditional sale agreement was celebrated, in which the IKEA Group will finance the development of the Gizalki wind farm (36
MW), in Poland, which is ready to build. The sale of the Gizalki project will only be concluded after its construction and connection
to the grid. The sale of these assets is included in the asset rotation policy, implemented by Martifer Renewables’ management
team, RE Developer business area of the Martifer Group.
PAGE 8
1H2014 REPORT
MAIN SUBSEQUENT EVENTS
JULY 2014
Most of assets of Martifer Solar USA INC sold to BayWa
st
On 1 July, the development of the Chapter 11 process, initiated by Martifer Solar USA INC in January, led to the court of Nevada
to approve the sale of most assets of Martifer Solar USA, Inc. to the proponent BayWa by 7.6 million USD. The result of the sale is
framed with the book value of assets.
Martifer Solar prevails with 8 MW PV plant in Ukraine
Martifer Solar concluded a new 8 MW PV plant, named Shargorod, in the Vinnytsia region, in Ukraine.
Consortium Ventinveste incorporates Âncora Wind society to develop 171MW of wind
projects
In July 2014, the company Âncora Wind – Energia Eólica, S.A., aimed to establish the partnership between Ventinveste, S.A. and
Ferrostaal, GmbH for the development of wind projects with a total of 171 MW, included in the Ventinveste Consortium. The
construction should begin after the financial closing, which is expected by the end of 2014.
AUGUST 2014
Martifer SGPS agrees the transfer of its shareholding held in Nutre SGPS
rd
Martifer SGPS has decided, during the first semester of 2014, to sell the participation held in Nutre SGPS, SA. During the 3
quarter of 2014, following a proposal of investment presented by Orchadia, S.A. group, it was agreed the transference of the shares
held in Nutre SGPS, SA. The transfer is still subject to the accomplishment of several conditions (including, amongst others,
decisions of Public and Governmental Authorities). The amount of the transfer is in line with the value of the financial investment.
1H2014 REPORT
PAGE 9
PAGE 10
1H2014 REPORT
02
Financial
Performance
02 | FINANCIAL PERFORMANCE
RESULTS ANALYSIS
M€
Revenues
Jun-14
Jun-13
Var. (%)
-44%
167.0
298.8
EBITDA
-3.3
2.3
n.m.
EBITDA margin
-2%
1%
-2.8 pp
Depreciation & Amortization
-8.8
-8.7
-1%
Provisions & Impairment Losses
-10.2
-21.1
52%
EBIT
-22.3
-27.4
19%
EBIT margin
-13%
-9%
-4.1 pp
Financial Results
-14.0
-19.4
28%
Profit before taxes
-36.2
-46.8
23%
-2.0
-1.8
-11%
-38.3
-48.7
21%
-7.8
1.5
n.m.
-30.5
-50.1
39%
-0.312
-0.512
39%
Income tax
Net Profit
Attributable to non-controlling interests
Attributable to Group
per share €
TOTAL REVENUES
In the 6M14, total Revenues reached 167 million euros (299 million euros in the 6M13), 56 % regarding the Metallic construction
segment, 32 % from the Solar segment and the rest from the RE Developer segment.
REVENUES
Jun-14
Jun-13
€M
WEIGHT
€M
WEIGHT
VAR.%
167.0
100%
298.8
100%
-44%
Metallic Construction
94.3
56%
127.2
43%
-26%
Solar
53.5
32%
163.1
55%
-67%
RE Developer
19.4
12%
10.4
3%
85%
Others, Holding and Adjust.
-0.1
0%
-2.0
-1%
95%
Martifer Consolidated
PAGE 12
1H2014 REPORT
The Group maintained its internationalization strategy, with the revenues divided as shown below:
Europe Other Australia
0%
3%
Portugal
19%
America
18%
Asia
5%
Africa
9%
European
Union
46%
EBITDA AND NET PROFIT
In the 6M14, the negative EBITDA in the Metallic Construction (around 3 million euros) and Solar (12 million euros) segments was
almost totally compensated by the positive EBITDA in the RE Developer segment (11 million euros).
EBITDA
Martifer Consolidated
Metallic Construction
Solar
RE Developer
Others, Holding and Adjust.
Jun-14
Jun-13
€M
MARG.
€M
MARG.
VAR.%
-3.3
-2%
2.3
1%
n.m.
-2.8
-3%
-16.0
-13%
83%
-12.1
-23%
12.0
7%
n.m.
11.0
57%
6.3
60%
75%
0.6
0%
0.0
0%
n.m.
Consolidated Financial Results were negative in 14 million euros, showing an improvement when compared with the Financial
Results in the 6M13 (-19 million euros).
Consolidated Net Profit reached -38 million euros, showing a 21 % improvement YoY.
NET PROFIT
Jun-14
Jun-13
€M
WEIGHT
€M
WEIGHT
VAR.%
Martifer Consolidated
-38.3
100%
-48.7
100%
21%
Metallic Construction
-21.9
57%
-36.9
76%
41%
Solar
-16.9
44%
2.3
-5%
n.m.
5.6
-15%
1.7
-3%
>100%
-5.1
13%
-15.7
32%
67%
RE Developer
Others, Holding and Adjust.
1H2014 REPORT
PAGE 13
CAPEX
The amount of investment in fixed assets in the 6M14 was 9 million euros, mainly resulting from the investment in the Metallic
construction segment (8 million euros).
CAPEX 2007 – 1H2014 (M€)
213
122
102
61
46
57
10
9
CAPITAL STRUCTURE ANALYSIS
FINANCIAL POSITION
€M
Jun-14
Dec-13
Fixed Assets (including Goodwill)
232.6
230.0
1%
Other non current assets
147.2
164.9
-11%
Inventory and Receivables
304.8
322.9
-6%
Cash and cash equivalents
37.0
39.2
-6%
Non-current assets held for sale
31.1
30.8
1%
Total Assets
752.7
787.8
-4%
Group Equity
104.1
100.0
4%
18.6
39.7
-53%
Total Equity
122.7
139.7
-12%
Non-current debt and leasings
254.9
236.8
8%
Non-controlling interests
VAR. %
Other non-current liabilities
41.0
37.5
9%
Current debt and leasings
132.4
138.1
-4%
Other current liabilities
201.7
224.5
-10%
0.0
11.2
n.m.
630.0
648.1
-3%
Liabilities related with Non-current assets held for sale
Total Liabilities
PAGE 14
1H2014 REPORT
Total assets reached 753 million euros (788 million euros on 31 December 2013), with the non-current assets’ value totalling
380 million euros.
Equity on 30 June 2014 totalled 122 million euros, which compares with 140 million euros on 31 December 2013. The negative
trend results, mainly, from the period net profit, partially compensated by the equity increase in Martifer Metallic Constructions.
NET DEBT
The chart below shows the trend of the Net Debt by segment:
400
300
Metallic Construction
200
Solar
RE Developer
Holding
100
0
Net Debt
FY 2013
Net Debt
1Q2014
Net Debt
2Q2014
Note: Net Debt = Borrowings + Financial Leases (+/-) Derivatives – Cash and Cash Equivalents
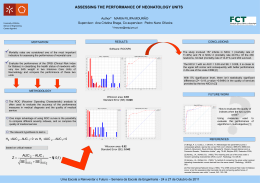
The Group’s Net Consolidated Debt at 30 June reached 351 million euros, 15 million euros above the value at the end of 2013 (336
million euros).
st
Despite this increase in the 1 half of 2014, the Group continues focused on reducing net debt, so it is committed to the non-core
asset sale process, especially of wind farms, solar projects and residually, from the sale of real estate projects.
1H2014 REPORT
PAGE 15
TREND OF CONSOLIDATED NET DEBT (2008 – 1H2014) - M€
600
500
485
444
377
400
321
330
2010
2011
330
351
300
200
100
0
2008
2009
2012
2013
2014
st
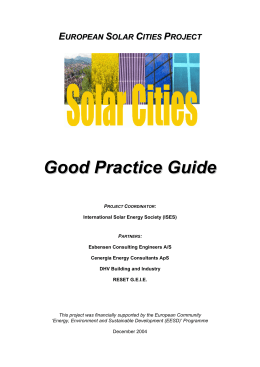
In the end of the 1 half of 2014, the M/L and Short Term debt structure was 68 % and 32 %, respectively (71 % and 29 % at the
end of 2013).
NET DEBT STRUCTURE – SHORT AND M/L TERM
Short Term
M/L Term
32%
68%
The M/L Term debt is almost totally (98 %) under a floating interest rate, like in the end of the last year.
PAGE 16
1H2014 REPORT
M/L TERM DEBT STRUCTURE – FIXED VS. FLOATING
Fixed - M/L Term
Floating - M/L Term
2%
98%
1H2014 REPORT
PAGE 17
PAGE 18
1H2014 REPORT
03
Analysis by
Segment
03 | ANALYSIS BY SEGMENT
METALLIC CONSTRUCTION
ACTIVITY
The order book at the end of the first half amounted 316 million euros and is spread throughout several companies in the various
geographical regions.
ORDER BOOK BY GEOGRAPHY
Africa
63
Western
Europe
148
Latin
America
71
Eastern
Europe and
Middle East
34
PAGE 20
1H2014 REPORT
RESULTS
€M
Jun-14
Jun-13
VAR. %
Revenues
94.3
127.2
-26%
EBITDA
-2.8
-16.0
83%
EBITDA margin
-3%
-13%
9.7 pp
Depreciation & Amortization
-3.4
-3.6
6%
Provisions & Impairment Losses
-8.0
-7.0
-14%
EBIT
-14.1
-26.6
47%
EBIT margin
-15%
-21%
5.9 pp
Financial Results
-7.6
-7.4
-3%
Profit before taxes
-21.8
-34.1
36%
-0.1
-2.9
96%
-21.9
-36.9
41%
0.1
0.1
-12%
-22.0
-37.1
41%
Income tax
Net Profit
Attributable to non-controlling interests
Attributable to Group
Revenues in the Metallic Construction area totalling 94 million euros (127 million euros in the 6M13) were affected, in the first half
2014, by the delay in some projects. This decrease affected negatively the performance in the period, namely EBITDA which,
nevertheless, presents an 83 % improvement when compared with 6M13, with the EBITDA Margin increasing 10 p.p. YoY.
Sales and services rendered in this segment continue focused in the external market, with Portugal representing only 15 % of the
total sales.
Europe - Other Australia
0%
0%
Portugal
15%
America
27%
Asia
7%
European
Union
36%
Africa
15%
EBITDA in the 6M14 was negative in only 3 million euros (16 million euros in the 6M13), reflecting an increase of around 83 % YoY.
Negative Financial Results of 7 million euros and Provision & Impairment Losses of 8 million euros decisively contribute to the
period Net Profit, which totalled -22 million euros (-37 million euros in the 6M13).
1H2014 REPORT
PAGE 21
Net Financial Debt in the Metallic Construction area at the end of the first half 2014 reaches 133 million euros (127 million euros at
the end of 2013).
Total Capex in the 6M14 was around 8 million euros, corresponding mainly to the investment being made by this segment in Brazil.
SOLAR
ACTIVITY
The backlog of turnkey projects (signed) is 227 million euros, with Europe and Asia representing 66 % of the total value.
Africa
19
Europe
70
America
58
Asia
80
PAGE 22
1H2014 REPORT
RESULTS
€M
Revenues
Jun-14
Jun-13
VAR.%
53.5
163.1
-67%
EBITDA
-12.1
12.0
n.m.
EBITDA margin
-23%
7%
-30.1 pp
Depreciation & Amortization
-1.3
-1.5
14%
Provisions & Impairment Losses
-1.4
-1.7
16%
EBIT
-14.8
8.9
n.m.
EBIT margin
-28%
5%
-33.2 pp
Financial Results
-1.9
-7.8
75%
Profit before taxes
-16.8
1.1
n.m.
-0.1
1.2
n.m.
-16.9
2.3
n.m.
-0.5
0.7
n.m.
-16.4
1.6
n.m.
Income tax
Net Profit
Attributable to non-controlling interests
Attributable to Group
Revenues in the 6M14 registered a 67 % decrease YoY, reaching 54 million euros, versus 163 million euros registered in the 6M13.
This decrease is the result of the delay in some projects, namely in the United Kingdom, Chile and Jordan.
The activity in this segment continues focused in the external market, which represents more than 70 % of the total sales, as can be
seen in the chart below.
Asia
3%
Africa
0%
America
4%
Europe Other
6%
Portugal
28%
European
Union
59%
EBITDA in the 6M14 was negative in 12 million euros (positive 12 million euros in the 6M13), which represents a drop in the
EBITDA margin of 30 p.p. (from 7 % in the 6M13 to -23 % in the 6M14). For the negative performance significantly contributed the
1H2014 REPORT
PAGE 23
strong decrease in the activity level, consultancy and legal support costs supported in the USA within the recovery process of one
of its subsidiaries – Martifer Solar USA, INC, as well as additional costs in some projects.
Financial results in the 6M14 registered a 6 million euros improvement, reaching, at the end of the semester, -2 million euros (-8
million euros in the 6M13).
Net Profit in the period is negative in 17 million euros (positive in 2 million euros YoY).
Net Debt at the end of the 6M14 reaches 61 million euros, 10 million euros above the value at the end of 2013.
RE DEVELOPER
ACTIVITY
Martifer Renewables has currently 80 MW of wind farms in operation, from which 49 MW with contribution to revenues. The
revenues from the wind farms in Portugal, with a 31 MW capacity, by being held at 50 %, contribute to the results through equity
method.
RESULTS
€M
Revenues
Jun-14
Jun-13
VAR.%
19.4
10.4
85%
EBITDA
11.0
6.3
75%
EBITDA margin
57%
60%
-3.5 pp
Depreciation & Amortization
-3.3
-2.6
-25%
Provisions & Impairment Losses
-0.8
-12.4
94%
6.9
-8.7
n.m.
36%
-84%
119.4 pp
Financial Results
0.5
10.5
-95%
Profit before taxes
7.4
1.8
>100%
-1.8
-0.1
<-100%
5.6
1.7
>100%
Attributable to non-controlling interests
3.1
-0.2
n.m.
Attributable to Group
2.4
1.9
31%
EBIT
EBIT margin
Income tax
Net Profit
Total Revenues of the RE Developer in the 6M14 reached 19 million euros (10 million euros in the 6M13), influenced not only by
the wind farms and solar parks in operation in the period, totalling 49 MW, but also by the sale of wind farms in Brazil.
EBITDA reached 11 million euros in the 6M14 (6 million euros YoY).
Net Profit at the end of 6M14 was positive in 6 million euros, when in the 6M13, Martifer Renewables registered a Net Profit of
around 2 million euros.
Net Debt at the end of the 6M14 was 9 million euros (13 million euros at the end of 2013).
PAGE 24
1H2014 REPORT
04
Share Price
Performance
04 | SHARE PRICE PERFORMANCE
SHARE PRICE TREND
180
160
140
120
100
80
60
Martifer
PSI 20
40
20
0
Source: Reuters
TRADED VOLUME (‘000 shares)
1400
1200
1000
800
600
400
200
0
Source: Reuters
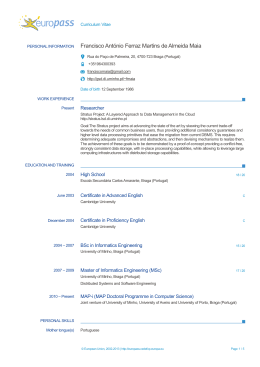
At the end of the 6M14, Martifer shares dropped around 18.98 % with the PSI-20, Euronext Lisbon’s main index, increasing
approximately 3.7 % when compared with the end of 2013. Martifer’s share price closed the 6M14 at 0.559 €/share. The maximum price
achieved was 1.20 €/share and minimum 0.534 €/share.
The average volume of stocks traded daily during the 6M14 was 73,828 shares (27,799 YoY).
Martifer’s market value at 30 June 2014 was 55 million euros..
PAGE 26
1H2014 REPORT
05
Future Prospects
05 | FUTURE PROSPECTS
The Group keeps its focus on the goals defined for 2014:
Decrease of the debt through the sale of non core assets
Increase in operational efficiency
Growth in the order book, leveraged by the creation of partnerships
Strengthening of the capital structure
The Board believes that the results of these goals will be visible in the second half of 2014, despite all adversities Martifer has been
facing.
Oliveira de Frades, 27 August 2014
The Board of Directors,
Carlos Manuel Marques Martins
(Chairman of the Board of Directors)
Jorge Alberto Marques Martins
(Vice-Chairman of the Board of Directors)
Mário Rui Rodrigues Matias
(Member of the Board of Directors)
Luís Filipe Cardoso da Silva
(Member of the Board of Directors)
Arnaldo José Nunes da Costa Figueiredo
(Member of the Board of Directors)
Jorge Bento Ribeiro Barbosa Farinha
(Member of the Board of Directors)
Luís Valadares Tavares
(Member of the Board of Directors)
PAGE 28
1H2014 REPORT
MANDATORY
INFORMATION
MANDATORY INFORMATION
SHAREHOLDINGS OF THE MEMBERS OF THE MANAGEMENT AND
SUPERVISORY BODIES
In accordance with articles 447 and 448 of the Portuguese Companies Code, the securities issued by Martifer SGPS, SA and
companies dominated by it, held by members of the governing bodies in the period from 1 January 2014 through to 30 June 2014,
are the following:
HOLDER
GOVERNING BODY
NUMBER OF SHARES HELD
ON 30/06/2014
Carlos Manuel Marques Martins
Board of Directors
Jorge Alberto Marques Martins
Board of Directors
230,260
I’M – SGPS, S.A. *
Board of Directors
42,697,047
Arnaldo José Nunes da Costa Figueiredo
Board of Directors
3,000
Luís Filipe Cardoso da Silva
Board of Directors
2,000
MOTA-ENGIL, SGPS, S.A. **
Board of Directors
37,500,000
Luís Valadares Tavares
Board of Directors
-
Jorge Bento Ribeiro Barbosa Farinha
Board of Directors
-
Mário Rui Rodrigues Matias
Board of Directors
-
Manuel Simões de Carvalho e Silva
Supervisory Board
-
Carlos Alberto da Silva e Cunha
Supervisory Board
-
João Carlos Tavares Ferreira de Carreto Lages
Supervisory Board
-
Statutory Auditor, representing
PricewaterhouseCoopers
-
Chairman of the General Meeting
-
Hermínio António Paulos Afonso
José Carreto Lages
70,030
* Directors Carlos Manuel Marques Martins and Jorge Alberto Marques Martins are holders of the share capital of I’M SGPS, SA and are, respectively, its
Chairman of the Board of Directors and Director.
** Directors Arnaldo José Nunes da Costa Figueiredo and Luís Filipe Cardoso are Directors of MOTA-ENGIL, SGPS, S.A.
PAGE 30
1H2014 REPORT
EVENTS DESCRIBED IN ARTICLE 447 OF THE PORTUGUESE COMPANIES
CODE
NAME OF THE MEMBER
OF THE GOVERNING BODY
GOVERNING BODY
SHARES HELD
AT 30/06/2014
Carlos Manuel Marques Martins
Board of Directors
70,030
Jorge Alberto Marques Martins
Board of Directors
230,260
Mário Rui Rodrigues Matias
Board of Directors
-
Arnaldo Nunes da Costa Figueiredo
Board of Directors
3,000
Luís Filipe Cardoso da Silva
Board of Directors
2,000
Luis António de Valadares Tavares
Board of Directors
-
Jorge Bento Ribeiro Barbosa Farinha
Board of Directors
-
Manuel Simões de Carvalho e Silva
Supervisory Board
-
Carlos Alberto da Silva e Cunha
Supervisory Board
-
João Carlos Ferreira de Carreto Lages
Supervisory Board
-
Juvenal Pessoa Miranda
Supervisory Board
-
Directors Carlos Manuel Marques Martins and Jorge Alberto Marques Martins, respectively Chairman and Vice-Chairman of the
Board of Directors, besides the shares held as described above, are sole equal shareholders of I’M SGPS, SA, that, on 30 June
2014, held a total of 42,697,047 shares of Martifer SGPS, S.A.
During 2013, there were no share transactions by the members of the governing bodies.
1H2014 REPORT
PAGE 31
HOLDERS OF QUALIFYING SHAREHOLDINGS
According to paragraph 1b) of article 8 of CMVM regulation number 5/2008, and fulfilling article 448 of the Portuguese Companies
Code, the following is the list of qualifying shareholders, with an indication of number of shares and percentage of voting rights held,
calculated according to article 20 of the Securities Code (CMVM), as of 30 June 2014:
SHAREHOLDERS
% OF SHARE CAPITAL
42,697,047
42.70%
43.66%
Carlos Manuel Marques Martins*
70,030
0.07%
0.07%
Jorge Alberto Marques Martins*
230,260
0.23%
0.24%
Total Imputable to I’M – SGPS, SA
42,997,337
43.00%
43.97%
Mota-Engil – SGPS, SA
37,500,000
37.50%
38.35%
Arnaldo José Nunes da Costa Figueiredo **
3,000
0.00%
0.00%
Luís Filipe Cardoso da Silva **
2,000
0.00%
0.00%
37,505,000
37.51%
38.35%
I’M – SGPS, SA
Total Imputable to Mota-Engil , SGPS, SA
1
% OF VOTING RIGHTS1
NR. OF SHARES
% Voting rights = Number shares / (Nr. Total shares – Own shares)
* Holder of a position in the Governing Bodies of I’M SGPS, SA
** Holder of a position in the Governing Bodies of Mota-Engil SGPS, SA
PAGE 32
1H2014 REPORT
STATEMENT OF COMPLIANCE ACCORDING TO ARTICLE 245, NUMBER 1, PARAGRAPH C)
OF THE SECURITIES CODE (CMVM)
Dear Shareholders,
According to article 245, number 1, paragraph c) of the Securities Code (CMVM) and to the best of our knowledge:
(i) The information contained in the consolidated management report faithfully reports the evolution of trading, the performance and
the position of Martifer SGPS SA and of the companies in its consolidation perimeter and contains a description of the main risks
and uncertainties facing its business; and
(ii) The information contained in its financial statements and accompanying notes, was prepared in accordance with the applicable
accounting practices, giving a true and fair view of the assets, liabilities, financial position and financial results of Martifer SGPS SA,
and of the companies included in its consolidation perimeter.
Oliveira de Frades, 27 August 2014
The Board of Directors,
Carlos Manuel Marques Martins
(Chairman of the Board of Directors)
Jorge Alberto Marques Martins
(Vice-Chairman of the Board of Directors)
Mário Rui Rodrigues Matias
(Member of the Board of Directors)
Luís Filipe Cardoso da Silva
(Member of the Board of Directors)
Arnaldo José Nunes da Costa Figueiredo
(Member of the Board of Directors)
Jorge Bento Ribeiro Barbosa Farinha
(Member of the Board of Directors)
Luís Valadares Tavares
(Member of the Board of Directors)
1H2014 REPORT
PAGE 33
PAGE 34
1H2014 REPORT
INTERIM
CONSOLIDATED
FINANCIAL
INFORMATION
PAGE 36
1H2014 REPORT
05
Interim
Consolidated
Financial
Statements
05 | INTERIM CONSOLIDATED FINANCIAL STATEMENTS
CONSOLIDATED INCOME STATEMENTS FOR THE 1ST HALF OF 2014 AND 2013 AND FOR
THE QUARTERS ENDED 30 JUNE 2014 AND 2013
(amounts expressed in Euros)
(Translation of consolidated financial statements originally issued in Portuguese - note 31)
Sales and services rendered
Other income
Cost of goods sold
Subcontractors
External supplies and services
Staff costs
Other operational gains and losses
Amortizations
Provisions
Impairment losses
Operating income
Financial income
Financial expenses
Gains / (losses) on associated companies and joint
arrangements
Profit before tax
Income tax
Profit after tax
1ST HALF 2013
(NON AUDITED)
QUARTER
2014
(NON AUDITED)
QUARTER
2013
(NON AUDITED)
3 and 4
143,461,797
273,377,531
57,464,632
147,097,541
5
6
7
8
9
10
23,571,042
(50,634,414)
(33,019,585)
(40,122,068)
(37,612,735)
(8,960,293)
(3,316,256)
(8,794,377)
(9,521,389)
(636,336)
(22,268,358)
4,062,087
(17,898,878)
25,372,833
(114,819,995)
(74,852,709)
(51,306,568)
(41,042,507)
(14,424,958)
2,303,627
(8,700,091)
(3,404,563)
(17,648,186)
(27,449,213)
16,844,786
(26,309,743)
16,936,498
(19,112,642)
(13,402,623)
(21,048,265)
(18,631,878)
(5,453,536)
(3,247,814)
(4,323,855)
(9,517,194)
(597,644)
(17,686,507)
1,875,836
(8,441,090)
18,641,532
(66,489,713)
(36,596,908)
(33,907,098)
(20,471,830)
(8,591,419)
(317,895)
(4,237,236)
(3,007,947)
(17,027,118)
(24,590,196)
13,176,807
(15,214,931)
3
11
11
12
12
Earnings per share:
Basic
from continuing operations
from Non-current assets held for sale
Diluted
from continuing operations
from Non-current assets held for sale
2
ND
1ST HALF 2014
(NON AUDITED)
2
13
(126,853)
(9,932,462)
(551,059)
(6,171,192)
14
(36,232,002)
(2,032,890)
(38,264,893)
(46,846,632)
(1,830,432)
(48,677,064)
(24,802,820)
(1,069,368)
(25,872,188)
(32,799,512)
(1,852,121)
(34,651,633)
-
-
-
(158,086)
(38,264,893)
(48,677,064)
(25,872,188)
(158,086)
(34,809,718)
21
(7,773,650)
(30,491,243)
1,469,861
(50,146,924)
(5,710,303)
(20,161,887)
1,182,038
(35,991,755)
15
(0.3118)
(0.3118)
(0.3118)
(0.3118)
-
(0.5128)
(0.5128)
(0.5128)
(0.5128)
-
(0.2063)
(0.2063)
(0.2063)
(0.2063)
-
(0.3681)
(0.3665)
(0.0016)
(0.3681)
(0.3665)
(0.0016)
Earnings of Non-current assets held for sale
Attributable to:
non-controlling interests
owners of Martifer
Profit for the year
Attributable to:
non-controlling interests
owners of Martifer
ND
NOTES
15
The accompanying notes are part of these financial statements
PAGE 38
1H2014 REPORT
CONSOLIDATED STATEMENTS OF COMPREHENSIVE INCOME FOR THE 1ST HALF OF 2014
AND 2013 AND FOR THE QUARTERS ENDED 30 JUNE 2014 AND 2013
(amounts expressed in Euros)
(Translation of consolidated financial statements originally issued in Portuguese - note 31)
ND
1ST HALF 2013
(NON AUDITED)
QUARTER
2014
(NON AUDITED)
QUARTER
2013
(NON AUDITED)
(38,264,893)
(454,247)
(48,677,064)
911,827
(25,872,189)
(298,135)
(34,809,718)
418,737
5,100,294
(5,405,629)
5,151,583
(5,307,545)
4,646,047
(4,493,801)
4,853,448
(4,888,807)
Total comprehensive income for the period
(33,618,846)
(53,170,866)
(21,018,741)
(39,698,526)
Attributable to:
non-controlling interests
owners of Martifer
(6,660,655)
(26,958,191)
963,854
(54,134,720)
(4,473,350)
(16,545,391)
615,372
(40,313,898)
Profit for the year
Fair value of cash flow hedges (derivatives), net of tax
Exchange differences arising on (i) translating foreign operations; (ii) net
investment in subsidiaries and (iii) goodwill
Income recognized directly in equity
2
ND
1ST HALF 2014
(NON AUDITED)
2
The accompanying notes are part of these financial statements
1H 2014 REPORT
PAGE 39
CONSOLIDATED STATEMENTS OF FINANCIAL POSITION AT 30 JUNE 2014 AND 31
DECEMBER 2013
(amounts expressed in Euros)
(Translation of consolidated financial statements originally issued in Portuguese - note 31)
30 JUNE 2014
(NON AUDITED)
31 DECEMBER
2013
(AUDITED)
12,912,935
6,203,192
213,437,695
16,232,578
40,184,893
1,899,749
73,153,342
15,772,249
379,796,633
12,909,431
7,503,472
209,544,798
16,195,865
41,282,069
575,621
92,479,001
14,360,132
394,850,389
23,290,186
105,428,030
68,226,301
1,706,482
15,962,728
90,229,711
36,984,807
1,561
31,062,427
372,892,233
26,515,807
121,615,674
51,455,759
1,779,777
17,396,316
104,115,097
38,843,709
388,468
30,812,048
392,922,655
752,688,866
787,773,044
50,000,000
186,500,000
(2,868,519)
(99,052,220)
(30,491,243)
104,088,018
18,629,578
122,717,596
50,000,000
186,500,000
(2,868,519)
(64,654,736)
(68,961,164)
100,015,581
36,784,990
2,891,441
139,692,012
241,234,522
13,657,603
16,363,257
22,482,987
2,150,889
295,889,258
222,842,770
13,917,683
13,725,090
22,326,882
1,494,669
274,307,094
Total liabilities
128,316,245
4,112,310
100,177,136
32,902,351
2,135,748
18,572,710
47,637,098
228,414
334,082,012
629,971,270
133,751,722
4,357,014
130,031,422
28,851,369
3,278,785
15,325,642
46,827,457
164,254
11,186,273
373,773,938
648,081,032
Total equity and liabilities
752,688,866
787,773,044
NOTES
ASSETS
Non-current assets
Goodwill
Intangible assets
Tangible assets
Investment property
Financial assets under the equity method
Available for sale investments
Other non-current receivables
Deferred tax assets
16
17
18
Current assets
Inventories
Trade receivables
Other receivables
Income tax
Current tax assets
Other current assets
Cash and cash equivalents
Derivatives
Non-current assets held for sale
18
18
19
20
Total assets
EQUITY
Issued capital
Share premium
Treasury stock
Reserves
Profit for the year
Equity attributable to owners of Martifer
Non-controlling interests
Non-controlling interests attributable to non-current assets held for sale
Total equity
LIABILITIES
Non-current liabilities
Borrowings
Obligation under finance leases
Other non-current liabilities
Provisions
Deferred tax liabilities
21
21
20
22
23
24
Current liabilities
Borrowings
Obligation under finance leases
Trade payables
Other payables
Income tax
Current tax liabilities
Other current liabilities
Derivatives
Liabilities related with Non-current assets held for sale
22
23
23
25
20
The accompanying notes are part of these financial statements
PAGE 40
1H2014 REPORT
CONSOLIDATED STATEMENTS OF CHANGES IN EQUITY FOR THE 1ST HALF OF 2014 AND 2013
(amounts expressed in Euros)
(Translation of consolidated financial statements originally issued in Portuguese - note 31)
FAIR VALUE
RESERVES
OTHER
RESERVES
NET PROFIT
OF THE
YEAR
EQUITY
ATTRIBUTABLE
TO OWNERS
OF THE
PARENT
NONCONTROLLING
INTERESTS
(18,903,670)
18,306,920
- (55,852,988)
(55,852,988)
55,852,988
176,279,311
-
50,975,912
-
227,255,223
-
-
(50,146,924)
(50,146,924)
1,469,861
(48,677,063)
(4,155,144)
-
-
(4,155,144)
(543,805)
(4,698,950)
(702,691)
-
-
(702,691)
(3,988)
(706,679)
870,041
-
-
-
870,041
41,786
911,827
870,041
(4,857,836)
-
(50,146,924)
(54,134,719)
963,854
(53,170,864)
-
-
-
375,785
-
375,785
282,426
658,211
(2,868,519)
(32,392)
(4,239)
(2,374,146)
(23,761,506) (39,548,667)
(50,146,924)
(4,239)
(2,374,146)
120,141,993
(74,149)
745,067
52,893,111
(78,387)
(1,629,078)
173,035,104
186,500,000
-
(2,868,519)
-
307,575
-
(21,990,557) (42,971,754)
- (68,961,164)
(68,961,164)
68,961,164
100,015,581
-
39,676,431
-
139,692,012
-
-
-
-
-
-
-
(30,491,243)
(30,491,243)
(7,773,650)
(38,264,893)
-
-
-
-
3,891,147
-
-
3,891,147
1,205,643
5,096,790
Exchange differences arising on goodwill
-
-
-
-
1,927
-
-
1,927
1,577
3,503
Other changes in equity of subsidiaries
-
-
-
(360,021)
-
-
-
(360,021)
(94,225)
(454,247)
Total comprehensive income for the year
-
-
-
(360,021)
3,893,074
-
(30,491,243)
(26,958,191)
(6,660,655)
(33,618,846)
Other changes in equity of subsidiaries
-
-
-
-
-
(4,652,795)
-
(4,652,795)
(3,839,021)
(8,491,816)
Changes in the consolidation perimeter
Non-controlling interests transactions
Balance at 30 June 2014
50,000,000
186,500,000
(2,868,519)
(52,447)
27,688
35,655,735
(18,097,483) (80,902,289)
(30,491,243)
27,688
35,655,735
104,088,019
(2,891,441)
(7,655,735)
18,629,578
(2,863,753)
28,000,000
122,717,596
FOREIGN
CURRENCY
TRANSLATION
RESERVES
ISSUED
CAPITAL
SHARE
PREMIUM
TREASURY
STOCK
50,000,000
-
186,500,000
-
(2,868,519)
-
(902,433)
-
-
-
-
-
-
-
-
-
-
Exchange differences arising on goodwill
-
-
-
-
Other changes in equity of subsidiaries
-
-
-
Total comprehensive income for the year
-
-
-
Other changes in equity of subsidiaries
-
-
Changes in the consolidation perimeter
Non-controlling interests transactions
Balance at 30 June 2013
50,000,000
186,500,000
Balance at 1 January 2014
Appropriation of the profit of 2013
50,000,000
-
Balance at 1 January 2013
Appropriation of the profit of 2012
Comprehensive income for the year:
Profit for the year
Exchange differences arising on (i) translating
foreign operations and (ii) net investment in
subsidiaries
Comprehensive income for the year:
Profit for the year
Exchange differences arising on (i) translating
foreign operations and (ii) net investment in
subsidiaries
CASH FLOW
EQUITY HEDGE
DERIVATIVES
TOTAL
EQUITY
The accompanying notes are part of these financial statements
1H 2014 REPORT
PAGE 41
CONSOLIDATED STATEMENTS OF CASH FLOWS FOR THE 1ST HALF OF 2014 AND 2013
AND FOR THE QUARTERS ENDED 30 JUNE 2014 AND 2013
(amounts expressed in Euros)
(Translation of consolidated financial statements originally issued in Portuguese - note 31)
ND
1 HALF 2013
(NON AUDITED)
QUARTER
2014
(NON AUDITED)
QUARTER
2013
(NON AUDITED)
218,973,731
(176,997,439)
(35,712,802)
6,263,490
(3,798,730)
(12,256,101)
(16,054,830)
(9,791,340)
328,373,592
(277,063,500)
(39,220,738)
12,089,354
435,409
(3,194,318)
(2,758,909)
9,330,445
85,076,197
(76,990,473)
(17,992,882)
(9,907,158)
(2,514,346)
(11,287,061)
(13,801,408)
(23,708,566)
174,116,025
(145,169,664)
(19,645,666)
9,300,695
(302,036)
(3,854,469)
(4,156,505)
5,144,190
278,195
711,122
8,412,934
134,173
461,505
3,068,550
13,066,479
6,619,520
134,427
1,182,660
1,648,406
95,690
9,680,703
278,195
465,277
5,816,951
128,668
106,939
2,712,755
9,508,784
6,481,740
132,263
398,917
991,477
33,831
8,038,228
(140,968)
(9,051,905)
(136,304)
(9,329,177)
3,737,302
(1,622,859)
(1,617,529)
(7,122,212)
(186,898)
(10,549,498)
(868,795)
49,423
(4,678,742)
143,265
(4,486,054)
5,022,730
(1,122,859)
(1.174.647)
(185,300)
(2,482,805)
5,555,423
259,116,058
285,753,308
140,596,300
194,221,241
15,000,000
-
15,000,000
-
1,459
274,117,517
1,382,244
287,135,552
(1,233,785)
154,362,515
877,920
195,099,161
(246,159,783)
(504,784)
(12,969,146)
(10,209,031)
(1,230,318)
(271,073,062)
3,044,455
(285,003,163)
(746,462)
(7,736,824)
(1,597,196)
(295,083,645)
(7,948,093)
(132,440,652)
(294,508)
(6,245,717)
(10,209,031)
178,845
(149,011,063)
5,351,452
(197,242,378)
(2,473,617)
(1,042,206)
(200,758,201)
(5,659,040)
(3,009,583)
788,435
362,246
38,843,709
36,984,807
513,557
(3,929,971)
(426,527)
38,024,569
34,181,628
(13,334,384)
788,435
(51,602)
49,582,358
36,984,807
5,040,573
(3,476,192)
(400,621)
33,017,868
34,181,628
ST
ST
2
ND
1 HALF 2014
(NON AUDITED)
2
OPERATING ACTIVITIES
Receipts from customers
Payments to suppliers
Payments to employees
Cash generated from operations
Income tax paid
Other receipts/(payments) relating to operating activities
Cash generated from other operating activities
Net cash generated by operating activities (1)
INVESTING ACTIVITIES
Receipts arising from:
Financial assets
Intangible assets
Tangible assets
Investment grants
Interest and similar income
Others
Payments arising from:
Financial assets
Intangible assets
Tangible assets
Others
Net cash generated by investing activities (2)
FINANCING ACTIVITIES
Receipts arising from:
Borrowings
Issue of equity shares, supplementary capital and share premiums
Others
Payments arising from:
Borrowings
Leasings
Interest and similar costs
Reduction of capital and other reserves
Others
Net cash generated by financing activities (3)
Net increase in cash and cash equivalents (4)=(1)+(2)+(3)
Changes in the consolidation perimeter and others
Effect of foreign exchange currencies
Cash and cash equivalents at the beginning of the period
Cash and cash equivalents at the end of the period
The accompanying notes are part of these financial statements
PAGE 42
1H2014 REPORT
06
Notes to Interim
Consolidated
Financial
Statements
06 | NOTES TO INTERIM CONSOLIDATED
FINANCIAL STATEMENTS
INTRODUCTORY NOTE
Martifer SGPS, S.A., with its head-office at Zona Industrial, Apartado 17, Oliveira de Frades – Portugal (‘Martifer SGPS’ or ‘the
Company’), and its group of companies (‘Group’), have as its main activity the construction of steel infrastructures and solar activity
- which focuses on the development of photovoltaic projects, the installation of turnkey photovoltaic parks or under the EPC and the
development of architectural integration projects and microgeneration. They also have other activities which highlight the promotion
and development of renewable energy projects (Note 3).
Martifer SGPS was incorporated on 29 October 2004, its share capital having been realized through the delivery of shares, valued
at its market value, that the shareholders held in Martifer - Construções, S.A., a company that was incorporated in 1990 and which,
at that time, was the holding company of the current Martifer Group.
As of June 2007, after the initial public offering Martifer SGPS, S.A. shares have been listed on Euronext Lisbon.
At 30 June 2014, the Group has developed its activity in Portugal, Spain, Slovakia, Romania, Czech Republic, Angola, Brazil, Greece,
United States of America, Mozambique, Ireland, Italy, Belgium, Bulgaria, Netherlands, France, Morocco, United Kingdom, Canada,
Mexico, Saudi Arabia, Germany, Chile, Ecuador, Ukraine, Turkey, Senegal, Singapore, India, Malta and Japan.
The accompanying notes were selected to help the understanding of the more significant changes in the financial position and the
financial performance of the Group since the last annual reporting, dated of 31 December 2013.
All the amounts presented in these notes are expressed in Euros (rounded at unit), unless otherwise stated.
These consolidated financial statements are not audited.
1. SIGNIFICANT ACCOUNTING POLICIES
BASIS OF PREPARATION
These accompanying consolidated financial statements relate to the consolidated financial statements of the Martifer Group and were
prepared in accordance with the International Financial Reporting Standards (“IFRS”), as adopted by the European Union, in force at
the beginning of the economic period started 1 January 2014. These are the International Financial Reporting Standards, issued by the
International Accounting Standards Board ("IASB"), and interpretations issued by the International Financial Reporting Interpretations
Committee ("IFRIC") or by the previous Standing Interpretations Committee ("SIC"), that have been endorsed by the European Union.
The interim consolidated financial report for the period ended at 30 June 2014 has been prepared in accordance with IAS 34 ‘Interim Financial Reporting’ as adopted by the European Union.
These consolidated financial statements have been prepared on a going concern basis from the books and accounting records of
the companies included in the consolidation (Note 2) and have been prepared under the historical cost convention, except for the
revaluation of certain financial instruments, which are stated at fair value.
The accounting policies adopted are consistent with those considered in the financial statements for the year ended as of 31
December 2013 and disclosed in the corresponding notes.
The following standards, interpretations, amendments and revisions endorsed by the European Union and with mandatory effects
from 31 December 2013, have been adopted for the first time in the current year:
PAGE 44
1H 2014 REPORT
EFFECTIVE DATE
IAS 32 – Financial Instruments: Presentation
01-01-14
IAS 36 – Impairment of Assets
01-01-14
IAS 39 – Financial Instruments: Recognition and Measurement
01-01-14
Changes in IFRS 10, 11 and IAS 27: Investment Entities
01-01-14
IFRS 10 – Consolidated Financial Statements
01-01-14
IFRS 11 – Joint Arrangements
01-01-14
IFRS 12 – Disclosure of Interests in Other Entities
01-01-14
Changes in IFRS 10, 11 and IAS 27: Transition
01-01-14
IAS 27 – Separate Financial Statements
01-01-14
IAS 28 – Investments in Associates
01-01-14
The amendments or new International Financial Reporting Standards (IFRS) and/or Interpretations issued or entering into force
during the period ended in 30 June 2014 had no significant impact on the Group’s consolidated financial statements.
The consolidated financial statements were presented in Euros since this is the main currency of the Group’s operations.
In the preparation of the consolidated financial statements, in accordance with the IAS/IFRS, the Group’s Board of Directors
adopted certain assumptions and estimations that affect the assets and liabilities reported, as well as the profits and losses incurred
related to the reported periods. All the estimations and assumptions of the Board of Directors were performed taking into
consideration the best knowledge available at the financial statements approval date of the events and the dealings in progress.
2. GROUP COMPANIES INCLUDED IN THE CONSOLIDATED FINANCIAL
STATEMENTS
Group companies included in the consolidated financial statements, their consolidation methods, head offices and percentage of share
capital held by the Group, at 30 June 2014 and 31 December 2013 are as follows:
COMPANIES CONSOLIDATED THROUGH THE FULL CONSOLIDATION METHOD
PERCENTAGE OF SHARE CAPITAL HELD
COMPANY
HEAD OFFICE
DESIGNATION
DIRECTLY
Martifer SGPS, S.A.
Oliveira de Frades
Martifer SGPS
Holding
INDIRECTLY
TOTAL
2013
Martifer Inovação e Gestão, S.A.
Oliveira de Frades
Martifer Gestiune Si Servicii, S.R.L.
Bucharest
Martifer Inovação
Martifer Inovação
Roménia
100.00%
-
100.00%
100.00%
100.00%
-
100.00%
100.00%
75.00%
-
75.00%
100.00%
Martifer Metallic Constructions SGPS, S.A.
Oliveira de Frades
Martifer - Construções Metalomecânicas, S.A.
Martifer Mota-Engil Coffey Construction Joint Venture
Limited
Martifer – Construcciones Metálicas España, S.A.
Oliveira de Frades
Martifer Metallic
Constructions
Martifer Construções
-
75.00%
75.00%
100.00%
Dublin
MMECC 1)
-
45.00%
45.00%
60.00%
Madrid
Martifer Espanha
-
75.00%
75.00%
Martifer – Construções Metálicas Angola, S.A.
Luanda
Martifer Angola
-
59.06%
59.06%
100.00%
78.75%
Martifer Construction Limited
Dublin
Martifer Irlanda
-
75.00%
75.00%
100.00%
Martifer Polska Sp. Zo.o.
Gliwice
Martifer Polska
-
75.00%
75.00%
100.00%
Martifer Constructions, SAS
Rungis
Martifer França
-
75.00%
75.00%
100.00%
Martifer Constructii SRL
Bucharest
Martifer Constructii
-
75.00%
75.00%
100.00%
Park Logistyczny Biskupice
Gliwice
Biskupice
-
75.00%
75.00%
100.00%
Martifer Konstrukcje Sp. Z o.o.
Gliwice
Martifer Konstrukcje
-
75.00%
75.00%
100.00%
Martifer Slovakia S.R.O.
Bratislava
Martifer Slovakia
-
75.00%
75.00%
100.00%
Sociedade de Madeiras do Vouga, S.A.
Albergaria-a-Velha
Madeiras do Vouga
-
75.00%
75.00%
100.00%
Martifer - Gestão de Investimentos, S.A.
Oliveira de Frades
MGI
-
75.00%
75.00%
100.00%
1H 2014 REPORT
PAGE 45
PERCENTAGE OF SHARE CAPITAL HELD
COMPANY
HEAD OFFICE
DESIGNATION
DIRECTLY
INDIRECTLY
TOTAL
2013
Oliveira de Frades
Nagatel Viseu
-
75.00%
75.00%
100.00%
Martifer Retail & Warehousing Angola, S.A.
Luanda
Martifer Retail Angola
-
75.00%
75.00%
100.00%
Martifer - Alumínios, S.A.
Oliveira de Frades
Martifer Alumínios
-
75.00%
75.00%
100.00%
Martifer Alumínios Angola, S.A.
Luanda
Martifer Alumínios Angola
-
75.00%
75.00%
100.00%
Martifer Aluminium Pty, Ltd
Sidney
-
75.00%
75.00%
100.00%
Martifer Aluminium Limited
Dublin
-
75.00%
75.00%
100.00%
Martifer Aluminium UK Limited
London
-
75.00%
75.00%
100.00%
Martifer Aluminium SAS
Rungis
-
75.00%
75.00%
100.00%
Martifer Alumínios Ltda
Nagatel Viseu, Promoção Imobiliária, S.A.
São Paulo
Sassall
Martifer Aluminium
Irlanda
Martifer Aluminium Reino
Unido
Martifer Aluminium
França
Martifer Alumínios Brasil
-
74.99%
74.99%
99.99%
Martifer UK Limited
London
Martifer UK
-
75.00%
75.00%
100.00%
MT Construction Maroc, S.A.R.L.
Tangier
Martifer Marrocos
-
75.00%
75.00%
Martifer - Construções Metálicas, Ltda.
Fortaleza
Martifer Brasil
-
74.85%
74.85%
100.00%
99.80%
Saudi Martifer Constructions LLC
Riyadh
Martifer Arábia Saudita
Vienna
Martifer GmbH
Gliwice
Martifer Beteiligungsverwaltungs GmbH
M City Gliwice Sp. Zo.o
-
75.00%
75.00%
100.00%
100.00%
-
100.00%
100.00%
-
75.00%
75.00%
100.00%
100.00%
-
100.00%
100.00%
Martifer Energia S.R.L.
Bucharest
M City Gliwice
Martifer Energy Systems
II
Martifer Energia Roménia
-
100.00%
100.00%
100.00%
Martifer Energia LLC
Kiev
Martifer Energia Ucrânia
-
100.00%
100.00%
100.00%
Martifer Wind Energy Systems LLC
San Angelo TX
-
100.00%
100.00%
100.00%
Martifer Energy Systems PTY
Cape Town
Navalria – Docas, Construções e Reparações Navais, S.A.
Aveiro
Martifer Wind USA
Martifer Energia África do
Sul
Navalria
Gebox, S.A.
Ílhavo
West Sea - Estaleiros Navais, Lda.
Oliveira de Frades
Oliveira de Frades
Martifer Global
Martifer Construcciones Peru, S.A.
Lima
Global Holding Limited
Martifer Energy Systems II, SGPS, S.A.
Oliveira de Frades
-
85.00%
85.00%
85.00%
-
100.00%
100.00%
100.00%
Gebox
-
100.00%
100.00%
100.00%
West Sea
-
100.00%
100.00%
100.00%
100.00%
-
100.00%
100.00%
Martifer Peru
-
100.00%
100.00%
100.00%
Zebbug
Global Holding Limited
-
100.00%
100.00%
100.00%
Zebbug
Global Engineering
-
100.00%
100.00%
100.00%
Martifer Solar SGPS, S.A.
Oliveira de Frades
Martifer Solar SGPS
100.00%
-
100.00%
100.00%
Martifer Solar, S.A.
Oliveira de Frades
-
55.00%
55.00%
55.00%
-
55.00%
55.00%
55.00%
-
55.00%
55.00%
55.00%
Martifer Global SGPS, S.A.
Global Engineering & Construction Limited
Solar Parks Construccion Parques Solares ETVE, S.A.
Madrid
Martifer Solar
Martifer Solar Sistemas
Solares
Solar Parks
Parque Solar Seseña III, S.L.
Madrid
Seseña III
-
55.00%
55.00%
55.00%
MTS Solar Sistemas Solares, S.A.
Mexico City
Martifer Solar México
-
54.45%
54.45%
54.45%
Martifer Solar Chile Holding, Lda
Santiago do Chile
Martifer Solar Chile
-
55.00%
55.00%
55.00%
Santiago do Chile
Solar Chile Operaciones
-
55.00%
55.00%
55.00%
Martifer Solar Sistemas Solares Equador S.A.
Sangolquí
-
54.45%
54.45%
54.45%
Martifer Solar Servicios México
Mexico City
-
55.00%
55.00%
55.00%
Martifer Solar Sistemas Solares, S.A.
Martifer Solar Chile Operaciones Limitada
Madrid
Milan
Martifer Solar Equador
Martifer Solar Servicios
México
Martifer Solar Itália
-
55.00%
55.00%
55.00%
MTS1 S.R.L.
Syracuse
MTS1
-
55.00%
55.00%
55.00%
MTS2 S.R.L.
Syracuse
MTS2
-
55.00%
55.00%
55.00%
MTS3 S.R.L.
Syracuse
MTS3
-
55.00%
55.00%
55.00%
Martifer Solar RO S.R.L.
Bucharest
Martifer Solar Roménia
-
55.00%
55.00%
55.00%
S. Francisco CA
Martifer Inc.
-
55.00%
55.00%
55.00%
Santa Monica CA
AEM
-
54.61%
54.61%
54.61%
Santa Monica CA
Solar Aurora 1)
-
54.07%
54.07%
54.07%
MT Silverado Fund I LLC
S. Francisco CA
Silverado 1)
-
31.42%
31.42%
31.42%
Martifer Solar Finance LLC
S. Francisco CA
Martifer Solar Finance
-
55.00%
55.00%
55.00%
Martifer Solar Hellas, A.T.E.
Athens
PVI 1)
-
39.13%
39.13%
39.13%
Martifer Solar Angola
Luanda
Martifer Solar Angola 1)
-
41.25%
41.25%
41.25%
Martifer Solar N.V.
Deerlijk
Martifer Solar Bélgica
-
55.00%
55.00%
55.00%
Martifer Solar UK Limited
London
Martifer Solar UK
-
55.00%
55.00%
55.00%
Martifer Solar S.A.S.
Lyon
-
55.00%
55.00%
55.00%
Martifer Solar CZ
Prague
-
55.00%
55.00%
55.00%
Home Energy France SAS
Lyon
Martifer Solar França
Martifer Solar República
Checa
Home Energy França
-
55.00%
55.00%
55.00%
Martifer Solar S.R.L.
Martifer Solar Inc.
Martifer Solar USA, Inc.
Martifer Aurora Solar, LLC
PAGE 46
1H 2014 REPORT
PERCENTAGE OF SHARE CAPITAL HELD
COMPANY
HEAD OFFICE
DESIGNATION
DIRECTLY
INDIRECTLY
TOTAL
2013
PVGlass S.r.l
Milan
PVGlass Itália
-
55.00%
55.00%
55.00%
MPrime Solar Solutions, S.A.
Oliveira de Frades
Mprime
-
55.00%
55.00%
55.00%
Munich
MPrime GMBH
-
55.00%
55.00%
55.00%
Sol Cativante, Lda.
Sever do Vouga
Sol Cativante
-
55.00%
55.00%
55.00%
Martifer Solar Investments, B.V.
Amsterdam
Martifer Solar Holanda
-
55.00%
55.00%
55.00%
Martifer Solar Canadá, Ltd.
Toronto
Martifer Solar Canadá
-
55.00%
55.00%
55.00%
MTS6 S.R.L.
Syracuse
MTS6
-
55.00%
55.00%
55.00%
Martifer Solar SK s.r.o.
Dolny Kubin
Martifer Solar Eslováquia
-
55.00%
55.00%
55.00%
Ginosa Solar Farm, S.R.L.
Rome
Ginosa Solar Farm
-
55.00%
55.00%
55.00%
Solar Spritehood S.R.L
Rome
Solar Spritehood
-
55.00%
55.00%
55.00%
MTS7, S.R.L.
Rome
MTS7
-
55.00%
55.00%
55.00%
Canopy - Naos
Paris
Canopy Naos
-
55.00%
55.00%
55.00%
Steadfast Fairview Solar, Ltd
Andover
Steadfast Fairview Solar
-
55.00%
55.00%
55.00%
Steadfast Molland Solar, Ltd
Andover
Steadfast Molland Solar
-
55.00%
55.00%
55.00%
Martifer Solar UA, LLC
Kyiv
Martifer Solar Ucrânia
-
55.00%
55.00%
55.00%
Inspira Martifer Solar Limited
Mumbai
Inspira Martifer Solar 1)
-
28.05%
28.05%
28.05%
Societé Developpement Local SA
Dakar
Martifer Solar Senegal
-
28.05%
28.05%
28.05%
Martimak Solar
Besiktas
Martimak1)
-
44.00%
44.00%
44.00%
Martiper Solar
Besiktas
Martiper1)
-
44.00%
44.00%
44.00%
Martifer Solar Singapura PTE. LTD.
Singapore
Martifer Solar Singapura
-
55.00%
55.00%
55.00%
Tokyo
Martifer Solar Japan
-
55.00%
55.00%
55.00%
EVIVA SOLAR 1 LTD
Athens
Eviva Solar 1
-
54.90%
54.90%
54.90%
EVIVA SOLAR 2 LTD
Athens
Eviva Solar 2
-
54.90%
54.90%
54.90%
MTS Francis Court Solar Limited
London
MTS Francis2)
-
55.00%
55.00%
55.00%
MTS Spittleborough Solar Limited
London
MTS Spittleborough
-
-
-
55.00%
MTS Tonge Solar Limited
London
MTS Tonge
-
55.00%
55.00%
55.00%
MTS Rydon Solar Limited
London
-
55.00%
55.00%
55.00%
-
28.05%
28.05%
28.05%
-
55.00%
55.00%
55.00%
MPrime GMBH
Martifer Solar Japan KK
1)
Martifer Solar MZ, S.A.
Maputo
Greencoverage Unipessoal, Lda.
Oliveira de Frades
MTS Rydon
Martifer Solar
Moçambique 1)
Greencoverage
Martifer Solar, Ltda
Pindamonhangaba
Martifer Solar Brasil
-
54.45%
54.45%
54.45%
Visiontera Unipessoal, Lda
Oliveira de Frades
Visiontera
-
55.00%
55.00%
55.00%
Inovsun, Lda.
Oliveira de Frades
Inovsun
-
55.00%
55.00%
55.00%
Martifer Solar Middle East
Dubai
Martifer Solar Middle East
-
55.00%
55.00%
55.00%
Belive in Bright Unipessoal, LDA.
Oliveira de Frades
Belive in Bright
-
55.00%
55.00%
55.00%
Montidílico Unipessoal, LDA.
Oliveira de Frades
Montidílico
-
-
-
55.00%
Martifer Renewables SGPS, S.A.
Oliveira de Frades
100.00%
-
100.00%
100.00%
Martifer Renewables, S.A.
Oliveira de Frades
Martifer Renewables
SGPS
Martifer Renewables SA
-
100.00%
100.00%
100.00%
Martifer Renovables ETVE, S.A.U.
Madrid
Martifer Renovables
-
100.00%
100.00%
100.00%
Eurocab FV 1 S.L.
Madrid
Eurocab 1
-
100.00%
100.00%
100.00%
Eurocab FV 2 S.L.
Madrid
Eurocab 2
-
100.00%
100.00%
100.00%
Eurocab FV 3 S.L.
Madrid
Eurocab 3
-
100.00%
100.00%
100.00%
Eurocab FV 4 S.L.
Madrid
Eurocab 4
-
100.00%
100.00%
100.00%
Eurocab FV 5 S.L.
Madrid
Eurocab 5
-
100.00%
100.00%
100.00%
Eurocab FV 6 S.L.
Madrid
Eurocab 6
-
100.00%
100.00%
100.00%
Eurocab FV 7 S.L.
Madrid
Eurocab 7
-
100.00%
100.00%
100.00%
Eurocab FV 8 S.L.
Madrid
Eurocab 8
-
100.00%
100.00%
100.00%
Eurocab FV 9 S.L.
Madrid
Eurocab 9
-
100.00%
100.00%
100.00%
Eurocab FV 10 S.L.
Madrid
Eurocab 10
-
100.00%
100.00%
100.00%
Eurocab FV 11 S.L.
Madrid
Eurocab 11
-
100.00%
100.00%
100.00%
Eurocab FV 12 S.L.
Madrid
Eurocab 12
-
100.00%
100.00%
100.00%
Eurocab FV 13 S.L.
Madrid
Eurocab 13
-
100.00%
100.00%
100.00%
Eurocab FV 14 S.L.
Madrid
Eurocab 14
-
100.00%
100.00%
100.00%
Eurocab FV 15 S.L.
Madrid
Eurocab 15
-
100.00%
100.00%
100.00%
Eurocab FV 16 S.L.
Madrid
Eurocab 16
-
100.00%
100.00%
100.00%
Eurocab FV 17 S.L.
Madrid
Eurocab 17
-
100.00%
100.00%
100.00%
Eurocab FV 18 S.L.
Madrid
Eurocab 18
-
100.00%
100.00%
100.00%
Eurocab FV 19 S.L.
Madrid
Eurocab 19
-
100.00%
100.00%
100.00%
Bucharest
Eviva Roménia
-
100.00%
100.00%
100.00%
Eviva Energy S.R.L.
1H 2014 REPORT
PAGE 47
PERCENTAGE OF SHARE CAPITAL HELD
COMPANY
HEAD OFFICE
DESIGNATION
DIRECTLY
INDIRECTLY
TOTAL
2013
Eviva Nalbant S.R.O.
Bucharest
Eviva Nalbant
-
100.00%
100.00%
100.00%
Eviva Agighiol S.R.L.
Bucharest
Eviva Agighiol
-
99.00%
99.00%
99.00%
Eviva Casimcea S.R.O.
Bucharest
Eviva Casimcea
-
99.00%
99.00%
99.00%
Premium Management Consulting, S.R.L.
Bucharest
Premium Management
-
85.00%
85.00%
85.00%
MW Topolog, S.R.L.
Bucharest
MW Topolog
-
99.00%
99.00%
99.00%
Martifer Renewables, S.A.
Gliwice
Eviva Polónia
-
100.00%
100.00%
100.00%
Martifer Renewables Pty, Ltd.
Sidney
Eviva Austrália
-
100.00%
100.00%
100.00%
Eviva Beteiligungsverwaltungs GmbH
Vienna
Eviva GmbH
-
100.00%
100.00%
100.00%
Eviva Hidro S.R.L.
Bucharest
Eviva Hidro
1.00%
99.00%
100.00%
100.00%
Martifer Deutschland GmbH
Berlin
Martifer Deutschland
-
100.00%
100.00%
100.00%
Wind Farm Odrzechowa Sp. Zo.o
Gliwice
Wind Odrzechowa
-
100.00%
100.00%
100.00%
Eviva Gizalki Sp. Zo.o
Miastko
Eviva Gizalki
-
100.00%
100.00%
100.00%
Wind Farm Bukowsko Sp. Zo.o
Gliwice
Wind Farm Bukowsko
-
100.00%
100.00%
100.00%
Wind Farm Markowa Sp. Zo.o
Gliwice
Wind Farm Markowa
-
100.00%
100.00%
100.00%
Wind Farm Lada Sp. Zo.o
Gliwice
Wind Farm Lada
-
100.00%
100.00%
100.00%
Wind Farm Jawornik Sp. Zo.o
Gliwice
Wind Farm Jawornik
-
100.00%
100.00%
100.00%
Wind Farm Piersno Sp. Zo.o
Gliwice
Wind Farm Piersno
-
100.00%
100.00%
100.00%
Wind Farm Oborniki Sp. Zo.o
Gliwice
Wind Farm Oborniki
-
100.00%
100.00%
100.00%
Martifer Renewables Brazil B.V.
Amsterdam
Renewables Holanda
-
100.00%
100.00%
100.00%
Madrid
-
100.00%
100.00%
100.00%
-
100.00%
100.00%
100.00%
-
100.00%
100.00%
100.00%
Martifer Renewables Investments ETVE, S.A.
Martifer Renewables Brasil Participações LTDA
Fortaleza
Vesto EAD
Varna
Eurocab 21
Renewables Italy
Holanda
Martifer Renewables
Brasil
Vesto
-
-
-
100.00%
Varna
DVP1
-
-
-
100.00%
DVP2 Limited
Martifer Renováveis - Geração de Energia e
Participações S.A.
Eólica Cajueiro da Praia, Ltda .
Varna
DVP2
-
-
-
100.00%
Fortaleza
Ventania
-
55.00%
55.00%
55.00%
Fortaleza
Cajueiro
-
55.00%
55.00%
55.00%
Eólica Coqueirais, Ltda.
SBER – Sociedade Brasileira de Energias
Renováveis, Ltda.
Melosa – Geração de Energia e Participações, Ltda.
Fortaleza
Cacimbas
-
55.00%
55.00%
55.00%
Fortaleza
SBER 1)
-
41.25%
41.25%
41.25%
Fortaleza
Melosa
-
55.00%
55.00%
55.00%
Fortaleza
Paraipaba
-
55.00%
55.00%
55.00%
Fortaleza
Chapadão
-
55.00%
55.00%
55.00%
Martifer Renewables Italy BV
DVP1 Limited
Eólica Paraipaba, Ltda .
Eólica Chapadão, Ltda.
Rosa dos Ventos - Geração e Comercialização de
Energia, S.A
Eólica Macaúbas, Ltda.
Eólica Sobradinho, Ltda.
MSPAR Energia e Participações, SA
Martifer Renewables O&M Sp. z o.o.
Amsterdam
3)
Fortaleza
Rosa dos Ventos
-
-
-
55.00%
Fortaleza
Macaúbas
-
54.99%
54.99%
54.99%
Fortaleza
Sobradinho
-
54.99%
54.99%
54.99%
Barueri
MSPAR
Martifer Renewables
O&M
-
100.00%
100.00%
55.00%
-
52.00%
52.00%
52.00%
Gliwice
1) The consolidation of these companies using the full consolidation method is a consequence of the Group having stepped shareholdings, but exercising control
at each level.
2) Its prior designation was MTS Downs Farm Solar Limited.
3) This company was classified as an Non-current assets held for sale at 31 December 2013.
PAGE 48
1H 2014 REPORT
COMPANIES CONSOLIDATED THROUGH THE EQUITY METHOD
PERCENTAGE OF SHARE CAPITAL HELD
COMPANY
HEAD OFFICE
DESIGNATION
DIRECTLY
INDIRECTLY
TOTAL
2013
Liszki Green Park, Sp. Zo.o
Gliwice
Martifer Amal, S.A.
Nacala
Oliveira de
Frades
Liszki Green Park
-
33.75%
33.75%
45.00%
Martifer Amal
-
35.00%
35.00%
35.00%
Martifer Amal
-
30.00%
30.00%
30.00%
Promoquatro
-
37.50%
37.50%
50.00%
Metallic Construction
Associated companies:
Martifer Amal, S.A.
Joint control companies:
Promoquatro – Investimentos Imobiliários,
Lda.
M City Bialystok Sp. Zo.o
Oliveira de
Frades
Gliwice
M City Bialystok
-
37.50%
37.50%
50.00%
M City Radom Sp. Zo.o
Gliwice
M City Radom
-
37.50%
37.50%
50.00%
M. City Szczecin Sp. Z o.o.
Gliwice
M City Szczecin
-
37.50%
37.50%
50.00%
Madrid
Seseña I
-
20.63%
20.63%
20.63%
Madrid
Canaverosa
-
26.94%
26.94%
26.94%
Santiago
Maria del Sol
-
26.95%
26.95%
26.95%
Solar
Associated companies:
Parque Solar Seseña I, S.L.
Canaverosa Renovables, SL
Empresa de Energia Renovable Maria del Sol
Norte S.A.
MSN Solar Uno SpA
Santiago
MSN Solar Uno
-
26.95%
26.95%
26.95%
MSN Solar Dos SpA
Santiago
MSN Solar Dos
-
26.95%
26.95%
26.95%
MSN Solar Tres SpA
Santiago
MSN Solar Tres
-
26.95%
26.95%
26.95%
MSN Solar Cuatro SpA
Santiago
MSN Solar Cuatro
-
26.95%
26.95%
26.95%
MSN Solar Cinco SpA
Santiago
MSN Solar Cinco
-
26.95%
26.95%
26.95%
FTP Solar LLC
New York
FTP Solar
-
20.57%
20.57%
20.57%
49.00%
-
49.00%
49.00%
-
49.00%
49.00%
49.00%
-
49.00%
49.00%
49.00%
-
49.00%
49.00%
49.00%
-
49.00%
49.00%
49.00%
-
49.00%
49.00%
49.00%
-
49.00%
49.00%
49.00%
-
49.00%
49.00%
49.00%
-
49.00%
49.00%
49.00%
-
49.00%
49.00%
49.00%
-
49.00%
49.00%
49.00%
-
49.00%
49.00%
49.00%
-
49.00%
49.00%
49.00%
-
42.60%
42.60%
42.60%
-
40.47%
40.47%
40.47%
-
49.00%
49.00%
49.00%
-
48.98%
48.98%
48.98%
-
49.00%
49.00%
49.00%
-
49.00%
49.00%
49.00%
-
22.05%
22.05%
22.05%
-
49.00%
49.00%
49.00%
-
22.05%
22.05%
22.05%
-
49.00%
49.00%
49.00%
-
24.50%
24.50%
24.50%
-
49.00%
49.00%
49.00%
-
22.05%
22.05%
22.05%
-
22.05%
22.05%
22.05%
-
9.80%
9.80%
9.80%
-
49.00%
49.00%
49.00%
Others
Associated companies:
Nutre MZ. S.A.
Oliveira de
Frades
Oliveira de
Frades
Oliveira de
Frades
Maputo
Nutre Farming, S.R.L.
Bucharest
Prio Agromart S.R.L.
Bucharest
Nutre Moçambique
Nutre Farming
2)
Roménia
2)
Prio Agromart
Prio Balta S.R.L.
Bucharest
Prio Balta
Prio Facaieni S.R.L.
Bucharest
Prio Facaieni
Prio Ialomita S.R.L.
Bucharest
Prio Ialomita
Prio Rapita S.R.L.
Bucharest
Prio Rapita
Nutre Farming West Part S.R.L.
Bucharest
Nutre West Part
Prio Terra Agricola S.R.L.
Bucharest
Prio Terra Agricola
Prio Turism Rural S.R.L
Bucharest
Prio Turism Rural
Agromec Balaciu
Bucharest
Agromec Balaciu
Miharox S.R.L.
Bucharest
Miharox
Zimbrul. S.A.
Bucharest
Zimbrul
Agrozootehnica. S.A.
Bucharest
Agrozootehnica
Prio Agrotrans S.R.L.
Prio Agrotrans
Prio Extractie S.R.L.
Bucharest
S. Luís do
Maranhão
Bucharest
Prio Agro Industries. Sp. Z o.o.
Gliwice
Prio Polónia
Prio Biocombustibil S.R.L.
Bucharest
Prio Biocombustibil
Prio Meat S.R.L
Bucharest
Prio Meat
Prio Foods – AJFS Construções, ACE
Lisbon
Prio Foods ACE
Nutre Farming B.V.
Amsterdam
Bunge Prio Cooperativa U.A.
Amsterdam
Nutre Farming
Bunge Prio
2)
Cooperativa
Bunge Roménia S.R.L.
Buzau
Centralrest, Lda
Ilhavo
Bunge Roménia
Centralrest 2)
Prio Agriculture, B.V.
Delft
Prio Holanda
Nutre SGPS, S.A.
Nutre, S.A.
Nutre - Industrias Alimentares, S.A.
Nutre Brasil LTDA
1H 2014 REPORT
Prio SGPS
Prio Foods
2)
2)
Prio Alimentar
2)
2)
2)
2)
2)
2)
2)
2)
2)
2)
2)
2)
2)
2)
Prio Foods Brasil
Prio Extractie
2)
2)
2)
2)
2)
2)
2)
2)
2)
PAGE 49
PERCENTAGE OF SHARE CAPITAL HELD
COMPANY
HEAD OFFICE
DESIGNATION
Porthold Project Development BV
Amsterdam
Porthold
DIRECTLY
INDIRECTLY
TOTAL
2013
-
49.00%
49.00%
49.00%
Fertilis Agro-Indústrias, Lda
Fertilis
IMO 505, Lda
Luanda
Oliveira de
Frades
Oliveira de
Frades
Oliveira de
Frades
Coimbra
Oliveira de
Frades
Oliveira de
Frades
Oliveira de
Frades
Oliveira de
Frades
Oliveira de
Frades
Coimbra
-
29.40%
29.40%
29.40%
5.00%
-
5.00%
10.00%
-
5.00%
5.00%
10.00%
-
5.00%
5.00%
10.00%
-
5.00%
5.00%
10.00%
-
5.00%
5.00%
10.00%
-
5.00%
5.00%
10.00%
-
5.00%
5.00%
10.00%
-
5.00%
5.00%
10.00%
-
5.00%
5.00%
10.00%
Prio Gas Lisboa, SA
Aveiro
IMO 505
-
5.00%
5.00%
-
Prio Gas 1)
-
2.50%
2.50%
-
Ventinveste, S.A.
Lisbon
Ventinveste SA
Ventinveste Eólica, SGPS, S.A.
Ventinveste Eólica
Parque Eólico de Torrinheiras, S.A.
Lisbon
Oliveira de
Frades
Lisbon
5.00%
41.00%
46.00%
46.00%
-
46.00%
46.00%
46.00%
Ventinveste Indústria
-
46.00%
46.00%
46.00%
PE Torrinheiras
-
46.00%
46.00%
Parque Eólico do Douro Sul, S.A.
46.00%
Lisbon
PE Douro Sul
-
46.00%
46.00%
46.00%
Parque Eólico do Pinhal do Oeste, S.A.
Lisbon
PE Pinhal do Oeste
-
46.00%
46.00%
46.00%
Parque Eólico de Vale Grande. S.A.
Lisbon
PE Vale Grande
-
46.00%
46.00%
46.00%
Parque Eólico de Vale do Chão, S.A.
Lisbon
PE Vale do Chão
-
46.00%
46.00%
46.00%
Parque Eólico do Cabeço Norte, S.A.
Lisbon
PE Cabeço Norte
-
46.00%
46.00%
46.00%
Parque Eólico da Serra do Oeste, S.A.
Lisbon
PE Serra do Oeste
-
46.00%
46.00%
46.00%
Parque Eólico do Planalto, S.A.
Lisbon
PE Planalto
-
46.00%
46.00%
46.00%
Eviva Dunowo, Sp. Z o.o.
Gliwice
Eviva Dunowo
-
50.00%
50.00%
50.00%
Lisbon
Oliveira de
Frades
Oliveira de
Frades
SPEE 3
-
50.00%
50.00%
50.00%
SPEE 2
-
50.00%
50.00%
50.00%
PE Penha da
Gardunha
-
50.00%
50.00%
50.00%
Prio Energy SGPS. S.A.
Prio Biocombustíveis. S.A.
Prio Energy. S.A.
Mondefin
Prio Parque de Tanques de Aveiro, S.A.
Prio.E-Electric, S.A.
PRIO.E - Mobility Solutions, Lda _PT
Prio. E – SGPS, S.A.
Share Motivation, Lda.
2)
2)
Prio Energy SGPS
1)
Prio Biocombustíveis
1)
Prio Energy
Mondefin
1)
1)
Prio Tanques
1)
Prio.E-Electric
1)
Park Charge
1)
Prio E SGPS
1)
Share Motivation
1)
1)
Joint control companies
Ventinveste Indústria SGPS, S.A.
SPEE 3 – Parque Eólico do Baião, S.A.
SPEE 2 – Parque Eólico de Vila Franca de
Xira, S.A.
Parque Eólico da Penha da Gardunha, Lda.
1)
2)
The consolidation of this company through the equity method results from the Group having significant influence of its parent company, which in turn has
significant influence on the investee.
The consolidation of this company through the equity method was stopped because Group decided classify the financial investment in Nutre SGPS as Noncurrent asset held for sale (note 20).
During the first half of 2014 and during 2013 the changes occurred in the consolidation perimeter were as follows:
Incorporated companies:
During the first half of 2014:
There were no incorporations.
PAGE 50
1H 2014 REPORT
In 2013:
HEAD OFFICE
Metallic Construction
Subsidiary companies:
Martifer Aluminium SAS
Martifer Alumínios Ltda
West Sea - Estaleiros Navais, Lda.
Martifer Construcciones Peru, S.A.
Global Holding Limited
Global Engineering & Construction Limited
Rungis
São Paulo
Oliveira de Frades
Lima
Zebbug
Zebbug
Associated companies:
Martifer Amal, S.A. (Portugal)
Oliveira de Frades
Solar
Subsidiary companies:
Martifer Solar Servicios México
Martifer Solar Japan KK
MTS Francis Court Solar Limited
MTS Spittleborough Solar Limited
MTS Tonge Solar Limited
MTS Rydon Solar Limited
Visiontera Unipessoal, Lda
Martifer Solar Middle East
Belive in Bright Unipessoal, Lda
Montidílico Unipessoal, Lda
Mexico City
Tokyo
London
London
London
London
Oliveira de Frades
Dubai
Oliveira de Frades
Oliveira de Frades
Associated companies:
MSN Solar Uno SpA
MSN Solar Dos SpA
MSN Solar Tres SpA
MSN Solar Cuatro SpA
MSN Solar Cinco SpA
Santiago
Santiago
Santiago
Santiago
Santiago
FTP Solar LLC
New York
RE Developer
Subsidiary companies:
Eólica Macaúbas, Ltda.
Eólica Sobradinho, Ltda.
MSPAR Energia e Participações, SA
Martifer Renewables O&M Sp. z o.o.
Fortaleza
Fortaleza
Barueri
Gliwice
Others:
Associated companies:
Nutre Farming West Part S.R.L.
Bucharest
Acquired companies:
During the first half of 2014:
HEAD OFFICE
Others:
Associated companies:
IMO 505, Lda
Prio Gas Lisboa, SA
1H 2014 REPORT
Coimbra
Aveiro
PAGE 51
In 2013:
HEAD OFFICE
Others:
Associated companies:
Fertilis Agro-Indústrias, Lda
Luanda
Sold / dissolved companies:
During the first half of 2014:
HEAD OFFICE
Solar
MTS Spittleborough Solar Limited
London
Montidílico Unipessoal, LDA.
Oliveira de Frades
Renewables
Vesto EAD
DVP1 Limited
DVP2 Limited
Rosa dos Ventos - Geração e Comercialização de Energia, S.A
Varna
Varna
Varna
Fortaleza
In 2013:
HEAD OFFICE
Solar
Subsidiary companies:
MTS4 S.R.L.
MPrime Italia S.r.l
Sol Cativante VII, Lda.
Eviva Mepe
MTS Trewidland Solar, Ltd
Steadfast Apsley Solar, Ltd
LRCC – La Rad Campo Charro – Energias Renováveis, Lda.
Syracuse
Oliveira de Frades
Viseu
Athens
London
Andover
São Martinho do Porto
RE Developer
Subsidiary companies:
Martifer Renewables Bippen GmbH
Energia Wiatrowa Sp. Zo.o
Berlin
Gliwice
Joint control companies:
Macquarie Capital Wind Fund Pty Limited
Sidney
Changes in the consolidation method:
During the first half of 2014:
MTS 3 – from equity method to full consolidation due to the increase in the shareholding held by Martifer Solar Itália from 49% to 100%.
In 2013:
Prio Agriculture B.V. (Prio Holanda) – from full consolidation to equity method due to its sale by Martifer Renewables SGPS, S.A. to
Nutre SGPS, S.A.
Porthold Project Development BV (Porthold) - from full consolidation to equity method due to the sale of Prio Agriculture B.V. by
Martifer Renewables SGPS, S.A. to Nutre SGPS, S.A.
MTS 3 – from full consolidation to equity method due to the decrease in the shareholding held by Martifer Solar Itália from 100% to 49%.
PAGE 52
1H 2014 REPORT
Ventinveste Indústria SGPS, S.A. – from full consolidation to equity method due to loss of control over same, namely for not
managing its financial and operational policies.
Other changes in the consolidation perimeter:
During the first half of 2014:
MS Par Energia e Participações – transfer of the total shares held by Martifer Renováveis, SA to Martifer Renewables Brasil
Participações, Ltda.
Prio Energy SGPS - decrease in the shareholding held by Martifer SGPS, S.A. from 10% to 5%.
Martifer Metallic Constructions SGPS, S.A - decrease in the shareholding held by Martifer SGPS, S.A. from 100% to 75%.
In 2013:
Porthold Project Development BV (Porthold) – increase in the shareholding held by Prio Agriculture B.V from 55% to 100%.
Eviva Gizalki Sp.Zo.o (Eviva Gizalki) – increase in the shareholding held by Martifer Renewables SGPS, S.A. from 72% to 100%.
Martifer Solar USA, Inc. (AEM) – increase in the shareholding held by Martifer Solar Inc. from 63.5% to 99.293%.
Eviva Nalbant S.R.O. (Eviva Nalbant) – increase in the shareholding held by Eviva Energy S.R.L. from 99% to 100%.
Rosa dos Ventos S.A. (Rosa dos Ventos) – increase in the shareholding held by Martifer Renováveis-Geração de Energia e
Participações, S.A. from 97.5% to 100%.
Prio Energy SGPS – decrease in the shareholding held by Martifer SGPS, S.A. from 49% to 10%.
PV Glass, SA – merger by incorporation in Martifer Solar S.A.
PV Glass, Srl – change in shareholder structure as a result of the merger by incorporation of PV Glass in Martifer Solar S.A.
M City Gliwice Sp. Zo.o – increase in the shareholding held by Martifer GmbH from 52.6% to 97.8% and a further increase of 2%
through Martifer Metallic Constructions, SGPS, S.A.
3. INFORMATION BY BUSINESS SEGMENTS
The Group bases its disclosure of information for primary segments on its internal organisation in terms of management.
The Group is organised in three business areas: ‘Metallic Construction’, ‘Solar’ and ‘RE Developer’ that are coordinated and
supported by Martifer SGPS.
The Metallic Construction business area includes all the construction activities of steel structures, aluminium façades and glass and
stainless steel solutions. It includes also the wind power division, components, turbine assembly and turnkey wind farm delivery,
engineering division and navy. In the ‘Solar’ segment the focus is on the production of PV panels, as well as the turnkey solar parks
delivery, promotion, licensing, operation and maintenance of projects. The ‘RE Developer’ segment includes the promotion and
development of projects of renewable energy, with special emphasis in the wind sector.
Amounts related with Martifer SGPS, Martifer Inovação e Gestão S.A. (MIG) and Martifer Gestiune Si Servicii, S.R.L. (MIG RO) are
reported as ‘Others’.
The accounting policies used in the preparation of the information by business segments is the same used in the preparation of the
attached financial statements (Note 1).
1H 2014 REPORT
PAGE 53
At 30 June 2014 and 2013, the breakdown of sales and services rendered by primary segments is as follows:
SALES TO EXTERNAL CUSTOMERS
INTERSEGMENT SALES
TOTAL
6M'14
EURO
6M'13
EURO
6M'14
EURO
6M'13
EURO
6M'14
EURO
6M'13
EURO
Metallic Construction
86,451,961
117,941,348
15,366,612
21,689,188
101,818,573
139,630,536
Solar
52,732,191
145,696,202
2,098,360
58,974,435
54,830,551
204,670,637
3,753,640
9,109,834
100,446
23,467
3,854,086
9,133,302
524,005
630,148
2,100,274
1,787,973
2,624,279
2,418,121
143,461,797
273,377,532
19,665,692
82,475,063
163,127,489
355,852,595
(16,104,820)
(80,458,414)
RE Developer
Others
Intersegment eliminations
Own work capitalized (Note 5)
(3,560,872)
(2,016,650)
143,461,797
273,377,531
Sales and services rendered by geographical segments are as follows:
6M'14
EURO
6M'13
EURO
Metallic Construction
24,671,784
51,958,306
Solar
15,675,701
27,660,475
1,865,132
2,206,251
444,046
600,215
Metallic Construction
23,211,948
24,784,988
Solar
33,580,936
69,137,673
1,872,361
4,053,692
79,960
29,933
38,550,506
41,198,053
3,493,276
48,898,054
16,147
143,461,797
2,849,891
273,377,531
Iberian Peninsula
RE Developer
Others
European Union (other)
RE Developer
Others
Other markets
Metallic Construction
Solar
RE Developer
At 30 June 2014 and 2013, the earnings before interest, taxes, amortizations, provisions and impairment losses (EBITDA), earnings
before interest and taxes (EBIT) and profit after tax by primary segments are as follows:
EBITDA
Metallic Construction
Solar
RE Developer
Others
PAGE 54
EBIT
PROFIT AFTER TAX
6M'14
EURO
6M'13
EURO
6M'14
EURO
6M'13
EURO
6M'14
EURO
6M'13
EURO
(2,661,395)
(16,027,944)
(14,023,254)
(26,634,551)
(21,881,203)
(36,944,277)
(12,149,621)
12,030,179
(14,832,848)
8,872,077
(16,861,135)
2,294,717
11,014,573
6,305,610
6,919,013
(8,736,859)
5,577,481
1,651,258
480,187
(4,218)
(331,269)
(949,880)
(5,100,035)
(15,678,762)
(3,316,256)
2,303,627
(22,268,358)
(27,449,213)
(38,264,893)
(48,677,064)
1H 2014 REPORT
The Group’s net assets and liabilities by operating segments at 30 June 2014 and 31 December 2013 are as follows:
ASSETS
LIABILITIES
30 JUNE 2014
31 DECEMBER 2013
30 JUNE 2014
31 DECEMBER 2013
Metallic Construction
357,498,061
331,230,804
327,573,301
307,847,934
Solar
197,127,580
254,606,180
138,372,305
180,727,147
RE Developer
167,051,822
166,932,839
48,474,697
44,917,163
Others
521,107,497
525,799,738
164,103,570
163,855,470
(490,096,094)
(490,796,517)
(48,552,603)
(49,266,682)
752,688,866
787,773,044
629,971,270
648,081,032
Intra-group eliminations
The amount of assets and liabilities at 30 June 2014 and 31 December 2013 above includes Non-current assets held for sale (see
Note 20).
The Group’s capital expenditures (acquisition of tangible and intangible assets) and amortizations, by operating segments, till 30
June 2014 and 2013, are as follows:
CAPITAL EXPENDITURES
AMORTIZATIONS
7,858,916
4,001,843
6M'14
EURO
3,385,560
Solar
532,963
3,787,966
1,300,164
RE Developer
602,334
1,248,577
3,297,196
Metallic Construction
Others
30 JUNE 2014
30 JUNE 2013
6M'13
EURO
3,606,263
1,503,192
2,644,974
4,842
45,435
811,457
945,662
8,999,055
9,083,821
8,794,377
8,700,091
6M'14
EURO
6M'13
EURO
Revenue from the sale of merchandise
11,668,551
71,403,406
Revenue from the sale of goods
57,380,119
60,704,723
Services rendered
74,413,127
143,461,797
141,269,402
273,377,531
6M'14
EURO
6M'13
EURO
Change in production
172,280
13,374,476
Own work capitalised
3,560,872
2,016,650
782,507
1,208,320
989,018
551,260
4. SALES AND SERVICES RENDERED
At 30 June 2014 and 2013, the breakdown of sales and services rendered is as follows:
5. OTHER OPERATIONAL GAINS
At 30 June 2014 and 2013 the breakdown of the caption ‘Other operational gains’ is as follows:
Reversals of impairment losses
Supplementary income
Capital Gains in non-financial assets
Foreign exchange gains
Other operational gains
1H 2014 REPORT
14,353,686
398,285
2,163,484
4,680,696
1,549,196
3,143,147
23,571,042
25,372,833
PAGE 55
st
The caption Change in production in 1 half 2014 is mainly related with works in progress in Brazil, in ‘Metallic Construction’ segment
st
(in 1 half 2013 it was related with solar projects in United States of America that were transferred for FTP Solar LLC in the end of
2013).
The amount included under the caption 'Own work capitalized’, during the period ended 30 June 2014 is related primarily with work
carried out in Brazil in the 'Metallic Construction’ segment.
At 30 June 2014 the caption ‘Capital Gains in non-financial assets’ includes the gain with the sale of 100% of shares of Rosa dos
Ventos Geração e Comercialização de Energia, SA by the amount of $R70,3m to the Brazilian company CPFL. The sale was
agreed by the entities at 18 June 2013.
6. COST OF GOODS SOLD
At 30 June 2014 and 2013 the cost of goods sold is as follows:
30 JUNE 2013
Opening balance
Purchases
Changes in the consolidation perimeter, currency exchange differences, transfers and others
Reclassification of assets
MERCHANDISE
RAW-MATERIALS,
SUBSIDIARIES AND
OTHER CONSUMABLES
TOTAL
6,557,447
10,825,365
17,382,812
41,623,887
75,893,609
117,517,496
907,203
812,221
1,719,424
6,416,400
-
6,416,400
Closing balance
13,455,391
14,760,746
28,216,137
Cost of goods sold
42,049,546
72,770,449
114,819,995
30 JUNE 2014
Opening balance
Purchases
MERCHANDISE
RAW-MATERIALS,
SUBSIDIARIES AND
OTHER CONSUMABLES
TOTAL
5,663,577
11,458,141
17,121,718
10,192,909
39,261,303
49,454,212
Changes in the consolidation perimeter, currency exchange differences, transfers and others
(648,090)
1,291,134
643,044
Closing balance
4,896,107
11,688,453
16,584,560
10,312,289
40,322,125
50,634,414
Cost of goods sold
7. SUBCONTRACTORS
At 30 June 2014 and 2013 the subcontractors is as follows:
Subcontractors
6M'14
EURO
6M'13
EURO
33,019,585
74,852,709
33,019,585
74,852,709
The subcontracts are related with construction works carried out, mainly in the ‘Solar’ and ‘Metallic Construction’ segments.
PAGE 56
1H 2014 REPORT
8. EXTERNAL SUPPLIES AND SERVICES
At 30 June 2014 and 2013 the external supplies and services are as follows:
Transportation of goods
6M'14
EURO
6M'13
EURO
3,741,812
10,604,892
Specialized works
12,003,018
16,168,990
Leases and rents
7,897,579
7,961,088
Service Fees
1,102,330
3,358,747
Travelling expenses
3,159,763
2,872,658
Electricity and Fuel
1,535,937
2,099,451
Insurance
1,842,920
1,714,001
Maintenance and repairs
1,016,629
939,339
Communications
692,139
865,571
Security
655,082
755,315
Legal and notarial fees
2,992,696
657,089
Commissions
1,025,096
516,303
Advertising
239,294
498,081
Cleaning, health and safety
302,996
322,668
Tools and devices
212,804
294,557
Office material
361,709
220,354
1,340,265
1,457,465
40,122,068
51,306,568
6M'14
EURO
29,516,674
6M'13
EURO
31,558,794
Other
9. STAFF COSTS
At 30 June 2014 and 2013, staff costs are as follows:
Salaries
Social contributions
8,096,061
9,483,713
37,612,735
41,042,507
The caption ‘social contributions’ includes mainly the social security contributions, the food and health subsidies, insurance costs
and dismissal compensation.
10. OTHER OPERATIONAL LOSSES
At 30 June 2014 and 2013, the caption ‘Other operational losses’ is as follows:
6M'14
EURO
2,298,654
6M'13
EURO
2,454,680
Trade debtors (Note 18)
159,377
2,165,848
Other impairment losses
-
1,182,554
98,223
1,466,635
Taxes
Impairment losses:
Losses in inventories
Losses in non-financial assets
3,225,811
10,664
Foreign exchange losses
1,416,941
4,133,926
-
209,725
Trade debtors write-off
Fines and penalties
944,440
243,027
Other operational losses
816,848
2,557,900
8,960,293
14,424,958
The amount in caption ‘Losses in non-financial assets’ refers mainly to costs with wind projects that were discontinued.
1H 2014 REPORT
PAGE 57
11. PROVISIONS AND IMPAIRMENT LOSSES IN FIXED ASSETS
The provisions and impairment losses during the first half of 2014 and 2013 were as follows:
6M'14
EURO
6M'13
EURO
-
4,658,577
37,933
-
Impairment losses
Goodwill
Financial Assets
In intangible assets
In tangible assets
-
892,255
598,403
12,097,355
636,336
17,648,186
234,866
450,103
Provisions (Note 24)
Arising from the use of the equity method
Quality guarantees
10,147
17,374
Legal claims in progress
37,756
1,603,992
9,238,620
1,333,094
9,521,389
3,404,563
Others
st
The increase of provisions in 1 half 2014 is mainly due to the booking of a provision in Martifer Construções related with a
compensation to be paid to Alstom according to the arbitration proceedings of Sostanj (Slovenia) and Manheim (Germany). This
st
compensation was established and paid in the end of 1 half 2014.
12. NET FINANCIAL RESULTS
The net financial results for the periods ended on 30 June 2014 and 2013 can be analysed as follows:
FINANCIAL INCOME
6M'14
EURO
6M'13
EURO
1,484,376
2,478,842
Loans and accounts receivable (including bank deposits)
- Interest income
Financial assets available for sale
- Dividend income
- Gains on the sale of financial assets
86,848
-
248,656
10,865,883
1,366,501
2,508,724
Other financial income related to other financial assets
- Foreign exchange gains
- Other financial income
FINANCIAL EXPENSES
875,706
991,337
4,062,087
16,844,786
6M'14
EURO
6M'13
EURO
13,842,154
16,645,873
Loans and accounts payable
- Interest expenses in bank loans and in finance leases
- Of which included in the acquisition cost of assets in progress
(17,072)
Available for sale financial assets
- Losses on the sale of financial assets
-
457,490
- Foreign exchange losses
347,700
3,276,378
- Other financial expenses
3,726,096
5,930,002
17,898,878
26,309,743
Other financial expenses related to other financial liabilities
The captions 'Foreign exchange gains / (losses)' are related to the occurrence of currency fluctuations, particularly in affiliated
companies out of Euro zone.
PAGE 58
1H 2014 REPORT
13. GAINS/ (LOSSES) IN ASSOCIATED COMPANIES AND JOINT
ARRANGEMENTS
At 30 June 2014 and 2013, the gains and losses on associated companies and joint-ventures are as follows:
Nutre Group (Note 20)
6M'14
EURO
6M'13
EURO
(165,962)
(11,562,083)
39,109
1,629,621
(126,853)
(9,932,462)
Others
14. INCOME TAX
At 30 June 2014 and 2013, the reconciliation between current tax and income tax of the period is summarized as follows:
Current tax
6M'14
EURO
6M'13
EURO
2,728,988
1,795,109
Deferred tax - generated by temporary differences
758,072
-
Deferred tax - reversal of temporary differences
(41,315)
1,304,634
(1,062,317)
(13,287)
Deferred tax - tax losses recognition
(215,923)
(1,215,113)
Correction to the tax of previous year
(37,610)
-
Other
(97,005)
(40,911)
Effect of changes in the income tax rate
Deferred tax
(696,098)
35,323
Income tax
2,032,890
1,830,432
15. EARNINGS PER SHARE
Martifer SGPS only issued ordinary shares, and as such, no shares have special voting or dividend rights.
Does not arise in Group any situation that may represent a reduction of earnings per share caused by options, "warrants"
convertible bonds or other rights attached to ordinary shares.
Therefore, at 30 June 2014 there were no differences between the basic earnings per share and the diluted earnings per share calculation.
The share capital of Martifer SGPS is represented by 100,000,000 ordinary shares, fully paid, representing a share capital of
Euro 50,000,000.
The weighted average number of shares outstanding is deducted of 2,215,910 treasury stocks acquired by Martifer SGPS.
At 30 June 2014 and 2013, the basic and diluted earnings per share can be summarised as follows:
Profit for the year (I)
Weighted average number of shares outstanding (II)
Basic and diluted earnings per share (I) / (II)
from continuing operations
1H 2014 REPORT
6M'14
EURO
6M'13
EURO
(30,491,243)
(50,146,924)
97,784,090
97,784,090
(0.3118)
(0.5128)
(0.3118)
(0.5128)
PAGE 59
16. FINANCIAL ASSETS UNDER THE EQUITY METHOD
At 30 June 2014 and 31 December 2013, financial assets under the equity method are as follows:
Prio Energy
SPEE 3 - Parque eólico de Baião, SA
SPEE 2 - Parque eólico de Vila Franca de Xira, SA
FTP Solar LLC
Promoquatro - Investimentos Imobiliários, Lda
Martifer Amal, S.A. (Portugal)
Martifer Amal, S.A. (Mozambique)
Canaverosa
Parque Sesena 1
Other
30 JUNE 2014
31 DECEMBER 2013
1,466,805
2,686,807
596,015
499,853
1,202,380
1,048,183
36,641,346
36,287,978
77,072
120,260
4,438
15,000
137,893
285,771
-
136,301
56,635
196,663
2,308
5,254
41,282,069
40,184,893
In the end of the 1st half of 2014 Martifer SGPS decreased its equity investment in Prio Energy SGPS to 5%. Since the company
maintains a position in the Board of that associate, and consequently significant influence exists, the consolidation through equity
method was kept.
At 30 June 2014 and 31 December 2013, the movement occurred in this caption is as follows:
Opening balance
Acquisitions
Application of the equity method
30 JUNE 2014
31 DECEMBER 2013
41,282,069
15,680,011
-
36,302,978
(1,447,600)
1,706,974
Decrease in share capital
-
(2,043,840)
Sales
-
(10,208,467)
Changes resulting from the loss of control in subsidiaries
-
4,900
353,368
(22,387)
Effect of foreign currency exchange differences
Other changes
(2,946)
(138,099)
40,184,893
41,282,069
30 JUNE 2014
31 DECEMBER 2013
Non-current financial investment
1,721,609
338,166
Others
178,140
1,899,749
237,457
575,621
Closing balance
17. AVAILABLE FOR SALE INVESTMENTS
At 30 June 2014 and 31 December 2013, available for sale investments are as follows:
At 30 June 2014 and 31 December 2013, the movement occurred in the caption ‘Available for sale investments’ is as follows:
Opening balance
30 JUNE 2014
31 DECEMBER 2013
575,621
2,310,267
Additions
1,562,227
306,925
Reductions
(249,866)
(235,268)
Reclassification to Non-current assets held for sale
-
(1,607,994)
Changes in the consolidation perimeter
-
(189,688)
11,765
(8,619)
1,899,749
575,621
Other
PAGE 60
1H 2014 REPORT
18. TRADE AND OTHER RECEIVABLES
The detail of the caption ‘trade and other receivables’, for the periods ended at 30 June 2014 and 31 December 2013 is as follows:
NON CURRENT
CURRENT
30 JUNE 2014
31 DECEMBER 2013
30 JUNE 2014
31 DECEMBER 2013
Trade receivables
30,642,554
29,132,168
107,774,291
123,985,850
Notes receivables
-
-
408,385
763,697
Cost:
Trade receivables:
Doubtful trade receivables
-
-
19,609,961
25,620,958
30,642,554
29,132,168
127,792,637
150,370,505
42,222,734
61,480,963
19,172,543
14,993,979
3,800
2,718
8,299,097
10,199,844
403,334
1,982,307
45,411,003
33,699,529
42,629,869
63,465,988
72,882,643
58,893,352
73,272,423
92,598,156
200,675,280
209,263,858
Other receivables:
Related companies
Advances to suppliers
Others
The caption of non-current ‘Trade receivables’ refers mainly to an amount to receive from an associate company, in the ‘Solar’
segment, which will be regularized as this company generates cash from the sale of energy. This receivable amount bears interests
at the market rate.
At 30 June 2014 and 31 December 2013, impairment losses in accounts receivables are as follows:
NON CURRENT
CURRENT
30 JUNE 2014
31 DECEMBER 2013
30 JUNE 2014
31 DECEMBER 2013
-
-
22,364,607
28,754,831
119,082
119,154
119,082
119,154
4,656,342
27,020,949
7,437,595
36,192,426
Carrying amount – trade receivables
30,642,554
29,132,168
105,428,030
121,615,674
Carrying amount - other receivables
42,510,787
63,346,834
68,226,301
51,455,759
Total
73,153,342
92,479,001
173,654,331
173,071,432
Accumulated impairment losses:
Doubtful trade receivables
Other receivables
1H 2014 REPORT
PAGE 61
19. OTHER CURRENT ASSETS
At 30 June 2014 and 31 December 2013, the breakdown of the caption ‘Other current assets’ is as follows:
30 JUNE 2014
31 DECEMBER 2013
Cost
86,315,107
102,714,982
Impairment losses
(4,990,722)
81,324,385
(5,769,831)
96,945,151
Accrued income:
Construction contracts
Carrying amount
Interest to be received
1,054,180
31,309
Other accrued income
4,359,150
4,225,822
86,737,715
101,202,282
Prepayments:
1,159,274
732,194
Financial expenses
590,553
533,108
Rents
383,023
485,044
Other prepayments
821,872
797,360
2,954,722
2,547,706
537,275
365,109
90,229,711
104,115,097
Insurances
Other (current) financial assets
20. NON-CURRENT ASSETS HELD FOR SALE
In December 2012, following the decision taken to close the Polish facility, an active plan was put into effect to sell Martifer Polska,
Sp. Zo.o’s land and factory, integrating the ‘Metallic Construction’ segment. Additionally, negotiations are underway for the sale of
the real estate project in Szczecin (Poland), previously classified as an investment property, with its sale being highly probable. The
Group continues committed to selling these assets. Thus, they are satisfied the conditions set by IFRS 5 to the maintenance of this
asset as Non-current asset held for sale for a period higher than 12 months.
In current year Martifer Group put into effect an active plan to sell the equity investment of 49% in Nutre SGPS. As the transfer of the
participation is highly probable, Group decided, under IFRS 5, classify the financial investment as Non-current asset held for sale and
stop the consolidation under equity method, as defined in IAS 28.
PAGE 62
1H 2014 REPORT
The breakdown of assets and liabilities of the business unit held for sale at 31 December 2013 and 30 June 2014 as follows:
31 DECEMBER 2013
Tangible Assets
22,048,574
Investment properties
5,002,006
Available for sale investments
1,357,067
Trade receivables
1,865,298
Other receivables
246
Current tax assets
3,060
Other current assets
Cash and cash equivalents
Total Non-current assets held for sale
Non-controlling interests attributable to Non-current assets held for sale
135,622
400,175
30,812,048
2,891,441
Non-current liabilities
Borrowings
10,889,344
Current liabilities
Trade payables
2,621
Other payables
255,297
Current tax liabilities
Other current liabilities
29,777
Liabilities related to Non-current assets held for sale
9,234
11,186,273
Assets net of liabilities and Non-controlling interests related to Non-current assets held for sale
16,734,334
30 JUNE 2014
Tangible Assets
6,398,825
Investment properties
5,063,602
Associated companies
19,600,000
31,062,427
Total assets held for sale
Liabilities related to Non-current assets held for sale
Assets net of liabilities and Non-controlling interests related to Non-current assets held for sale
31,062,427
At 31 December 2013 this caption included also assets and liabilities of entity Rosa dos Ventos Geração e comercialização de
Energias, S.A. which was already sold.
21. SHARE CAPITAL, TREASURY SHARES AND NON-CONTROLLING
INTERESTS
Share capital
Martifer SGPS, SA share capital, fully subscribed and paid at 30 June 2014, amounts to Euro 50,000,000 and it is represented by
100,000,000 bearer shares with a nominal value of 50 cents each. All shares have the same rights, including one vote per share.
During the first half of 2014 and 2013, no movements occurred in the number of shares of the Group.
st
During the 1 half of 2014 and 2013, Martifer SGPS, S.A. did not acquire any shares. The Group held 2,215,910 treasury shares,
corresponding to 2.22% of its capital.
At 30 June 2014, the share capital of Martifer SGPS, S.A. was held in 42.7% by I’M SGPS, S.A., 37.5% by Mota-Engil SGPS, S.A.,
and 2.22% are treasury shares. The remaining 17.58% represents free-float listed in Euronext Lisbon.
1H 2014 REPORT
PAGE 63
Non-controlling interests
Movements in the non-controlling interests are as follows:
30 JUNE 2014
30 JUNE 2013
Opening balance
39,676,431
50,975,912
Net profit of the year
(7,773,650)
1,469,861
Other changes in equity of subsidiaries
(3,933,247)
(223,581)
Changes in the consolidation perimeter
(2,891,441)
(74,149)
Transactions with non-controlling interests
(7,655,735)
745,067
Others
1,207,220
-
18,629,578
52,893,110
The detail of the main non-controlling interests can be analysed as follows:
% NON-CONTROLLING
INTERESTS
30 JUNE
31 DECEMBER
2014
2013
30 JUNE
2014
31 DECEMBER
2013
29,974,130
Martifer Solar, S.A.
45.00%
45.00%
28,516,728
Martifer Metallic Constructions SGPS, S.A.
25.00%
-
14,409,396
-
Martifer Solar Itália
45.00%
45.00%
2,672,007
3,596,695
Silverado Fund LLC
68.58%
68.58%
2,718,844
2,724,069
Martifer Solar França
45.00%
45.00%
1,730,870
1,707,199
Martifer Solar Bélgica
45.00%
45.00%
1,556,082
1,647,949
M Prime
45.00%
45.00%
1,525,674
1,519,716
Martifer Solar Inc.
45.00%
45.00%
(2,921,393)
(2,114,444)
Martifer - Alumínios, S.A.
25.00%
-
(3,139,144)
-
MTS Solar sistemas Solares S.A.
45.55%
45.00%
(3,314,100)
(1,902,566)
Martifer Aluminium Pty, Ltd
25.00%
-
(3,718,589)
-
Martifer Solar USA
45.39%
45.39%
(7,629,484)
(4,995,559)
Martifer - Construções Metalomecânicas, S.A.
25.00%
-
(14,849,818)
-
1,072,505
7,519,242
18,629,578
39,676,431
Others
The non-controlling interests at 30 June 2014 reflect the impact of the reduction of the equity investment in Martifer Metallic
Constructions, held by Martifer SGPS from 100% to 75%, in result of the increase of equity in this company by the new shareholder
Vector Diálogo SGPS, SA.
22. BORROWINGS
At 30 June 2014 and 31 December 2013, borrowings can be analysed as follows:
Bank loans
57,100,333
BETWEEN 1 AND
3 YEARS
46,334,767
Bank overdrafts
15,808,078
-
707,711
1,808,595
18,324,384
Authorized overdrafts
42,592,133
412,160
4,395,956
10,135,017
57,535,266
Commercial paper
8,000,000
3,000,000
3,250,000
-
14,250,000
Other borrowings
10,251,178
1,712,287
1,926,745
2,656,515
16,546,725
133,751,722
51,459,214
101,493,609
69,889,947
356,594,492
31 DECEMBER 2013
UNTIL 1 YEAR
BETWEEN 3 AND
5 YEARS
91,213,197
MORE THAN 5
YEARS
55,289,820
249,938,117
TOTAL
Obligation under finance leases
18,274,697
Cash and cash equivalents
38,843,709
Derivatives
Net debt
PAGE 64
224,214
335,801,266
1H 2014 REPORT
UNTIL 1 YEAR
BETWEEN 1 AND
3 YEARS
BETWEEN 3 AND
5 YEARS
MORE THAN 5
YEARS
TOTAL
Bank loans
47,027,474
48,560,430
103,418,502
51,653,631
250,660,037
Bank overdrafts
20,088,289
89,649
268,946
2,241,220
22,688,104
Authorized overdrafts
37,916,505
558,069
2,799,207
11,864,463
53,138,244
Commercial paper
9,500,000
3,000,000
1,750,000
-
14,250,000
Other borrowings
13,783,977
11,242,040
1,574,601
2,213,763
28,814,381
128,316,245
63,450,188
109,811,256
67,973,077
369,550,766
30 JUNE 2014
Obligation under finance leases
17,769,913
Cash and cash equivalents
36,984,807
Derivatives
(226,853)
Net debt
350,562,725
The Group continues focused on reducing net debt, as such, it continues committed to the process of selling non-core assets,
especially wind farms, solar projects and, residually, real-estate projects, during 2014.
23. TRADE PAYABLES AND OTHER PAYABLES
At 30 June 2014 and 31 December 2013, trade payables and other payables can be analysed as follows:
NON CURRENT
Trade payables
Fixed assets suppliers
Related companies and other shareholders
Advanced payments received from customers
CURRENT
30 JUNE 2014
31 DECEMBER 2013
30 JUNE 2014
31 DECEMBER 2013
12,304,469
11,972,874
100,177,136
130,031,422
134,959
-
704,696
1,016,400
7,450
421,870
3,189,770
3,648,374
16,532,026
-
-
17,066,509
Other creditors
3,916,380
1,330,346
11,941,376
7,654,569
Other payables
4,058,789
1,752,216
32,902,351
28,851,369
16,363,257
13,725,090
133,079,487
158,882,791
Total
The balance of non-current ‘Trade payables’ is related, mainly, with retentions in works performed by external parties, which will be
released after the period of guarantee.
At 30 June 2014 and 31 December 2013, the non-current balances due to related companies and other shareholders refer to loans
obtained from joint-arrangements and associated companies, which bear interest at Euribor 3M increased by a 6.75% spread.
24. PROVISIONS
The information related with ‘Provisions’ as of 30 June 2014 and 31 December 2013 can be detailed as follows:
30 JUNE 2014
31 DECEMBER 2013
Quality guarantees
3,325,690
3,335,399
Legal claims in progress
1,476,789
1,553,532
Provisions arising from the use of the equity method
Others
5,831,638
11,848,870
22,482,987
1H 2014 REPORT
5,450,401
11,987,549
22,326,882
PAGE 65
The change in the Provisions, compared with 31 December 2013, is as follows:
OPENING
BALANCE
ADDITIONS
DEDUCTIONS
Quality guarantees
3,335,399
80,204
(70,057)
-
CHANGE OF
CONSOLIDATION PERIMETER,
EXCHANGE RATE
DIFFERENCES, TRANSFERS
(19,857)
Legal claims in progress
Provisions arising from the use
of the equity method
Others (Note 11)
1,553,532
43,042
(5,286)
(131,962)
17,462
1,476,789
5,450,401
234,866
-
-
146,372
5,831,638
11,987,549
9,392,980
(154,360)
(9,408,732)
31,433
11,848,870
22,326,882
9,751,092
(229,703)
(9,540,694)
175,410
22,482,987
APPLICATIONS
CLOSING
BALANCE
3,325,690
25. OTHER CURRENT LIABILITIES
At 30 June 2014 and 31 December 2013, other current liabilities are made up as follows:
30 JUNE 2014
31 DECEMBER 2013
Holiday pay and bonuses
7,767,322
5,867,390
Interest borne but not yet overdue
4,852,690
3,922,237
Production performed by third parties not yet invoiced
2,648,146
4,865,198
Accrued expenses
Other accrued expenses
10,663,035
7,377,052
25,931,193
22,031,877
Deferred income
Production invoiced and not yet performed (related to construction contracts)
16,800,966
20,350,406
Subsidies / Government grants
1,738,380
1,753,735
Other deferred income
3,166,559
2,691,439
21,705,905
24,795,580
47,637,098
46,827,457
The caption "Other accrued expenses" includes supplies and services rendered up to 30 June 2014 whose invoices were received
after this date.
26. CONTINGENT LIABILITIES
There are no significant changes to the disclosed in the notes to the financial statements for the period ended 31 December 2013,
with the exception of arbitration proceedings of Sostanj (Slovenia) and Manheim (Germany) which were already solved (Note 11).
27. COMMITMENTS
The nature of the Group's commitments did not change in comparison with 31 December 2013.
28. RELATED PARTIES
Group companies have commercial relations with each other that qualify as related parties transactions. All of these transactions
are performed on an arm’s length basis.
PAGE 66
1H 2014 REPORT
Consequently, all these transactions are eliminated, since the consolidated financial statements disclose information regarding the
holding company and its subsidiaries as if they were a single entity.
The balances resulting from transactions performed with associate and jointly controlled companies, accounted through the equity
method, are not eliminated. The amount of the balances not eliminated is approximately Euro 84,000,000, with special regard to the
accounts receivable from Nutre Group which amount to Euro 58,900,000, which does not bear interest and has no defined
reimbursement period. This amount is net of Euro 39.3 million relating to the application of the Equity Method over the 2010 through
30 June 2014 periods and impairment loss recognized.
Besides current transactions, some relating to civil construction done with the Mota-Engil Group and others associated with real estate
management projects under way done by Estia Group, there are not any other significant balances and transactions performed with
related parties during the period ended 30 June 2014, that had affected significantly the financial position or performance of the Group.
29. SUBSEQUENT EVENTS
Since the date of financial statements until the present date the following subsequent events occurred:
Most of assets of Martifer Solar USA INC sold to BayWa
st
On 1 July, the development of the Chapter 11 process, initiated by Martifer Solar USA INC in January, led to the court of Nevada
to approve the sale of most assets of Martifer Solar USA, Inc. to the proponent BayWa by 7,6 million USD. The result of the sale is
framed with the book value of assets.
Martifer SGPS agrees the transfer of its shareholding held in Nutre SGPS
rd
Martifer SGPS has decided, during the first semester of 2014, to sell the participation held in Nutre SGPS, SA. During the 3
quarter of 2014, following a proposal of investment presented by Orchadia, S.A. group, it was agreed the transference of the shares
held in Nutre SGPS, SA. The transfer is still subject to the accomplishment of several conditions (including, amongst others,
decisions of Public and Governmental Authorities). The amount of the transfer is in line with the value of the financial investment.
Consortium Ventinveste incorporates Âncora Wind society to develop 171MW of wind projects
In July 2014, it was incorporated Âncora Wind - Energia Eólica, S.A, aimed to establish the partnership between Ventinveste, SA
and Ferrostaal GmbH for the development of wind projects totalling 171 MW, within the consortium Ventinveste, with plans to start
the construction after the financial closing, which is expected for the end of 2014.
30. APPROVAL OF THE FINANCIAL STATEMENTS
The accompanying consolidated financial statements were approved by the Board of Directors on 27 August 2014.
1H 2014 REPORT
PAGE 67
31. EXPLANATION ADDED FOR TRANSLATION OF THE FINANCIAL
STATEMENTS
These financial statements are a translation of the consolidated financial statements originally issued in Portuguese in accordance with the
International Financial Reporting Standards as adopted by European Union. In the event of discrepancies, the Portuguese version prevails.
Oliveira de Frades, 27 August 2014
The Chief Accountant
The Board of Directors
__________________________________
__________________________________
Isabel Cristina Loureiro Silva
Carlos Manuel Marques Martins
__________________________________
Jorge Alberto Marques Martins
__________________________________
Mário Rui Rodrigues Matias
__________________________________
Arnaldo José Nunes da Costa Figueiredo
__________________________________
Luís Filipe Cardoso da Silva
__________________________________
Luís Valadares Tavares
__________________________________
Jorge Bento Ribeiro Barbosa Farinha
PAGE 68
1H 2014 REPORT
Baixar