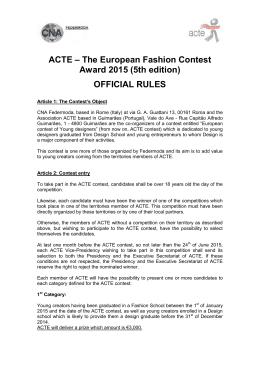
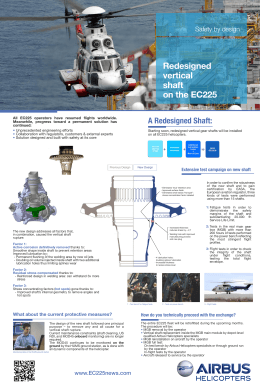
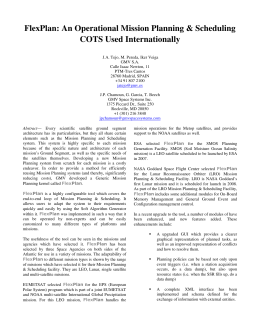
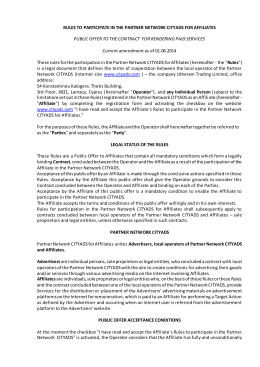
ARRL 10 Meter Contest 2013 Results T By Scott Tuthill, K7ZO "Wow!!! Ol Sol is back" -- Sandy K4PZC After a disappointing 2012 edition it was hard to know what to expect in 2013. Throughout the middle part of 2013 solar conditions continued to decline. Then to the surprise and delight of all, conditions made a sharp turn upward in October. Cycle 24 headed for a second peak just in time for the late 2013 contest season including the 41st ARRL 10 Meter Contest on December 14-15. Whereas solar flux was in the 90-100 range leading up to and during the 2012 contest it soared into the 150-160 range just in time for the 2013 event. From a solar conditions standpoint these were better than what we had during 2011 and represented the best conditions of Cycle 24 for the 10 Meter Contest. Not since the peak of Cycle 23 in 2001-2002 have we experienced conditions like this. And, to once again to prove the adage that on 10 meters "Propagation makes Participation," contesters, DXers, and every one of all interests hit the airwaves. A total of 4,959 participants turned in logs, the second highest number ever. Everyone that got on the air found plenty of folks to work, showing once again that the ARRL 10 Meter Contest is just plain fun! Activity Part of the enjoyment of 10 meters is that low power and small antennas generate contacts far and wide. Whether operating competitively or just for the fun of it, when 10 meters is open the band is a great place to hang out. During 2013, 10 meters delivered to the faithful all the fun they could handle as can be seen in Figure 1 above. These are maps of 10 meter QSOs from EA6VQ's DXMAPs web site (www.dxmaps.com). Each map shows reported QSOs on Saturday from 1640 to 1700 UTC – a mass of lines between North America and Europe indicating the wide open path. That was fun wasn't it? Note that on the 2012 map these same lines were largely missing. 2014 ARRL 10 Meter Contest Does this mean that 2013 was more fun than 2012? You be the judge. Submitted logs tell part of the story. In 2013 the average log contained 362 QSOs which is almost double that from 2012. If making QSOs is fun then it looks like fun was had by all. With the band providing opportunities, operators worldwide jumped at the chance to get on the air. Though fun at its best, 10 meters is also fickle and who knows when conditions will be this good again – 2014? 2024? You just don't know. Everyone who took advantage of 2013 conditions can look back and know they didn't miss anything. As Ken VY2TT related in his post-contest soapbox: “If sunspots are doing a double peak and then doing a vanishing act, and this is my last great conditions for a 10 meter contest, I can die happy. The band was great. There were times just past mid day local that Western Europe and Western U. S. were equally loud.” Operators worldwide submitted 4,959 logs, the second most ever, containing 1.8 million QSOs. Only the 2011 contest during the first peak of Cycle 24 exceeded 2013 when 5,361 logs containing 1.9 million QSOs were submitted. For further comparison, 4,196 logs with 2.2 million contacts were submitted for the all-band 2013 ARRL DX CW contest. What this means is the 10 meter band was a really busy place over the contest weekend. Operators who got on the air made a whole bunch of QSOs. Incredibly, the average QSO rate over the 48-hour contest period was 10 QSOs per second just from the logs that were submitted! (It is likely there were another 750,000 QSOs made by operators who did not submit logs.) The average log contained 362 QSOs this year compared to 181 last year and 363 and 153 in 2011 and 2010, respectively. 2,399 logs were submitted from U.S., Canadian, and Mexican (W/VE/XE) stations and 2,551 from DX Extended Results – Ver 1.02 Page 1 of 27 locations, representing 37% and 95% increases, respectively, from 2012. Yes, as Figure 2 clearly shows, "Propagation makes Participation!" DX logs represented 52% of all logs submitted, another highest percentage ever. This demonstrates the worldwide interest in 10 meters and that the 10 Meter Contest is really a global event - at least in the years propagation makes it possible. Figure 2 – Logs submitted by year As far as operating categories, the Single-Operator, Low Power categories (CW, Phone, and Mixed Mode) continue to be the most popular making up just under half of all log submissions. This is followed by Multioperator and Single-Op, High Power with 25% and 21% of the entries respectively. QRP enthusiasts make up 7% of the logs submitted. CW categories were most popular followed by Phone, Multioperator, and Mixed in declining order. After capturing its first lead back in 2010, in three of the last four years CW has been the top category. CW’s popularity is likely in part driven by the increased participation from DX stations. In a worldwide contest, if an operator does not feel their English skills are good enough to operate on Phone, CW becomes a common language. Call signs and exchanges are spelled out so that you just need to copy them into a log. Back in 2011 the Multioperator, Low Power (MOLP) category was created. Filling dual roles as both a true Multioperator and as Single-Operator, Mixed Mode with spotting assistance, its popularity continues to grow with 564 logs submitted worldwide. This is the highest total ever and essentially doubles the total number of MOLP logs from 2012. Overall growth in Multioperator categories has been quite dramatic over the past several years. In 2005 and 2006 Multioperator entries made up only 8% of logs submitted. They now make up 25% of logs submitted and for the third year in a row outnumbered Single-Operator, Mixed entries. It looks like this trend is here to stay. Looking around the world, logs were received from 270 different DXCC entities and W/VE/XE sections, a huge increase over last year’s 221. It also easily exceeded the 2011 total of 230. The ARRL 10 Meter Contest is a truly a global event that generates interest even where ham population is low. A total of 38 DXCC entities were represented by a single log. On the other hand, more logs were received once again from those quintessential contesters in Japan, with 275, than any other DX location. They were followed by Germany with 201 logs and European Russia with 185 logs. Last year's second place holder, Brazil, dropped to fourth even though the number of logs from there increased to 132 from 123 in 2012. Brazil simply got passed by the other countries who had huge increases in logs submitted. For instance in 2012 operators in Germany submitted just 51 logs. Their total of 201 logs in 2013 is almost 4 times greater. Looking for the most active W/VE/XE sections, honors goes to Minnesota with 104 logs received, followed by Ohio with 81, while Maryland/DC and Virginia each had 78. On a statewide basis, both California with 211 logs submitted and New York with 120 would beat Minnesota but each of those states is broken up into multiple sections. Several states more than doubled their number of logs submitted over 2012. These were: Alaska, Arkansas, Hawaii, North Dakota, Oklahoma, and Wyoming. If you felt some of these rare states were easier to get into the log in 2013, they were! Looking again at Minnesota it is notable that they have less than half the ham population of Ohio. So they were out in force. Credit for this high participation has to go to the very active Minnesota Wireless Association. Also, if you live in Minnesota, the second weekend in December is a pretty good time of the year to be inside and on the radio! Figure 3 — ARRL 10 Meter Contest operating category trends. 2014 ARRL 10 Meter Contest A contest participation metric based on the percentage of a state's ham population that submitted a log provides a insightful perspective on the contest. Using this metric, Extended Results – Ver 1.02 Page 2 of 27 the US states with the highest log submission rates were: Minnesota, New Hampshire, Maryland, Delaware, and Massachusetts. All of these states have active contest clubs that organize and motivate their members to get on the air. Each member can also contribute to a combined club entry in addition to an individual submission. In many cases it is the sheer number of club members submitting logs that is enough to take top honors in a club category. See the Club Competition section for more details. Who were the most energetic and active contesters? Which operators sit down, keep their butts in the chair, and make a large number of contacts? Looking at those entities from which five or more logs were received, 2013 honors go to the Virgin Islands. The six logs submitted from KP2 averaged 1,899 QSOs each – a great effort from KP2/K3TEJ, KP2DX, NP2L, NP2N, NP2P (N2TTA), and NP2X that was way above the 362-QSO average. In second place was last year's leader, Uruguay, with 6 logs averaging 1,143 QSOs. Third place went to Colombia with 6 logs averaging 1,003 QSOs. Fourth place was captured by a great showing from Montana, turning in 12 logs averaging 870 QSOs and rounding out the top five was Canada's Maritimes with 13 logs averaging 842 QSOs. The performance by Montana and the Maritimes, and likely some of the Virgin Islands', can certainly be credited to the great propagation we had this year supporting long distance QSOs on east-to-west paths. In years with poorer propagation the impacts of the relatively strong north-south propagation favor stations in South America. In the northern hemisphere are thousands of DX-hungry operators. In the southern hemisphere are far fewer operators who, when they got on the air, have solid propagation and attract a great deal of attention since they are among the few DX stations audible in the Northern Hemisphere. All they have to do was just stay on the air and they filled their logs. A Blizzard of New Records Some of us contest for the fun and some of us for the competition. The real Type A personalities target setting a new all-time record. What this says is, not only do we want to compete against everyone in this year's contest but we want to take on everyone in all the years back to when this contest started in 1973! Then again, maybe some of us just sit down to operate and make as many QSOs as we have fun making and "what do you know," we set a new record. With 2013’s conditions, you just knew a whole bunch of records were going to be set –and were they ever! A total of 339 new all-time records were set at the DXCC entity 2014 ARRL 10 Meter Contest and W/VE/XE section level. One in every 15 logs represented a new record! Taking the challenge up one notch to the continental and W/VE/XE division level a total of 45 new records were set. This means that about 20% of the continental and W/VE/XE division level records were set in 2013. And, moving up into that rarefied air of all-time category records, there was even one of those set during 2013. I will come back to that later. For now let's take a look at the 339 DXCC entity and W/VE/XE section records set in 2013. Thanks to the hard work and herculean efforts of Ken WM5R a full set of all-time ARRL 10 Meter Contest records is available at www.arrl.org/contests. These records go all the way down to the W/VE/XE section level as well as each individual DXCC entity and cover all 11 entry categories. So, if you want to know the Single-Op, High Power, Mixed record for your section or country, it is in there. Take a look. Of the 339 records, 183 were in DXCC entities and 156 were in W/VE/XE sections. 119 were High Power records, 171 were Low Power records, and 49 were QRP records. The four new Ontario sections continue to be the source of many new records. Of the 44 possible records in those four sections there are now records in 31 of them and 26 of those were set in 2013. Only 5 records remain from their inaugural 2012 contest. In fact just about every second Ontario log represented a new record! I’ll bet that does not happen again anytime soon. Another fascinating aspect of the new DXCC entity and section records set in 2013 is that 84 of them were in the MOLP category, fully 55% of all MOLP records. The next closest category was Multioperator, High Power where 20% of all records were set in 2013. These 84 MOLP records represented 25% of the all new records and they came from a group of operators that made up only 11% of the logs submitted. Talk about overachievers! The interesting question is why were so many MOLP records set? It is not that the category is that new because 2013 was the third year of its existence. Only seven of the 84 records represented an initial record for that entity or section, so most of the new records came from someone beating an old record. The first year of the MOLP category was in 2011 which also had great conditions, so scoring should have been good in 2011 as well. Perhaps it is because CW Skimmer (www.dxatlas.com/cwskimmer) technology has advanced since 2011, making it easier to build a multiplier total as a low power station? Perhaps it is because more MOLP operations are true multioperator Extended Results – Ver 1.02 Page 3 of 27 versus the single-operator with spotting assistance style? Let's compare the top 50 MOLP operations from 2011 with the same group in 2013. As a group, the top MOLP stations really did increase their scores over 2011. For comparison, across all logs submitted in all categories 2013 scores showed a 3% increase from 2011, so the top MOLP stations really were overachievers. More of their score increase was due to an increase in QSOs than an increase in multipliers. Table 1 - Multioperator Low Power Comparisons Top 50 Worldwide Year 2011 2013 Avg. QSOs 883 1,028 % Change 2011 to 2013 16% Avg. Mults 173 194 12% Avg. Score 528,238 669,347 26% Nr True Multiops 25 26 4% While spotting reports from CW Skimmers may have helped, it is not likely a driving factor behind the scores. More likely, it was the 40 more multipliers active in 2013 than in 2011, which helps both Multioperator and Singleoperator Unlimited. If there was a large change in the number of multioperator stations, more "Butt in Chair" time could have driven higher scores, but it was not that either. What was it then that led to so many new MOLP records in 2013? Other than guessing the group was just out to set new records and simply dedicated themselves to the goal, it is hard to say. This will go down as one of the mysteries of the 2013 ARRL 10 Meter Contest. Mexican operators continue to set new records with relative ease and 23 new XE all-time records were set in 2013 from the 34 submitted logs. If you want your name in the record books, XE is the place to go to. Of the 352 possible all-time records in the 32 XE states only 88 have a record on the books. Which means: "You operate, you get your call in the record listings!" Within W/VE/XE a total of 32 new division records were set in 2013, up from 5 in 2012 but still below the 50 set in 2011. All divisions saw at least one new record except for Southeastern, New England, and Dakota. The Rocky Mountain Division saw four new records set and the Northwestern and Southwestern three each. Perhaps conditions were especially favorable in that part of the US this year. Also new records were set in all operating categories except for Single-Op, Low Power, Phone. Two new records displaced 23-year-old records from two solar cycles ago. N9RV set a new MOHP record in the Northwestern Division and KØRF set a new MOHP record in the Rocky Mountain Division. 2014 ARRL 10 Meter Contest Looking at all-time division records, 60 have been set during this solar cycle, 17 of which were initial records in MOLP. For comparison, 106 records still exist from the last solar cycle from 1998 through 2003 and 19 still exist from two cycles ago in 1988 through 1992. As much as anything this demonstrates that while we certainly have enjoyed the peaks of Cycle 24, conditions were much better back in Cycles 23 and 22. On the DX front, 13 new continental records were set, up from 2 last year but still down from 15 in 2011. All continents showed at least one new record except for Antarctica. Operators in Africa were particularly busy this year with four new records set. Finally, the great conditions in 2013 resulted in one new all-time category world record. D4C, piloted by Max, IZ4DPV, set a new all-time world record in the SingleOp, High Power, Phone category. Max just squeezed by D44TD (I4UFH, op) 2002 record by a couple of percent. He actually had fewer QSOs than the old record but made up for the difference with 17 more multipliers. Max described his effort as follows: “After the experience of CQWW SSB contest in October and the band conditions I decided to face alone the ARRL 10 Meter Contest as a single operator. I analyzed 10 meter logs make all the feedback on the schedules of the band with the possible increase of sunspots in December. With prospects of intense conditions and make for an excellent result and thus exceeding the record still unbeaten by Fabio I4UFH from 2002 with the call D44TD! Right away I realized that for the favorable conditions by D4C 36 hours available were few and difficult to manage since the night openings with the Pacific area and JA long path! I started with all the data and the various solutions depending on times to test the band and take the last final decision and then implement it during the contest. “At the beginning of the contest conditions were really extreme, strong signals from the West Coast (W6 / 7) and Pacific area above S9 +10dB, amazing! There was excellent propagation during the first day with strong signals to both Europe and towards the United States! The second day had much worse conditions, band noise and QRM difficulty listening to Europe and the United States! Thanks to the stations that I worked at night and in particular E6RQ and FK8CP being very strong and unexpected, thanks guys! “As far as the final score it was really unexpected, considering the conditions. My target was to reach 4,000 QSOs but on Saturday evening I had already 2,824 QSOs in the log and so I tried to keep the rate! Thanks to the Extended Results – Ver 1.02 Page 4 of 27 setup and the conditions I reached the record on Sunday evening thanks to the many American stations from the West Coast with signals above the S9 +25 dB! “Thanks to all the stations that have called me. A special thanks goes to a silent key who two months ago helped me to fix the generator for D4C! Without his help, the team contest CQ WW SSB and CW including ARRL 10 Meter would not have been possible.” Max's record is now the second world record from the D4C station. In 2011 the MOHP record was set from that station. Looking at Figure 4 you can see that their 10 meter antenna configuration and QTH is really amazing! Figure 4 — The D4C 10 meter antennas (Photo – IZ4DPV) Top Ten - US Single Operator, Mixed Mode, QRP K9OM N1CC WA6FGV N1IX NK8Q WB2AMU KE5SNJ (AC5O) N2XP KU4A NS7K 556,356 400,760 293,388 247,632 207,284 161,916 123,384 98,820 98,440 48,772 Single Operator, Phone Only, HP NR5M W5PR NC1I (K9PW) K5TR (WM5R) N4OX W1SJ W3LL K4NV WU2X KB8U 818,736 744,892 648,240 614,040 606,504 572,934 495,360 489,600 468,692 465,740 Single Operator, Phone Only, LP KB3WD N7FLT WD4IXD WB5R WW5TT K4PZC K7ULS KA7PNH K6GHA WS7V 256,872 252,700 181,106 174,932 171,958 126,566 124,336 121,584 119,952 117,040 Single Operator, Phone Only, QRP KE2OI 138,828 NDØC 78,660 N1YWB 64,092 KB5KYJ 47,872 KS4GW 40,592 NT4TS 37,800 KKØQ 37,440 N9FRY 35,280 W2WGK 22,932 KK7EL 14,800 Single Operator, Mixed Mode, HP KQ2M N8OO K6LL N4PN W1VE WØAIH (NE9U) KØTT NN1N WB9Z AB3CX 2,783,836 2,052,452 2,029,520 1,876,980 1,868,064 1,719,210 1,594,240 1,515,786 1,445,642 1,381,224 Single Operator, CW Only, HP K8AZ (K8NZ) NY3A KD4D KI1G N5RZ K5NA (K5OT) N3RS WJ9B KH7Y N2KW 1,424,528 1,359,252 1,335,040 1,251,872 1,218,820 1,217,216 1,106,616 1,056,372 1,034,208 1,006,056 Single Operator, Mixed Mode, LP N2IC N8II KU2M N5DX K6AM W3EP K1HTV KTØK N6ZFO K7SS 1,652,876 1,269,432 1,245,692 1,136,336 1,026,344 934,284 899,596 804,000 785,510 745,348 Single Operator, CW Only, LP K1TO WA1Z W3BGN W2UP NA8V K9WZB N5DO N4WW (N4KM) WØUO WB4TDH 1,016,776 878,592 813,852 754,068 637,872 612,560 606,044 601,140 572,448 567,600 2014 ARRL 10 Meter Contest Extended Results – Ver 1.02 Page 5 of 27 Single Operator, CW Only, QRP KH7M (KH6ZM) W6JTI NØUR AA1CA W1WBB KØLUZ W9OP W6QU (W8QZA) KT8K K2SM Single Operator, Phone Only, LP VA7AM VO1KVT VE2HIT VE3TU VE9ZZ VE1ZD VE3KKQ VA3GD VE3FCT VE7EMI 307,644 273,568 266,112 243,800 208,120 204,600 180,960 172,400 144,936 129,904 Multioperator, HP K1LZ KØRF NX5M N9RV W7RN W4UH N6RZ N7DD N1RR (@K6ND) W6YX 3,569,956 2,841,960 2,803,744 2,311,184 2,278,348 2,238,520 2,099,692 2,074,800 2,054,360 1,984,422 Multioperator, LP KH6LC KD2RD NØNI W7TVC KØUK NA5NN WL7E WA1F K2DFC N1EN 1,780,660 1,497,048 1,478,816 1,125,252 696,654 601,012 596,520 420,110 390,220 385,700 Single Operator, Phone Only, QRP VA3VF VE7GNR VE7KA VE3BKM VE3KJQ Top Ten - Canada Single Operator, Mixed Mode, HP VY2TT 2,459,142 VE3KZ 890,736 VE4VT (VE4EAR) 475,104 VE3BW 376,176 VE7AX 230,652 VE3YT 61,912 VE1JS 47,500 Single Operator, Mixed Mode, LP VE4EA VE1ZA VE2AWR VE4YU VY1EI VE3FH VE3TW VA3KAI VE8GER VE2BWL 630,938 496,856 353,916 313,170 240,964 173,698 144,946 140,616 125,856 105,360 Single Operator, Mixed Mode, QRP VE6EX 295,800 VA3RKM 42,924 Single Operator, Phone Only, HP VA5DX VE2GSO VE6FI VE6CMV VA2QR VE3EDY VA3XH VE7TJF VE2JM 2014 ARRL 10 Meter Contest 160,776 157,248 123,200 64,600 61,800 58,990 43,648 32,996 22,936 21,594 566,432 106,552 60,610 42,606 31,800 16,660 16,124 5,928 4,340 Extended Results – Ver 1.02 11,316 6,290 4,464 2,184 1,932 Single Operator, CW Only, HP VE7JH VE5UF VE3OI VE3EY VE3PN VE3EJ VA7OM VE7IO 1,007,304 768,296 351,648 308,252 298,368 294,360 232,220 109,344 Single Operator, CW Only, LP VE3DZ VE6WQ VE5ZX VO1QU VE3GFN VE3FJ VE7JKZ VA3ATT VE1RSM VE5GC 765,576 626,416 413,820 290,476 211,152 157,504 148,456 142,128 129,168 114,408 Single Operator, CW Only, QRP VE5VA VY2OX VE3GTC VA1MM VA7KH VE3DQN VA7AD VE3IGJ 138,380 133,824 103,544 33,280 18,424 6,336 3,528 120 Multioperator, HP VE9AA VE1OP VE5MX VE3CX VA3DDX VA2WA VE3MMQ VE3NZ VE2SG VE3MIS 2,173,000 1,626,096 1,203,482 1,134,080 814,472 781,264 706,002 389,080 260,864 260,496 Multioperator, LP VE4GV VA7BEC VA7DZ VE5UO VE7CA VE3XAT VE9ML VE3KI VE3CWU VE2AXO 1,075,648 600,264 264,224 175,718 173,740 141,988 133,140 127,512 108,720 73,528 Page 6 of 27 Single Operator, Mixed Mode, LP CT9/R9DX 2,201,000 NP4DX (WP3C) 1,627,152 LO5D (LU8EOT) 1,262,976 JG1AVO 769,792 HGØR (HAØNAR) 748,500 S51YI 628,824 CR5A 611,072 EF8O 603,288 PY2NY 495,000 RU4AA 440,200 Top Ten - Mexico Single Operator, Mixed Mode, HP 4A1TD 53,286 Single Operator, Mixed Mode, LP XE1/AAØAA 18,972 Single Operator, Mixed Mode, QRP XE2ES 1,872 Single Operator, Phone Only, HP XE1B XE2K XE2HUQ XE1REF XE2KEC 701,820 507,408 299,750 76,700 8,284 Single Operator, Phone Only, LP XE3/K5ENS XE1SDK XE2AA XE1HG XE1AO XE1ZTW XE3D XE1AJ XE2ML XE2PXZ 440,244 142,760 141,950 80,008 42,592 15,336 8,944 7,920 5,328 4,774 Single Operator, Mixed Mode, QRP YW2LV (YV5YMA) RT4W LY7Z RU9CD RW3AI 9A2EY DK1IZ SM6PPS DU7/N7ET DL/W6ZBA Single Operator, Phone Only, HP D4C (IZ4DPV, op) 1,885,290 V55V (DJ2HD) 1,055,982 LP1H (LU5HM) 1,026,270 YN5Z (K7ZO) 885,430 GM5X (GM4YXI) 804,228 TMØT 750,380 OK7K (OK1BN) 721,712 DL2ARD 719,280 CR6K (CT1CJJ, op) 657,580 9A5Y (9A3LG, op) 582,080 Single Operator, Phone Only, QRP XE2JS 161,376 XE2MBE 2,064 CW Only, HP XE1MM XE2S Single Operator, CW Only, LP XE2YWH XE1AY Single Operator, CW QRP XE1GXG 567,472 493,848 Single Operator, Phone Only, LP PJ4DX KP4EU PY2UD HI3K CO6LC ZZ2T (PY2MNL) PU5FJR HA4XH LU7DH EU6ML 12,060 6,032 9,792 Multioperator High XE2CQ XE1EE XE2B 476,286 155,800 1,204 Multioperator Low XE2AU XE3N XE2FGC 57,380 17,710 3,952 598,142 467,646 443,292 410,328 409,250 355,038 317,124 261,750 220,248 216,176 Single Operator, Phone Only, QRP EA7KB YO8SSB CT1GVN US5ZCW VK4ATH EA1TI SP4LVK CE3WYZ MW8T (MMØCWJ) CE3OP Top Ten - DX Single Operator, Mixed Mode, HP NP2P (N2TTA) 2,478,464 EA7KW 2,138,600 TM7XX (F5MUX) 2,067,808 OM2VL 1,841,120 OE8Q (OE8SKQ) 1,589,572 IT9VDQ 1,568,640 HG3R 1,511,198 UW1M 1,378,894 YU7AV 1,324,708 TMØR (F5MNK) 1,195,512 2014 ARRL 10 Meter Contest 713,310 306,944 133,350 118,146 114,660 73,280 69,762 51,200 29,618 27,000 Single Operator, CW Only, HP CE1/K7CA PW2D (PY2ZXU@PY2DM) HD2A (HC2AO) 9A5W CS2C (OK1RF, op) KP2/K3TEJ GM3X (GM3POI) LZ9W (LZ3FM) YT9X (YU1ZZ) F8CMF Extended Results – Ver 1.02 54,902 53,932 42,406 28,188 10,812 10,608 10,176 8,964 8,712 8,550 1,639,780 1,339,068 1,272,000 1,259,012 1,249,440 1,132,364 1,100,400 930,852 923,800 898,560 Page 7 of 27 Single Operator, CW Only, LP NP3A VP5CW CX2BR CN8KD EA8CN 9K2/SP4R 5B/RN3QO EA4TX LT7H (LU7HZ) SU9AF Single Operator, CW Only, QRP YO4ATW MWØEDX JA1YNE (JR1NKN) VR2ZQZ YL2CV US5VX HG3M (HA3MY) G3LHJ HA3HX EA7AAW Continental Leaders 1,296,896 1,205,484 842,712 841,728 793,072 675,904 559,248 526,176 509,168 489,456 253,356 218,448 147,840 134,820 131,976 124,852 119,040 113,208 105,376 103,020 Multioperator, HP ZW5B CW5W HK1NA PJ2T CN3A TM6M NP2X 4O3A ED1R IQ9UI 4,159,652 4,147,168 3,869,040 3,707,550 3,458,478 2,960,604 2,831,708 2,256,390 2,227,876 2,180,046 Multioperator, LP PY1GQ CE2AWW VP2VGG LO4D HI3CC ED1B ZR9C LW8DQ R7MM DK5A 1,932,890 1,594,710 1,548,650 1,372,928 1,195,176 1,033,530 825,440 819,280 673,600 658,912 2014 ARRL 10 Meter Contest AFRICA Single Operator, Phone, HP Single Operator, Mixed Mode, LP Single Operator, CW, LP Single Operator, CW, HP Multioperator, LP Multioperator, HP D4C (IZ4DPV, op) 1,885,290 CT9/R9DX 2,201,000 CN8KD 841,728 9L1A 110,880 ZR9C 825,440 CN3A 3,458,478 ASIA Single Operator, Phone, QRP Single Operator, Phone, HP Single Operator, Phone, LP, Single Operator, Mixed Mode, LP Single Operator, Mixed Mode, HP Single Operator, Mixed Mode, QRP Single Operator, CW, LP Single Operator, CW, QRP Single Operator, CW, HP Multioperator, LP Multioperator, HP JR2EKD 8,352 RNØCT 286,740 HZ1BW 192,778 JG1AVO 769,792 RTØF 898,846 RU9CD 118,146 9K2/SP4R 675,904 JA1YNE (JR1NKN) 147,840 C4Z (5B4AIZ, op) 886,240 HSØZIA 532,848 JH5RXS 1,510,410 EUROPE Single Operator, Phone, HP Single Operator, Phone, LP, Single Operator, Phone, QRP Single Operator, Mixed Mode, QRP Single Operator, Mixed Mode, HP Single Operator, Mixed Mode, LP Single Operator, CW, LP Single Operator, CW, QRP Single Operator, CW, HP Multioperator, LP Multioperator, HP GM5X (GM4YXI) HA4XH EA7KB RT4W EA7KW HGØR (HAØNAR) EA4TX YO4ATW 9A5W ED1B TM6M 804,228 261,750 54,902 306,944 2,138,600 748,500 526,176 253,356 1,259,012 1,033,530 2,960,604 NORTH AMERICA Single Operator, Phone, HP Single Operator, Phone, QRP Single Operator, Phone, LP, Single Operator, Mixed Mode, HP Single Operator, Mixed Mode, LP Single Operator, CW, QRP Single Operator, CW, LP Single Operator, CW, HP Multioperator, LP Multioperator, HP YN5Z (K7ZO) WP4DT KP4EU NP2P (N2TTA) NP4DX (WP3C) CO8LY NP3A KP2/K3TEJ VP2VGG NP2X 885,430 900 467,646 2,478,464 1,627,152 24,624 1,296,896 1,132,364 1,548,650 2,831,708 OCEANIA Single Operator, Phone, LP Single Operator, Phone, QRP Single Operator, Phone, HP Single Operator, Mixed Mode, QRP Single Operator, Mixed Mode, LP Single Operator, Mixed Mode, HP Single Operator, CW, LP Single Operator, CW, QRP Single Operator, CW, HP Multioperator, LP Multioperator, HP VK5PAS VK4ATH VK4GMH DU7/N7ET VK4TJF VK3TDX VK7CW YB6EI ZL2JU VK2AWA VK4KW 46,096 10,812 181,584 29,618 147,874 585,648 183,008 952 49,352 17,472 1,860,840 SOUTH AMERICA Single Operator, Phone, HP Single Operator, Phone, QRP Single Operator, Phone, LP Single Operator, Mixed Mode, QRP Single Operator, Mixed Mode, LP Single Operator, Mixed Mode, HP Single Operator, CW, LP Single Operator, CW, HP Single Operator, CW, QRP Multioperator, LP Multioperator, HP LP1H (LU5HM) CE3WYZ PJ4DX YW2LV (YV5YMA) LO5D (LU8EOT) CX9AU CX2BR CE1/K7CA PS7DX PY1GQ ZW5B 1,026,270 8,964 598,142 713,310 1,262,976 1,054,092 842,712 1,639,780 17,472 1,932,890 4,159,652 Extended Results – Ver 1.02 Page 8 of 27 The People Behind the Numbers Though it is fun and easy to review all the activity and records we must keep in mind that any contest is really about the people: those operators who made the effort to get their station on the air, sit down in their chair, make some QSOs, and put them into the log. In any contest there are full-bore operations intended to place first in their category, there are operations just about having some fun, maybe along with some friends and family, and there are operators who make extra special efforts just to get on the air. We just heard from Max, IZ4DPV, about his operation at D4C. Here are stories from a few more. Paul, WN6K, used the 2013 ARRL 10 Meter Contest to introduce his grandson Dylan, KK6IFZ, to contesting. Here is Paul's story of Dylan's first contesting adventure: “Dylan is 11 years old and he received his Tech license after passing his exam two Saturdays before the contest. I showed him how to set up the DVK on the microHam II, how to watch his band edges and let him go at it. I told him that his mental goal should be to try and make about 100 Qs in the contest but by band closing on Saturday I had to revise that one as he had 150 in the log. Sunday morning we went and got hot cocoa and a bagel and set a new goal for 250. That was easily surpassed as he finished with a claimed count of 455. In my first 14 hours of operating as a Novice 38 years ago, I never came close to 10% of that - LOL.” As Paul summarized, Dylan had so much fun he many never be able to get his operating chair back! “When a local friend of mine, WB6BFG worked him, Wild Bill started to 'chat a bit' and Dylan politely cut him off and said, "...uh thanks Wild Bill - gotta run - QRZ." Makes Pepaw proud for sure. Dan, WA6URY, found himself traveling in Tokyo during the contest and away from his home station. Not many years ago that would have been a show stopper as far as getting on the air and Dan has operated the ARRL 10 Meter Contest every year since 1992. Not wanting to see that streak end, he was able to take advantage of improvements in remote station technology and get on the air with no problem. As Dan describes his station and operation: “I started operating my station in southern California by remote from Tokyo in March of 2011. When I started the remote project I had very little knowledge about IT and so it took more time than I expected to understand how to set it up. Fortunately I was able to work with some patient hams that coached me through the process until I understood the how and why of what I had to do to set 2014 ARRL 10 Meter Contest everything up. Like many things in life it is not so difficult once you understand...it is just getting to that point that is challenging. Figure 5— WA6URY's remote station. Note the empty chair, no microphone and no key! (Photo - WA6URY) “The remote station setup went through some transition over the last 3 years and the current setup is a Kenwood TS-480 together with Remoterig as the Internet link. Fifteen Remoterig web switches are used to do various required switching (power on/off of equipment including the amps, antenna switching etc.). Elecraft KPA-500 and a Tokyo Hy-power HL 2500 solid state amps are used for QRO. I have two crank-up towers. One is 72 foot with a SteppIR 3el (with 30/40m trombone) at the top, in the middle is a 80m Create rotary dipole and at the base is a Cushcraft 2el 40m beam. The other tower is 55 foot with a Create 30m 2el at the top, in middle is a Cushcraft 40m rotary dipole and at the base is a Hy-gain TH7 tribander. Orion 2800 rotors are used together with Green Heron controllers and Ethernet to RS 232 converters for interface to the Internet. “Operating remote is no different than if I was actually sitting in front of my station in California. In spite of the distance from Tokyo to CA, latency for the most part is not a problem even during fast-paced CW contest QSOs.” Dan did pretty well with this setup putting 367 QSOs into his log. While remote stations like WA6URY's help us work around the need to be physically present at our station, another typical requirement is to have power. It is tough to get on the air without power from some source and having a QTH well away from established grids can be a challenge. (Of course unless it is Field Day weekend and then that is part of the fun.) Denis, VE6AQ, and the group behind the VE6FI station in Alberta have conquered this challenge by building a solar-powered station. Not only are they not on the power grid they are not even on an established road! Extended Results – Ver 1.02 Page 9 of 27 What they have built is not just any casual station. (Full details can be found on their website.) It is fully capable of high power operation and Denis piloted the station to 565 QSOs during the contest. This was after spending two hours earlier in the day on the tower with temperatures in the teens and with 15 to 20 mph winds getting the last 5 element 10 meter beam in place. Figure 6 — Half of the solar panel system at VE6FI (Photo - VE6AQ) Figure 8— Bob, KQ2M, pleased to be back on the air in his favorite contest. (Photo - KQ2M) “10 meters has always been a fascinating band to me with some of the most bizarre and unpredictable and wonderful propagation. This is easier to see when the whole world is operating on the same band at the same time. Having operated this contest seriously for 3 years at the top of the last cycle (1999-2001), I remembered that often the stations you work at night are worked with antennas NOT pointed at them. Figure 7 — A happy Denis VE6AQ. No commercial power, no problem. (Photo - VE6AQ) Finally, Bob, KQ2M, used the 2013 edition of the ARRL 10 Meter Contest to make a big step back into contesting and this one has always been one of his favorites. Various challenges kept Bob off the air the last couple of years including storm damage from 2011 and 2012 blizzards. The last time he made a serious effort in this contest was back during the top of the last solar cycle in 1999-2001. Bob wrote and posted a very thorough and enjoyable story about his operation. All 5,700 words of it can be found online. High points of his story include, “At 3 PM on Friday, 4 hours before the contest, I had a working 4stack on 10 for the first time since 2006. I was ready. 2014 ARRL 10 Meter Contest Figure 9 — The KQ2M 10 meter antenna array. That is 5 over 5 over 5 over 5! (Photo - KQ2M) Extended Results – Ver 1.02 Page 10 of 27 “Propagation sure kept me guessing! At the top of the cycle with quiet geomagnetic cndx, I would be able to hear and start working EU by 1030z, maybe even running shortly after. I knew that was not going to happen this year. At 1115z (On Saturday) I had worked a few stations and I got fooled, thinking that 10 was about to open. NOT! It wasn’t until 1155z that the band was finally runnable. And then someone flipped the switch and signals jumped 2 s-units all at once and the scatter path disappeared and became direct path. “(On Sunday) I start running on cw with the antennas pointed all over because the band is open all over, at least for the rest of the 17z hour as darkness spreads toward Northern and Western Europe and the G, EI and F stations get loud as the band opens better to the US. “I really had not planned a major operation this weekend and on several occasions I was about to QRT, but then the rate would pick up or an interesting mult would call and then I would stay on. Before I knew it the contest was over!” Bob did pretty well, placing first in the US for SingleOp, High Power, Mixed by a wide margin. Welcome back to the ARRL 10 Meter Contest, Bob! Figure 10 — NØJK mobile antenna was good enough to work EA and YN! (Photo - NØJK) Bob, WØAO, got on the air with a homebrew vertical made out of a fishing pole, an electric fence post, and speaker wire. He did use a commercial radial plate but even with that the total cost was well under $100. Fun with Antennas One of the great things about 10 meters, when it is open you can make QSOs with just about any kind of antenna: Big and small; high and low; commercial and homebrew. In 2013 operators made QSOs will all sorts of antennas. Creative implementations of commercial antennas and homebrew antennas of all kinds abounded. John, K9JK, managed to make 22 QSOs with his mobile antenna mag-mounted to the railing of the front steps of his QTH. Another Jon, NØJK, managed to make seven QSOs during a brief mobile operation Sunday while stopped for gas at a rest stop on the Kansas Turnpike. As he described: “My antenna is a CB mag- mount whip on the car with a converted Regency SSB CB XCVR. I was pleased to work Jose, EA7KW, at 1720 UTC! Washington State and VE7 BC stations pinned the meter on the old radio.” This author, operating as YN5Z was one of Jon’s chosen seven as well. Figure 11 — WØAO's homebrew vertical antenna (Photo – WØAO) Figure 11 shows that Bob must have very understanding neighbors as he managed to put his creation in his front yard. It worked pretty well with 135 QSOs and 49 multipliers in the log. Andy, NY7N, also took the homebrew approach with a Moxon made from "..the finest scrap PVC and wire I 2014 ARRL 10 Meter Contest Extended Results – Ver 1.02 Page 11 of 27 found lying around the shack..." As Andy described the antenna: “The boom and element supports are ¾” PVC connected to a 1” 5ft section of PVC bolted to 16ft of surplus army fiberglass tent poles. The mast is bracketed to the side of the shack using standard TV mast brackets, and it’s turned using the good old “Armstrong” method. It’s not something I plan to leave up year-round, as I don’t think it will stand up well to our monsoon winds in the summer out here in Arizona, but it’s easily lowered to roof level by removing one section of mast or can be dropped down entirely in just a few minutes. Performance was excellent for some hardware store leftovers, generally outperforming my ground mounted 4BTV with 30 radials by 2-4 S units on receive to Europe, Asia and Africa.” Figure 13 — Magnifico! Eric Guzman, NP3A, has a wonderful view of Puerto Rico from his 100% greenpowered QTH to keep him tranquil during those intense contest pileups. His score was magnifico, too; Eric took top DX honors in the Single Operator, CW Only, Low Power category. [Photo — NP3A] Figure 12 — Andy managed 248 QSOs and 98 multipliers with this homebrew Moxon beam (Photo – NY7N) You just have to admire ham ingenuity. The ARRL 10 Meter Contest is a great forum to give your latest and greatest idea a try. 2014 ARRL 10 Meter Contest Extended Results – Ver 1.02 Page 12 of 27 Affiliated Club Competition Club Competition The ARRL Affiliated Club Competition continues to be a popular and fun aspect of this contest like many others. It is like a wide-area multioperator effort where you operate from your home QTH but are member of a larger team competing with other teams. Seventy-eight clubs submitted logs for the 2013 10 Meter Contest, a nice increase from the 71 last year. These 78 clubs submitted a combined 1,186 logs meaning 50% of W/VE operators were also part of a club entry! Way to go club organizers! In the Local Club category, the Central Virginia Contest Club (CVCC) took top honors among the 31 clubs. Their 9 members combined for more than 4 million points, the only Local Club to do so. They also were the only Local Club to exceed 3 million points! By doing so they reclaimed their 2011 first-place position by beating out the last year's winner, the Iowa DX and Contest Club, knocked down to second this year. CVCC's success formula? Sheer numbers. Their nine operators were the most of any club in the Local category. Even though their average score per log was lower than the 2nd and 3rdplace clubs they made it to the top by getting out the troops. In the popular Medium Club category, 41 clubs fought a high-pitched battle which saw the closest one-two finish anywhere in the contest. In the end, the 32 members of the Frankford Radio Club (FRC) just squeezed by the 42 members of the Arizona Outlaws Contest Club (AOCC). The final margin of victory? Just over 5,000 points or a measly 0.04% of the club total score. Yes, that is 4 hundredths of a percent! This difference could have been made up with just 15 or so more AOCC QSOs. In the "big boys" Unlimited Club category, participation rebounded in 2013 with six entries, up from four last year. Coming out on top again for the third year in a row were the 125 members of the Potomac Valley Radio Club (PVRC) who bested the second-place Yankee Clipper Contest Club (YCCC) by a safe margin. The PVRC repeated their traditional success formula by overwhelming the competition with the sheer number of members participating. In fact their average score per log was in 4th place and the YCCC average score per log was over 140,000 point higher than PVRC. But if you can get 125 members turning in logs like the PVRC did, that will certainly push up your club score. Congratulations to all the clubs and their organizers. 2014 ARRL 10 Meter Contest Score Entries Unlimited Potomac Valley Radio Club Yankee Clipper Contest Club Florida Contest Group Minnesota Wireless Assn Northern California Contest Club Society of Midwest Contesters 125 72 59 102 53 71 33,720,558 29,420,280 16,778,758 16,738,102 14,359,660 10,775,910 Medium Frankford Radio Club Arizona Outlaws Contest Club Contest Club Ontario Alabama Contest Group Southern California Contest Club Grand Mesa Contesters of Colorado Mad River Radio Club Hudson Valley Contesters and DXers Central Texas DX and Contest Club Mother Lode DX/Contest Club Maritime Contest Club North Coast Contesters DFW Contest Club Georgia Contest Group Northern Rockies DX Association Tennessee Contest Group ORCA DX And Contest Club Carolina DX Association Saskatchewan Contest Club South East Contest Club Willamette Valley DX Club Western Washington DX Club Texas DX Society Utah DX Assn CTRI Contest Group Redwood Empire DX Assn Order of Boiled Owls of New York Mississippi Valley DX/Contest Club Contest Group Du Quebec Hampden County Radio Assn North Texas Contest Club Louisiana Contest Club Radio Amateurs of Northern Vermont Kentucky Contest Group Bristol (TN) ARC Rochester (NY) DX Assn Great South Bay ARC L'anse Creuse ARC Six Meter Club of Chicago Northeast Maryland Amateur Radio Contest Society Vienna Wireless Society 32 14,018,274 42 14,012,518 45 9,617,108 23 8,555,080 26 8,405,998 22 6,480,396 16 6,195,432 21 5,428,096 10 5,273,722 24 4,928,682 8 4,659,970 7 4,642,856 27 4,418,658 10 4,048,766 5 3,755,830 30 3,605,618 12 3,384,678 20 3,279,116 8 2,745,676 18 2,732,784 15 2,722,688 15 2,712,480 5 2,692,138 10 2,546,982 9 2,079,958 10 2,025,092 9 1,485,446 10 1,452,470 9 1,365,186 14 1,144,606 3 940,282 5 826,122 3 665,452 3 656,694 8 531,904 6 390,458 5 133,352 4 78,780 4 63,380 4 62,322 3 39,896 Local Central Virginia Contest Club Iowa DX and Contest Club Midland ARC Spokane DX Association New Mexico Big River Contesters Lincoln ARC Southwest Ohio DX Assn Kansas City Contest Club Delara Contest Team 599 DX Association Metro DX Club Bergen ARA Niagara Frontier Radiosport West Park Radiops Meriden ARC Skyview Radio Society Columbia-Montour ARC Kansas City DX Club Low Country Contest Club Brazos Valley ARC Contoocook Valley Radio Club Sterling Park ARC Laird Campbell Memorial HQ Operators Club West Allis RAC Athens County ARA Badger Contesters Gloucester Co ARC Portage County Amateur Radio Service Granite State ARA Central Michigan Amateur Radio Club Raritan Bay Radio Amateurs Extended Results – Ver 1.02 9 4 3 8 4 5 4 7 6 5 5 7 6 6 3 3 4 4 3 3 3 3 4 8 4 4 3 3 4 3 6 4,101,712 2,530,728 1,603,696 1,516,528 1,294,340 1,051,516 954,960 838,192 827,572 827,140 822,360 710,300 457,692 426,504 381,218 347,248 310,312 296,946 245,416 224,728 222,234 216,910 216,674 193,494 187,876 144,358 122,940 101,764 59,736 39,008 24,522 Page 13 of 27 Close Races In reviewing the results of just about any contest you can usually find a couple of races where two stations finished very close together in battling for their category's top spot. In reality, during the contest, the stations may or may not have even known they were in a race. Technology exists that allows stations to post their realtime scores to a common website so that all can see. However, this practice has not been widely adopted so in most cases it is only a post-contest review that uncovers a close race in progress and shows how the race played out. (Plus post-contest reviewing includes the effects of log checking which is not known while looking at realtime scores.) There were a couple close races that we can look at for fun and education. The first one is the Multioperator, Low Power battle for second place in the US between KD2RD and NØNI. When the contest was over and log checking completed, KD2RD finished second in the category with a score of 1,497,048. NØNI was only 18,232 points behind meaning KD2RD's margin of victory was just over 1%. So, how did the race play out? lead had been reduced to 132,000 points and by the time of NØNI's sunset a little more than an hour later, they were only behind by 96,000. NØNI had a stronger performance of the two after sunset and by the time both stations shut down for the night around 0200 UTC Sunday, NØNI was only 62,000 points back. Sunday dawned with a repeat of Saturday. The earlier sunrise gave KD2RD a big jump on NØNI. By the end of the 1400 UTC hour KD2RD had a better than 300,000point lead on NØNI. This lead was the result of a 436QSO advantage over NØNI at the time, even though NØNI had 20 more multipliers. Once the band opened at NØNI, they were off to the races and closed the gap in each of the nine remaining hours of the contest. During that time they closed the gap by an average of 32,000 points each hour, falling just short when the contest ended. Though KD2RD had the lead over NØNI through the whole contest, in the real world they definitely would have heard footsteps coming up behind them as they crossed the finish! What else can be seen from this race that helps explain the final score difference and/or might be educational for future contest planning? Looking at the composition of the final scores in Table 2 there are some similarities and differences. Table 2 - KD2RD versus NØNI KD2RD NØNI Figure 14 — The KD2RD and NØNI Race KD2RD is located in New York and NØNI is located in Iowa. Though they are over 1,000 miles apart they have a similar northern latitude meaning a similar amount of daylight – which for the 10 Meter Contest is key to propagation and scoring potential. In fact, there was only five minutes per day of daylight difference. However, being the easternmost of the two stations, KD2RD had the band open earlier and thus was able to get off to an early lead as seen in Figure 14. By the time NØNI got on the air Saturday morning at dawn, KD2RD had built a 100,000 point lead. KD2RD extended this lead through the 1700 UTC hour when the band closed to Europe and NØNI started chipping away at the by-then 186,000 point lead of KD2RD. When the Sun set for KD2RD, their 2014 ARRL 10 Meter Contest Score 1,497,048 1,478,816 Final Score Composition QSOs Mults QSO Points 1,656 266 5,628 1,431 296 4,996 Pts/QSO 3.40 3.49 First, both stations had similar averages of points per QSO which is indicates the ratio of CW to phone QSOs. One key strategy decision all multioperator stations have to make is allocating their operating time between the two modes. In this case KD2RD made 2.34 CW QSOs for each phone QSO while NØNI made 2.93 CW QSOs for each phone QSO. Note that a small difference in the average points per QSO can actually indicate a fairly large difference in the CW to phone ratio. In this case, NØNI made fewer overall QSOs but did so with a higher ratio of CW QSOs, meaning more points for those QSOs. Was this a good choice? Maybe. NØNI ended up the contest with 30 more multipliers which substantially contributed to their score. One view of the race is that NØNI was only able to make it as close as it was because they averaged more points per QSO than KD2RD and had more multipliers. Other than that, KD2RD's 16% higher QSO total was simply overwhelming and that was their success formula. The question then becomes, why did KD2RD have such a higher QSO total? One possibility is a natural geographic Extended Results – Ver 1.02 Page 14 of 27 advantage that East Coast stations have by being closer to the contest population in Europe. In this case, KD2RD is some 750 miles closer to a country such as Germany than NØNI and they did have almost 400 more European QSOs than NØNI did. In the opposite direction NØNI does have a small advantage to Japan over KD2RD but it is over a longer path and to a smaller contesting population. Consequently, NØNI only generated 84 more QSOs with Asia than KD2RD which is not enough to close the gap. With NØNI's points per QSO and multiplier advantage over KD2RD, if they maintained those numbers they only needed 20 more QSOs to close the gap with KD2RD. Where might those 20 QSOs have come from? Looking at off times over the contest weekend, NØNI had more than eight hours more off time than KD2RD. Could they have made 20 more QSOs by simply matching KD2RD's time on the air? Very likely. So, in a final view KD2RD probably achieved second place in the Multioperator, Low Power category in the US simply by having more "Butt in Chair" hours than NØNI. One of the oldest tricks in the book! It still works. A second close race was in another multioperator category. This time it was between two DX stations in a category that always seems to be the source of classic battles; Multioperator, High Power. This year the two heavyweights slugging it out were ZW5B and CW5W. Jorge, CX6VM, and his CW5W team have dedicated themselves to superior performance in this contest and category. They won the category in 2008, 2009, and 2010 only to have D4C knock them into second place in 2011 while setting the all-time category world record. This only furthered Jorge's resolve and he came back to win it again in 2012. (For more on Jorge's story see the 2012 ARRL 10 Meter Contest writeup which can be found at www.arrl.org/contest-results-articles) In 2013 Jorge found himself up against a new adversary, Oms, PY5EG, the Araucaria DX Group, and their famous 10 meter 2 X 2 echelon antenna array. When the dust settled, ZW5B had won the battle by a mere 12,484 points or 0.3%! Yep, just three tenths of one percent. So, how did this race play out? ZW5B is located in southern Brazil and CW5W is in eastern Uruguay. This is an area of the world that often produces Top Ten scores in the 10 Meter Contest. It is south of the equator and the major population centers in North America and Europe. As a result these stations have long and sustained 10 meter openings into areas of the world with many contesters. The two are less than 600 miles apart, though CW5W's more southerly location means they had about 30 minutes more daylight each day 2014 ARRL 10 Meter Contest than ZW5B. Their sunrises were essentially at the same time but CW5W's sunset was 30 minutes later. The tradeoff was that CW5W also had slightly longer paths into Europe and North America than ZW5B – in the range of 500 miles more on total path lengths in the 5,000-7,000 mile range. For both stations the contest started after sunset and rates were slow but steady during the nighttime hours. Just before dawn on Saturday morning ZW5B had worked up a 145,000-point lead based on both more QSOs and multipliers. In particular, ZW5B had substantially more success on phone and they were ahead of CW5W by more than 200 phone QSOs and 30 phone multipliers when the Sun rose. This trend ended up being one of the major story lines of their race. Figure 15 — The ZW5B and CW5W Race With the Sun up at 0830 UTC on Saturday morning, CW5W wasted no time and quickly cut into ZW5B's lead. By the end of the 1300 UTC hour, ZW5B's lead was down to around 45,000 points. CW5W was busy making steady numbers of European QSOs on CW while ZW5B seemed to be struggling and even took a couple hours of off time during this period. (Or maybe they were struggling because they took off time?) However beginning in the 1400 UTC hour ZW5B turned things around and began distancing themselves from CW5W. Their gains really accelerated in the 1800 UTC hour when the band started closing to Europe while the North America floodgates opened. At this point an important strategy difference can be seen. ZW5B chose to operate mostly on phone during the main North America opening generating very high rates of 2-point QSOs. CW5W chose to mostly stay on CW with lower rates but 4-point QSOs. This strategy was very effective for ZW5B during this period and by the end of the 2100 UTC hour ZW5B had their largest lead Extended Results – Ver 1.02 Page 15 of 27 of the contest at close to 340,000 points. ZW5B was ahead by around 350 QSOs and 58 multipliers. During the hours from 1400 thru 2100 UTC ZW5B made 25% more QSOs than CW5W and even with the higher percentage of phone QSOs, generated 240 more QSO points. As the Sun set on Saturday around 2200 UTC things were looking pretty good for ZW5B. However, CW5W was not out of it by any measure. Beginning in the 2200 UTC hour they began a 15-hour period where they not only erased ZW5B's lead but raced out to a 120,000 point lead of their own at the end of the 1200 UTC hour on Sunday. How did they do that? By doing what ZW5B did on Friday night. CW5W had slow but steady QSO rates during the evening and took less off time than ZW5B. CW5W was up at dawn and working hard to track down far away Asia stations while working the early Europeans, all the while filling out their multiplier totals. ZW5B really didn't get rolling until almost 1130 UTC having made just 22 QSOs in the three hours since sunrise. By the end of the 1200 UTC hour CW5W was around 35 QSOs and 14 multipliers behind ZW5B. Their lead was the result of their more CW-focused strategy which gave them a 400-QSO-point lead. At this point on Sunday, things were looking pretty good for CW5W. Maybe that veteran CX6VM really does know the winning strategy, but like any good race – it isn't over until it is over. Starting with the 1300 UTC hour on Sunday, ZW5B got in gear and starting gaining on CW5W, just as they did during the same period Saturday. Each team stuck with their strategy. CW5W operated exclusively on CW through the end of the contest, only making phone QSOs when grabbing a multiplier. ZW5B on the other hand, while operating mostly CW was able to also interleave in 20 or so phone QSOs an hour. After initial gains on CW5W the race was a see-saw affair for several hours with CW5W maintaining a lead in the 70,000-point range. The race headed towards its definitive finish in the 1900 and 2000 UTC hours when ZW5B turned in some of their best CW hours of the contest. CW5W had good hours, too, but ZW5B generated some 300 QSO points more than CW5W during these two hours. This was enough for ZW5B to pull into a slight lead at the end of the 2000 UTC hour. With three hours to go it was still anyone's race to win. During the 2100 and 2200 UTC hours, ZW5B switched back to their strategy of high-rate phone QSOs into North America. This was enough for them to extend their lead in the 2100 UTC hour. CW5W was not giving up and they maintained their CW QSO rate with two solid hours of more than 100 QSOs. As ZW5B's phone rate dropped off in the 2200 UTC hour this gave CW5W the opening 2014 ARRL 10 Meter Contest they needed and they slipped ahead to their own slight lead at the end of the 2200 UTC hour. The champs in four of the last five years had regained the lead with one hour to go! What surprises would the last hour hold? ZW5B switched back to CW for the last hour, made about 25 QSOs more than CW5W, and the rest is history as they say. ZW5B finished on top and CW5W was beaten at their own game. Let's take a look at what else the numbers can tell us: Table 3 - ZW5B versus CW5W ZW5B CW5W Score 4,159,652 4,147,168 Final Score Composition QSOs Mults QSO Points 3,571 371 11,212 3,248 361 11,488 Pts/QSO 3.14 3.54 First, CW5W's CW strategy was successful in generating more total QSO points than ZW5B, so from that standpoint their strategy worked. They made about 3.3 CW QSOs for every phone QSO while the ratio for ZW5B was 1.5. Could either of them made more QSOs? Maybe. They actually had very similar amounts of off time meaning their "Butt in Chair" times were similar. Both had some off times during periods when it would seem they could be making QSOs but without reports from the teams it is just guessing after the fact. One thing that can be seen is that ZW5B was more active in making both CW and phone QSOs during the same period than CW5W. (See Figure 16) What this seems to suggest is that ZW5B, through their radio, antenna, and computer setup along with operating skills was able to CQ on one mode while making S&P QSOs on the other mode. Over the course of the contest this really adds up and is likely one reason why ZW5B had more total QSOs than CW5W. However, even with this advantage to ZW5B, CW5W actually won the battle for total QSO points. That is really what matters. Figure 16 — ZW5B and CW5W Hourly QSO Modes Extended Results – Ver 1.02 Page 16 of 27 It really came down to multipliers making the difference in scores and ZW5B generated 10 more multipliers than CW5W. Most of this difference was on CW as the multiplier count on phone was essentially even. You would normally expect relatively close multiplier totals in competitions like this. Their stations are relatively close to each other and would have similar propagation. They likely had access to the same spotting network data. Their antennas and transmit capabilities are good enough that they could hear anyone and break through whatever pileups might exist to work any station they need. But for whatever reason, ZW5B won this contest by logging more multipliers on CW than CW5W. Could it have been due to their ability to CQ on one mode and S&P on another? That certainly can increase multiplier totals. Was CW5W so focused on generating CW QSO points that they forgot to hunt down multipliers? It has happened to many operators before and in this case only CW5W knows for sure. And it was so close – one more CW multiplier QSO would have given CW5W the victory. After 48 hours of competition by two great teams the results were literally within one QSO of each other. Now how about that for a race? Additional Analysis and Insights In the three years that I have written about the ARRL 10 Meter Contest, I have provided some additional in-depth analysis beyond the results and people. The intent is to provide insight into contest strategy and planning, how the 10 meter band behaves, or just something to satisfy my curiosity and inquisitiveness. In past years I examined the following topics, and these articles can be found on the ARRL web site in the 10 Meter Contest Expanded Results articles (www.arrl.org/contest-resultsarticles). 2011 2012 A Skimmer View of the Contest -- looking at Europe, Asia, and South America openings Skimmer Spots Counts as a way to Predict Scores? Phone versus CW Mix -- A magic formula/ A Bit of Contest History A Skimmer View of the Contest -- looking at the North America to Europe Opening as well as some perspectives on skimmer spot quality and usage. Contest Planning Insights -- characterizing the locations and activity levels in the US by state. 2014 ARRL 10 Meter Contest This year I will present two topics: A look into the North America to Europe opening Contest logging program usage The North America to Europe Opening The first topic is the North America to Europe opening. This aspect of the 10 Meter Contest is one of the more interesting and important to the outcome of the contest. It is also very dependent on having good propagation. In 2011 there was a great opening – the first in many years. Contest participation, QSOs, and scores exploded. 2012 on the other hand was characterized by an almost total lack of an opening. QSOs between North America and Europe were few and far between as compared to 2011. Consequently in 2012, contest participation, QSOs and scores dropped. Then in 2013 the opening came roaring back to life. So, let's take a look. The data available is massive. One data set is the CW Skimmer spots which I also looked at in prior years. Since 2011 the Reverse Beacon Network (RBN – reversebeacon.net) of CW Skimmer receivers, just called “skimmers,” has grown remarkably. Whereas in 2011 I had a data set of just over 500,000 spots to look at, in 2013 this had grown to over 950,000. Of these 950,000 spots, 237,000 represented skimmers in North America hearing stations in Europe or skimmers in Europe hearing stations in North America. Another data set is the QSO data in the 4,959 logs and 1.8 million QSOs. 1,679 were from stations in Europe and 2,454 were from North America. There are also very detailed data available on ionosphere conditions that I didn't even try to incorporate into this analysis. The tools I use to examine this data are relatively simple and two are primitive. I essentially used just three tools. One is Microsoft Excel which allows me to organize the data elements, sort it, calculate simple metrics, and summarize it in the buckets I want to look at. I also use it to generate most of the charts. The second tool, believe it or not, is a 27-year-old copy of Microsoft QuickBasic. I use this to process the datasets when I can't get them into Excel. There is not an easy way to get 4,959 individual log files into Excel and the 1.8 million QSOs are more than it can handle anyway. On the other hand a 40-50 line QuickBasic program can read through all the logs in under 30 seconds, filter and extract specific QSOs, or summarize specific data I am interested in. The third and new tool I used this year is ViewProp by Rick Kiessig, ZL2HAM, (zl2ham.wikispaces.com). It has amazing capabilities for real-time propagation displays via integration with the RBN. Typically it is configured for Extended Results – Ver 1.02 Page 17 of 27 displaying live spots from the RBN network. I used it to investigate propagation in its Replay mode by importing historical RBN spots from during the contest and then to generate the maps you will see. If you are at all interested in propagation analysis and are looking for a tool to visualize real-time propagation ViewProp is amazing. (A complete description is that ViewProp is connected to the RBN network, integrated with Alex VE3NEA's DX Atlas (www.dxatlas.com) and the QRZ.COM database that makes the whole thing work.) What did all this data and the tools show me about the North America to Europe opening? For the purposes of this study, North America (NA) usually refers to just the US and Canada. Clearly there are more countries in North America than these two, but I often am going to confine the study to W/VE. At other times I will take a true NA view. It has to do with managing all the data. At times I just could not wrestle it under control. I will be clear on what view I am presenting. But, in general the conclusions I will draw are mostly targeted at W/VE and not all of NA. Let's start by examining how the band opened on the path on Saturday morning, North America time. I will follow this up with looking at how the opening progressed during Saturday and finally the over the whole contest weekend. With the data there are a couple of ways to look at the band opening period. was not decoded correctly. The most common error was a dropped first CW element, usually a dit. So a call such as RC7A would be spotted as NC7A. Once the data cleaning was complete, a RBN story of the opening did start to show. The first W/VE station to be spotted in Europe was VY2TT at 1107 UTC. Ken was spotted by the OH6BG skimmer. This initial spot was quickly followed by spots for him in Germany , England, and other Finnish skimmers. There were a total of 7 spots for him by the time the next station was spotted at 1116 UTC. Mark, KD4D, was spotted in S5 and then HB9, a different part of Europe than where VY2TT was being heard. Spots for just these two stations continued trickling in until K1LZ was spotted at 1127 UTC in Germany. There was only one more spot for those three stations until when at 1133 UTC skimmers in Germany and Finland spotted: VE1OP, KD4D, VY2TT, KE1J, and K1LZ. The spot rate and stations being spotted started climbing fairly rapidly from this point: N4UU was spotted at 1139, VE9AA at 1142, NY3A at 1145, K1FWE at 1146, N4BP at 1146, KI1G at 1148, N2MM at 1148 UTC, etc. It was somewhere in this period that you would say the band was at least marginally open and skimmer spots counts and stations heard accelerated rapidly afterwards. Bob KQ2M's writeup describes the opening quite well and he said he felt the band became run-able around 1155 UTC. The first way is by reviewing the RBN spots looking for spots that indicate the band is open. RBN spots are useful for this in that the skimmers are "always on" and listening for any and all signals across a wide part of the band. Skimmers will decode and record a call sign throughout a contest. They do have their downside, though. First, they usually are using fairly simple antennas with minimal gain. A good contest station will be using antennas that have much more gain and thus an opening could be good enough for QSOs before a skimmer will hear it. Also, a skimmer is CW-only, so it will miss stations that might be on phone, a topic we will return to in a bit. Most of the time, skimmers only pick up stations CQ-ing. If a station spends the band opening search-and-pouncing (S&P), which is often the case, they will be making QSOs before showing up on skimmers. Figure 17 — W/VE RBN Spots from Europe during band opening Saturday The biggest challenge in using a skimmer for this sort of thing, however, is that its data quality when looking for infrequent events is very poor. I looked at the Europe hearing North America RBN data from 0430 UTC Saturday until the first good spots started showing up around 1100 UTC. In the study I had to examine and throw out over 250 busted spots that, while appearing to be a North America call, were actually another call that Now let's take a look at the first few spots from the five band-opening stations, VY2TT, KD4D, VE1OP, KE1J, and K1LZ. ViewProp maps were set to 11:10 UTC to see the potential path of the QSOs and where the Sun was. Often these early QSOs are not on a direct short path but rather on a skew path. This occurs when both stations are beaming toward an area that will reflect enough signal back towards the other station to support a 2014 ARRL 10 Meter Contest Extended Results – Ver 1.02 Page 18 of 27 QSO. KQ2M's full story referenced earlier discusses this phenomenon very well. This map is not able to show skew paths but rather only shows the direct short path. Figure 18 -- Initial W/VE Spots in Europe (Map ViewProp & DX Atlas) When VY2TT was first heard in Finland it was still well before sunrise for him, the direct path, if that is what his signal followed, going along the grey line. For wellequipped and located stations is it possible to have 10 meter propagation before sunrise. KD4D's spots from S5 and HB9 are different in that he was even further from sunrise and from the locations where he was heard in Europe the likely path was different than VY2TT. All of these early QSOs came from regions of W/VE where the Sun rose first - which is not unexpected. Now let's look at the openings with another set of data: QSO data from the logs. This data has its own pros and cons. One of the biggest advantages of this data it that it is relatively clean, meaning that the vast majority of logged QSOs have both call signs involved correctly identified. Additionally, logs will cover both CW and phone QSOs and will be made usually with both stations using their best antennas. So with antenna gain in play, an opening might show up earlier than with skimmer antennas. Logs also capture Run (CQ) and S&P QSOs. The downside is that the vast majority of the time, the log only includes a station once. There might be both CW and phone QSO for the station but once entered, there will be no more records of a station being heard in that log. Once again I will take the view of W/VE stations being logged in Europe. (The main reason is that with my primitive tools it is much easier for me to find the calls of W/VE stations in Europe logs than to find the calls of Europe stations in W/VE logs.) With this view, the first W/VE station logged in Europe was K1LZ, logged by IT9VQV at 1047 UTC. HG7T logged VY2TT at 1053UTC and 9A5W logged KI1G at 1057 UTC. These three W/VE stations were logged 12 more times mostly in central Europe up until 1115 UTC when stations such as VA1SHA, KQ2M, VE1OP, N1RR, N3RR, KD4D and others started filling the logs. Let's take a look at the 2014 ARRL 10 Meter Contest QSOs from K1LZ, VY2TT, and KI1G plotted on the ViewProp maps during this 30-minute period. Figure 19 — Initial W/VE QSOs with Europe (Map ViewProp & DX Atlas) This QSO-oriented view sure shows a different picture than the Skimmer Spot view. This data set shows the band opening 20-30 minutes earlier. A lesson to learn here is that if you wait for skimmer spots to tell you a band is open, you may be late to the party by 20-30 minutes, at least on this band, this path, time of year, etc. This makes sense given the low-gain nature of skimmer receiving antennas. It is also easy to see that VY2TT was making QSOs during this time on paths that took more northerly paths than those made by K1LZ and KI1G. This was also seen in the RBN data set as VY2TT was spotted in Finland while the other stations were not. What this also means is VY2TT was making QSOs deeper into Eastern Europe than either of the other two stations. Being farther north and east, VY2TT has this advantage as well being able to capture the band right when it opens. A couple other perspectives are fairly easily extracted. First, is "Who were overall Band Openers into Europe?" Looking at the entire QSO data set from the first day of the contest the following figure shows the Top 5 stations W/VE stations that were the "First W/VE in the logs of Europe Stations" Table 4 W/VE Band Openers - Saturday Which W/VE stations were first in EU logs? Call # of logs VY2TT 70 K1LZ 64 KQ2M 51 AA1JD 34 NN2DX 31 Another perspective this data set can provide is into the question of the effectiveness of CW versus phone modes during marginal band conditions, for instance while the band is opening. Following is a graph that charts total CW and phone QSOs over time as the band was opening on Saturday. Extended Results – Ver 1.02 Page 19 of 27 Figure 20 -- QSOs mode during band opening This chart clearly shows that CW was the mode generating the most QSOs from W/VE stations into Europe at this time. On CW, the band opened about 30 minutes before it did on phone and the CW QSO totals were also about 30 minutes ahead of phone. For instance it took until about 1200 UTC for the total phone QSOs to match total CW QSOs 30 minutes earlier at 1130 UTC. For sure, there is some bias and factors other than mode effectiveness in play here. For instance, DX stations outside of W/VE tended to operate more CW than phone across the whole contest. But at 1215 UTC Saturday the ratio of total CW to total phone QSOs was 3:1 which was well above the overall CW to phone ratio for the whole contest. Also, the W/VE stations being heard during the band opening period likely knew they were going to be more effective on CW than phone so they operated on CW instead of phone, a "self-fulfilling prophecy". Still, it is interesting to see some actual QSO data behind the mode effectiveness question. The lesson might be for mixed mode operations during band openings to plan on spending at least the first 30 minutes on CW since you will make very few QSOs on phone. After that you are on your own to strategically allocate your CW and phone operating periods. Enough on the early opening period lets now look at how the opening played out during the day. Returning to the RBN data let's look at the spots from three different US skimmers: WZ7I in Pennsylvania, WE9V in Wisconsin, and N7TR in Nevada. These will be used as proxies for East Coast, Midwest, and West Coast, respectively, as their spot counts suggest they are the better skimmers in those areas. As a metric on the quality and strength of the W/VE to Europe opening I used the number of different Europe stations heard by each skimmer during 15 minute periods throughout the day. 2014 ARRL 10 Meter Contest Figure 21 -- European Stations being heard by US CW Skimmers If there is one chart that demonstrates the advantage the East Coast has within the US in this contest, this is it. During the 2013 ARRL 10 Meter Contest the band opened to Europe on the East Coast 1 hour and 15 minutes before it did in the Midwest and 2 hours and 30 minutes before it did on the West Coast. Then, even when the band was open, the openings to the Midwest and West Coast were not as strong as that experienced on the East Coast. There are a couple of ways to look at and quantify this advantage. First is to simply integrate the metric "Number of different Europe Stations heard during the 15 minute time period" across the day. This is the classic "Area under the curve" value. Table 5 - Overall Saturday Europe Opening Comparison Total European stations heard by each skimmer East Coast (WZ7I) Midwest (WE9V) West Coast (N7TR) 3,662 2,064 1,120 % of East Coast 56% 31% From this examination the Midwest only experiences 56% of the East Coast opening and the poor suffering West Coast only experiences 31% of the opening. Yes, the West Coast has an advantage to Asia, but I ran out of time and energy to summarize this. Suffice it to say that is it is not enough to make up for the East Coast's advantage to Europe – my 2011 ARRL 10 Meter Contest article touches on this topic briefly. An interesting visual view can be seen by looking at ViewProp maps based on the RBN data at the peak of the openings at these three skimmers. (WZ7I 1345, WE9V 1445, N7TR 1600 UTC) The peak of the openings were chosen when these skimmers heard the maximum number of different European stations during a 15minute period. Extended Results – Ver 1.02 Page 20 of 27 Let's look first at the 15-minute period beginning at 1345 UTC. This was the peak period for WZ7I with 197 different European stations heard. The comparable number for WE9V was 126 and for N7TR it was zero. When WZ7I was experiencing the peak of their opening the band had not even opened yet at N7TR! It can also been seen that WZ7I was hearing stations much further to the east than WE9V was. The implication being that East Coast stations could be working stations for QSO and multiplier credit that Midwest stations can't hear. This map also gives a good display of the propagation paths involved. At this time, the vast majority of paths were in full daylight. Only at the far eastern end were some of the stations past their sunset. It is also easy to see that in general the Midwest to Europe paths travel further north than the East Coast to Europe paths. Figure 22 — European stations heard during the period beginning 1345 UTC (Map: ViewProp & DX Atlas) Moving ahead an hour let's look at the map for the 15minute period beginning at 1445 UTC. This was the peak period for WE9V with 169 different European stations heard. The comparable numbers for WZ7I were 183 and N7TR 63. Note that even during WE9V's peak period, WZ7I was still hearing more different stations. By this time the sunset line had progressed further west across Europe and stations that were being heard an hour earlier were starting to disappear. WZ7I was still hearing stations further to the east than the other two. By this time the band had finally opened at N7TR as sunrise made its way across the US. The map clearly shows how much further north the propagation path from the West Coast to Europe is than for stations in the Midwest and East Coast. At this time a good portion of the path from N7TR to Europe was entirely in the grey line. Finally, moving ahead to the peak of the opening for N7TR, let's look at the map for the period beginning at 1600 UTC. During this period N7TR heard 122 different European stations. The comparable numbers for WZ7I and WE9V were 168 and 150, respectively. So, as experienced by WE9V, even at N7TR's peak WE9V and WZ7I were hearing more stations. By 1600 UTC sunset had progressed even further west across Europe. Some, but not many, stations east of the sunset line were being heard. By the time the band really opened up on the West Coast the band had closed to parts of eastern Europe that the East Coast and Midwest were able to work hours earlier. The implications of N7TR's West Coast location and more northerly paths continue to stand out. For portions of Europe north and east of a line from northern Germany down through Greece the West Coast never had a path to them that was in full daylight. Figure 24 — European stations heard during the period beginning 1600 UTC (Map: ViewProp & DX Atlas) Beyond the propagation maps and skimmer spot counts the real implications should show up in the contest logs. I can imagine other interesting analyses to perform but I need to create better tools to do so – maybe next time. As one simple examination I looked at the logs of the top three Multioperator, High Power stations in Europe, TM6M, 4O3A, and ED1R, and their relative QSO counts with California and Pennsylvania. These three stations averaged 0.7 QSOs from Pennsylvania for each PA station that turned in a log. The comparable number for California was 0.3. It was more than twice as hard for these three stations to work California as it was Pennsylvania based on the length and strengths of the openings. The final part of this North America to Europe study is to move the analysis beyond just Saturday. How did the North America to Europe opening compare on Sunday versus Saturday? We can look at it with both the log and RBN data sets. Figure 23 — European stations heard during the period beginning 1445 UTC (Map: ViewProp & DX Atlas) 2014 ARRL 10 Meter Contest Extended Results – Ver 1.02 Page 21 of 27 Figure 25 — Comparing Saturday and Sunday W/VE to Europe QSO Rates Looking at the log data, the QSO rates of European stations logging W/VE stations on Sunday started out virtually the same as it was on Saturday. (Remember with my primitive tools it was much easier for me to find the QSOs of W/VE stations in European logs than viceversa.) The band opened about the same time and activity picked up. However, about 1430 UTC the Sunday QSO rate started decreasing and falling below that experienced on Saturday. Could it be that everyone had worked everyone and the rate dropped off simply because there were not QSOs to make? Maybe. Could it be propagation related? Maybe. Let's keep digging. Figure 27 — Comparing Saturday and Sunday Europe Skimmer Spots of North American Stations Skimmer data shows the same drop off, albeit starting a bit later around 1500 to 1530 UTC. In fact the early Sunday RBN spot rates were higher than on Saturday. Could it be that European stations started shutting down their stations Sunday afternoon? That is plausible. If this was happening you would expect to see the North America RBN spot rates of Europeans stations drop off faster than the European RBN spot rates of North America stations. The reason being is that even if a European station shuts down their station the skimmers were probably left running, generating spots of North America stations as long as the band was open. You can actually see this in comparing the two different RBN data views. Of course, one other way to answer this question is to just look at the logs to see when stations were active and on the air. Figure 26 — Comparing Saturday and Sunday North American Skimmer Spots of European Stations Figure 28 — Comparing activity on Saturday and Sunday 2014 ARRL 10 Meter Contest Extended Results – Ver 1.02 Page 22 of 27 This does show that during the early part of the Sunday North America to Europe opening that there were actually more European stations on the air than on Saturday. Starting around 1500 UTC though European stations started dropping off the air. As the opening closed there were substantially less European stations on the air than on Saturday. So, on face value it could be that the drop off in QSOs was simply because there were less European stations on the air. Could there also have been a propagation impact? Maybe. There are large propagation related data sets that I did not have time to investigate. One simple yet imperfect one is the Signalto-Noise Ratio (SNR) of RBN spots. Contest Logging Programs With access to Cabrillo-formatted files it is fairly easy to summarize contest logging programs used for the ARRL 10 Meter Contest. One of the standard Cabrillo tags is "CREATED-BY:" which is followed by the name of the logging program. For the 2013 ARRL 10 Meter Contest logging program usage looked like this: Figure 30 — Contest Logging Programs Used Figure 29 — Comparing Signal-to-Noise Ratios (SNR) of European stations heard by North American CW Skimmers This view shows that SNRs on the two days was remarkably similar up until 1630 UTC when Sunday's SNR started dropping relative to Saturday. This is where deciphering cause and effect gets tricky. Could it be that the SNR levels dropped on Sunday because the bigger and stronger European stations started going QRT during the late afternoon and as Sunday dinner approached thus causing the average SNR level to fall? Perhaps. Or, could it be that some sort of degradation in propagation occurred that drove down QSO rates and thus stations decided to wrap things up and pull the plug? Perhaps. Further investigation should be able to tease out an answer to this question but that will have to wait for another time. The best thing that can be said is that everyone who got on the air enjoyed a great opening from North America to Europe both days of the contest. The other conclusion that is obvious and everyone knows about is if you like to contest, and you want to live in the US or Canada, and you want to score high – move east Young Contester! 2014 ARRL 10 Meter Contest There were a few programs on this list with which I was not familiar. The ARRL 10 Meter Contest is a worldwide event and there are several countries that have a logging program that is popular just in their country. For example CTESTWIN is popular in Japan and QARTest is popular in Italy. There are also a noticeable number of operators who still log by hand and then use the WA7BNM Cabrillo Web Form to create their log file. Overall, though, N1MM Logger is used by far more contesters than any other logging program. It is used by more than four times as many contesters as the second most popular logging program, those provided by N3FJP. Another perspective about contest logging program that I have heard discussed is "What do serious contesters use?" Using a metric of "Average size of log submitted" seems at least plausible to provide this insight. Serious contesters usually make more QSOs than the casual ones. Using this metric, Win-Test users have the largest average log size followed closely by CT. Win-Test logs were, on average, more than twice as large as the average log submitted. It is interesting that CT no longer has many users but those that do continue to use it are pretty active. Also interesting is that N3FJP’s second most popular software, has relatively small logs at less than 2/3rds the average log. It would thus seem to appeal to more casual contesters. Extended Results – Ver 1.02 Page 23 of 27 applies literally in this situation: "Make Hay While the Sun Shines in 2014!" Though the exact path Cycle 24 will take is hard to forecast, it is certainly going to be declining through the end of the decade. By 2019 you will certainly be looking back at 2014 and wishing conditions were at least that good. So, enjoy them now. Figure 31 — Average Log Size by logging program Predictions for 2014 The 42nd annual ARRL 10 Meter Contest will be held on December 13th and 14th, 2014. So, what might we expect this year? If there is one main lesson about how an ARRL 10 Meter contest will go, it has to do with propagation. Good propagation brings out more operators. Good propagation means each participant can make more QSOs more easily. These two factors build on themselves in almost an exponential way driving overall QSO counts up dramatically and thus scores. And since propagation is based on what the Sun is doing, let's start by looking at solar forecasts. During the last year, Solar Cycle 24 pleasantly surprised us by rising to a second peak. In fact this peak coincided nicely with the 2013 edition of the ARRL 10 Meter Contest and amateurs worldwide jumped at the opportunities it gave them. But what about 2014? Solar cycles are notoriously hard to forecast. If you remember early forecasts for Cycle 24 suggested it could be the cycle of all cycles but alas it has proven out to be the weakest of all since the ARRL 10 Meter Contest began in 1973. Not since Cycle 20 which peaked in the late 1960's have we seen such a weak sunspot cycle. But, it does look like Cycle 24 might have a little life left in it. The April 2014 forecast by NOAA's Space Weather Prediction Center for December 2014 are for a smoothed sunspot number in the 63 to 83 range with corresponding flux levels in the 117 to 135 range. Their single best guess predictions for smoothed sunspot number and solar flux are 75 and 127 respectively. These levels, though down from 2013, should still allow for reasonable 10 meter propagation. Compared to recent years conditions might not be as good as 2011 or 2013 but should be better than 2012. Most importantly though, these conditions will almost assuredly be better than any year for the rest of the decade! As the old proverb says, and 2014 ARRL 10 Meter Contest Figure 32 — 2014 Solar Forecast (Courtesy NOAA/SWPC) The next question becomes, with this level of solar activity what should you expect during the contest? From a participation standpoint, overall there has been growth in contesting worldwide. This means increasing numbers of hams will enter contests. History and Figure 33 clearly show that in the ARRL 10 Meter Contest, better propagation drives more hams to get on the air. Figure 33 — Logs submitted vs Solar Flux Also, with the worldwide spread of the Internet, computer logging programs, log file format standards, and electronic log submission, it is easier than ever to submit a log, so higher percentages of operators active in contests submit logs. This all came together in 2011 when an incredible 5,361 logs were received. The 4,959 Extended Results – Ver 1.02 Page 24 of 27 received in 2013 was not bad either. With a flux level of 127 in 2014, I predict 4,850 logs will be received. Continuing the predictions the next question is "What score might it take to get into a Top 10 listing?" This is also positively correlated with solar flux, meaning the higher the flux, the higher the score you need. I have studied this for the High Power categories for the US and DX and the results can be seen in the following two charts. (I apologize to those in VE and XE, and those operating in Low Power and QRP Categories for not preparing similar charts for you. Putting these together is very data and time intensive and I have just not had enough of the latter to complete them. All the data you need is in the ARRL searchable database.) 10 list in the US and DX during the 2014 edition are in the following figure: Figure 36 — 2014 Minimum Top 10 Score Predictions If you are so inclined, take these goals, choose your category, and figure out what sort of QSO and multiplier total it will take to reach your goal. Write these down in big bold letters on a piece of paper and post it in clear sight at your operating position. Then sit down, get on the air, and don't get up until you have exceeded your goals! Even if you are not so inclined, make sure to sit down and get on the air – the 2014 contest looks like it will be a fun one. And, given where we are in the solar cycle, in future years you will look back on 2014 and say to yourself "Boy those were the good old days!" Figure 34 — Minimum Scores for US High Power Top 10 by Category Figure 35 — Minimum Scores for DX High Power Top 10 by Category Based on these two charts and applying some "windage" to the more recent results my predictions for the minimum score it will take to get into a High Power Top 2014 ARRL 10 Meter Contest Extended Results – Ver 1.02 Page 25 of 27 Division Winners Single Operator, Mixed Mode Atlantic Central Dakota Delta Great Lakes Hudson Mexico Midwest New England Northwestern Pacific Roanoke Rocky Mountain Southeastern Southwestern West Gulf Canada NK8Q AF9J WFØT KE5SNJ (AC5O, op) KU4A WB2AMU XE2ES KØOU N1IX K6ZY KG6HM KV8S NS7K K9OM WA6FGV N1CC VE6EX 207,284 31,496 22,400 123,384 98,440 161,916 1,872 18,912 247,632 28,908 1,710 24,476 48,772 556,356 293,388 400,760 295,800 QRP QRP QRP QRP QRP QRP QRP QRP QRP QRP QRP QRP QRP QRP QRP QRP QRP Atlantic Central Dakota Delta Great Lakes Hudson Mexico Midwest New England Northwestern Pacific Roanoke Rocky Mountain Southeastern Southwestern West Gulf Canada WB8YYY W9GT KØAD N5DX N8VV KU2M XE1/AAØAA KTØK W3EP K7SS N6ZFO N8II N2IC NA3M K6AM WB5TUF VE4EA 332,896 222,272 253,260 1,136,336 668,394 1,245,692 18,972 804,000 934,284 745,348 785,510 1,269,432 1,652,876 441,396 1,026,344 301,928 630,938 LP LP LP LP LP LP LP LP LP LP LP LP LP LP LP LP LP Atlantic Central Dakota Delta Great Lakes Hudson Mexico Midwest New England Northwestern Pacific Roanoke Rocky Mountain Southeastern Southwestern West Gulf Canada AB3CX WØAIH (NE9U, op) KØTT N8OO KE4KY N2UN 4A1TD WØEWD KQ2M W7GKF K9YC NR3X (N4YDU, op) W7UT N4PN K6LL N5JR VY2TT 1,381,224 1,719,210 1,594,240 2,052,452 247,920 912,962 53,286 968,976 2,783,836 633,324 1,072,436 544,040 1,019,720 1,876,980 2,029,520 344,052 2,459,142 HP HP HP HP HP HP HP HP HP HP HP HP HP HP HP HP HP 138,828 35,280 78,660 5,846 22,932 161,376 8,160 64,092 7,490 2,156 10,120 37,440 40,592 14,800 47,872 11,316 QRP QRP QRP QRP QRP QRP QRP QRP QRP QRP QRP QRP QRP QRP QRP QRP Single Operator, Phone Only Atlantic Central Dakota Great Lakes Hudson Mexico Midwest New England Northwestern Pacific Roanoke Rocky Mountain Southeastern Southwestern West Gulf Canada KE2OI N9FRY NDØC N9UXU W2WGK XE2JS WØYV N1YWB NT7S KD6FIL NO4FX KKØQ KS4GW KK7EL KB5KYJ VA3VF 2014 ARRL 10 Meter Contest Atlantic Central Dakota Delta Great Lakes Hudson Mexico Midwest New England Northwestern Pacific Roanoke Rocky Mountain Southeastern Southwestern West Gulf Canada KB3WD KF9US KØVH KC5EGR KE8KT KS2G XE3/K5ENS KAØFSP N1WRK N7FLT K6GHA K4PZC WD4IXD WA8QYJ W6SAN WB5R VA7AM 256,872 109,620 37,252 44,986 95,004 56,244 440,244 48,422 63,882 252,700 119,952 126,566 181,106 99,360 75,952 174,932 160,776 LP LP LP LP LP LP LP LP LP LP LP LP LP LP LP LP LP Atlantic Central Dakota Delta Great Lakes Hudson Mexico Midwest New England Northwestern Pacific Roanoke Rocky Mountain Southeastern Southwestern West Gulf Canada W3LL N9BW KØBUD WA5OYU KB8U WU2X XE1B NUØC NC1I (K9PW, op) KW7XX K6HNZ KU4V WA5ZUP N4OX N7UQ NR5M VA5DX 495,360 284,700 74,496 330,106 465,740 468,692 701,820 82,152 648,240 374,030 369,000 123,424 375,002 606,504 408,100 818,736 566,432 HP HP HP HP HP HP HP HP HP HP HP HP HP HP HP HP HP 129,904 180,960 266,112 25,344 144,936 67,804 9,792 18,696 243,800 90,032 307,644 26,112 41,768 204,600 172,400 13,224 138,380 QRP QRP QRP QRP QRP QRP QRP QRP QRP QRP QRP QRP QRP QRP QRP QRP QRP 813,852 470,184 291,852 210,420 637,872 503,100 12,060 94,464 878,592 472,512 374,928 328,656 754,068 1,016,776 612,560 606,044 765,576 LP LP LP LP LP LP LP LP LP LP LP LP LP LP LP LP LP Single Operator, CW Only Atlantic Central Dakota Delta Great Lakes Hudson Mexico Midwest New England Northwestern Pacific Roanoke Rocky Mountain Southeastern Southwestern West Gulf Canada K2SM W9OP NØUR AD4CJ KT8K NQ2W XE1GXG N8LA AA1CA KL2R (N1TX, op) KH7M (KH6ZM, op) KS4YX WC7S KØLUZ W6QU (W8QZA, op) WUØL VE5VA Atlantic Central Dakota Delta Great Lakes Hudson Mexico Midwest New England Northwestern Pacific Roanoke Rocky Mountain Southeastern Southwestern West Gulf Canada W3BGN K9QVB N7IV WQ5L NA8V W2AW (N2GM, op) XE2YWH NØAX WA1Z N7OU N7YK AA4FU W2UP K1TO K9WZB N5DO VE3DZ Extended Results – Ver 1.02 Page 26 of 27 Atlantic Central Dakota Delta Great Lakes Hudson Mexico Midwest New England Northwestern Pacific Roanoke Rocky Mountain Southeastern Southwestern West Gulf Canada NY3A K9BGL WØSD (WØDB, op) K5GO K8AZ (K8NZ, op) N2NT XE1MM K2DSW KI1G WJ9B KH7Y N4AF K5TA N4BP W6PH N5RZ VE7JH 1,359,252 905,960 948,560 870,504 1,424,528 422,520 567,472 234,624 1,251,872 1,056,372 1,034,208 964,320 706,628 897,520 970,920 1,218,820 1,007,304 HP HP HP HP HP HP HP HP HP HP HP HP HP HP HP HP HP 1,939,912 1,903,808 1,208,752 394,416 1,313,272 641,592 476,286 645,650 3,569,956 2,311,184 2,278,348 1,597,436 2,841,960 2,238,520 2,074,800 2,803,744 2,173,000 HP HP HP HP HP HP HP HP HP HP HP HP HP HP HP HP HP 162,192 165,636 291,124 601,012 303,630 1,497,048 57,380 1,478,816 385,700 1,125,252 1,780,660 367,268 696,654 420,110 363,636 254,600 1,075,648 LP LP LP LP LP LP LP LP LP LP LP LP LP LP LP LP LP Multioperator, High Power Atlantic Central Dakota Delta Great Lakes Hudson Mexico Midwest New England Northwestern Pacific Roanoke Rocky Mountain Southeastern Southwestern West Gulf Canada WX3B K9NW NØAT K3IE W8MJ W2GDJ XE2CQ NØMA K1LZ N9RV W7RN K4FJ KØRF W4UH N7DD NX5M VE9AA Multioperator, Low Power Atlantic Central Dakota Delta Great Lakes Hudson Mexico Midwest New England Northwestern Pacific Roanoke Rocky Mountain Southeastern Southwestern West Gulf Canada W3KB NØFCD AAØAW NA5NN NO8C KD2RD XE2AU NØNI N1EN W7TVC KH6LC KG4W KØUK WA1F N7IR WR5O VE4GV 2014 ARRL 10 Meter Contest Extended Results – Ver 1.02 Page 27 of 27
Baixar