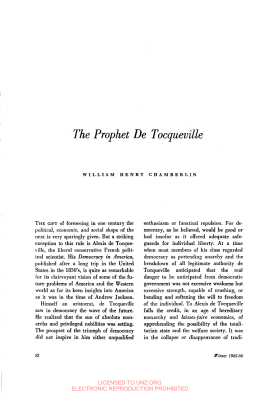
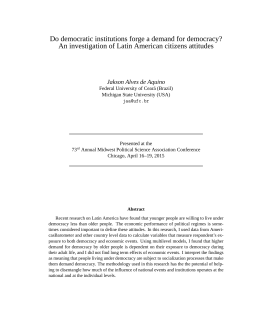
Working Paper No. 160 The effect of exposure to political institutions and economic events on demand for democracy in Africa by Jakson Alves de Aquino | September 2015 1 Working Paper No. 160 The effect of exposure to political institutions and economic events on demand for democracy in Africa by Jakson Alves de Aquino | September 2015 Jakson Alves de Aquino is a professor in the Department of Social Sciences at the Federal University of Ceará, Brazil. Email: [email protected] Abstract Understanding why people demand democracy is important to an evaluation of the prospects for democratic stability. Most researchers examining this question have added national-level variables to multi-level regression models of survey data. This paper contributes to the investigation of why people demand democracy by adding new individual-level variables related to individual exposure to political institutions and economic conditions. Its two main questions are: Does exposure to democracy increase the legitimacy of democracy? Is people’s demand for democracy influenced by the past economic performance of their countries? Regression analysis results show no evidence that national economic performance is relevant for demand for democracy. However, exposure to democratic institutions – measured as the number of years lived under either democracy or nondemocracy – has a statistically significant, though substantively small, effect on demand for democracy. Overall, the results allow some optimism that as people live under democracy, they internalize its core values and improve its chances of consolidation. Acknowledgements This work was conducted at Michigan State University as part of a fellowship supported by CAPES (Brazilian Federal Agency for Support and Evaluation of Graduate Education within the Ministry of Education). I am grateful to Michael Bratton, who suggested improvements to this paper. 1 Afrobarometer Working Papers Introduction In a democratic political regime, politicians and ordinary citizens must accept elections as the legitimate means of choosing who will govern. Losers must patiently wait until the next election to have an opportunity to elect a leader according to their preferences, and winners must restrain themselves from changing the rules to increase their power. Political systems are considered consolidated democracies when elections are free and fair, alternations of power happen according to the results of elections and are accepted by all main contenders, and the general public sees the system as the best way of organizing the political life. The establishment and survival of democracy depend on both politicians and ordinary citizens being committed to it. Understanding why people have (or do not have) a favourable view of democracy, that is, why they demand democracy, is important to an evaluation of the prospects for democratic stability. Usually, national-level variables have been added to multi-level regression models of survey data. In this paper, I contribute to the investigation of why people demand democracy by adding to the usual explanations new individual-level variables related to individual exposure to political institutions and economic conditions. My two main questions are: Does exposure to democracy increase the legitimacy of democracy? Is people’s demand for democracy influenced by the past economic performance of their countries? I argue that people live in a constant process of socialization, learning from their individual experiences and from their social environments. People exposed for a longer time to democratic institutions learn how the system works, accept its procedures, and as a result demand democracy more than less exposed people. Demand for democracy in Africa Many North African countries became independent during the first decades of the 20th century, but most sub-Saharan African countries achieved their independence between 1960 and 1980. Most of these independent countries emerged as authoritarian regimes. (Figure 1 shows the number of democratic and non-democratic regimes among the 34 countries surveyed by Afrobarometer in 2011-2013. Note that the countries not surveyed by Afrobarometer include some of the least democratic on the continent; the number of authoritarian regimes in Africa is higher than the number shown in the figure.) During the years following the end of the Cold War, the number of democratic countries increased, with some setbacks. However, the democratization process in the countries surveyed by Afrobarometer has levelled off in recent years. Figure 1: Number of democratic and non-democratic regimes among 34 countries surveyed in Afrobarometer Round 5, according to Polity IV project | 1950-2013 Copyright © Afrobarometer 2015 1 Afrobarometer Working Papers The increasing insertion of African states in the global economy as exporters of commodities – which makes governments less dependent on taxation of citizens and more dependent on foreign capital – is one of the obstacles to further democratization of the continent. Moreover, in recent years, combatting terrorism has become a top priority for developed countries, which has resulted in weaker international pressure for democratization and consequently a dwindling manifest commitment to democracy by some African leaders (Gyimah-Boadi, 2015; Diamond, 2015). Democratization does not always deliver the improvements in economic conditions that people expect. Indeed, African citizens have not benefited as they should from recent economic growth, and vote buying and distribution of resources to secure the support of allies remain widespread (Gyimah-Boadi, 2015). On the one hand, this might make people disillusioned with democracy. On the other hand, people may learn that democracy is more about freedom than about material gains. When there is alternation in power, citizens’ satisfaction with democracy is restored (Bratton, 2004; Moehler & Lindberg, 2009), and the occurrence of free and fair elections is the factor with the strongest effect on people’s satisfaction with democracy (Bratton, 2007). Demand for democracy can be seen as a measure of regime legitimacy among ordinary citizens, and a good understanding of what makes people demand democracy is important for those wanting to contribute to the rise of democracy on the continent. Mattes and Bratton (2007, p. 202) have found that the most important factor for a high demand for democracy “is the extent to which respondents see a set of political procedures (a scale consisting of majority rule, free speech, regular elections, and multiparty competition) as ‘essential’ elements of democracy.” People demand more democracy when they associate the regime with more political rights; performance of the national economy and personal finances are less relevant (Mattes & Bratton, 2007). To understand how democratic institutions might have an effect on demand for democracy, we must think about how political attitudes change. Individuals do not make rational decisions all the time; nor do they act randomly. Quite the contrary: Most of the time, actions are guided by existing orientations that were learned from experience. Attitudes are practical expressions of these orientations. The meaning of new situations is commonly interpreted within the framework provided by existing orientations, and rarely do individuals feel the need to change their attitudes. Sometimes, however, novel situations might be too different from previous experiences to be encompassed by existing attitudes or might bring new elements that make it evident that previous attitudes are unsatisfactory. If the dissonance between the perception of the current world and existing attitudes is too strong and too persistent, individuals will change their attitudes or even their basic orientations (Eckstein, 1988). The world of children and teenagers is mostly restricted to family, close friends, school colleagues, and people from their own communities. Children and adolescents do not have enough autonomy to take important decisions about their own destiny; these are taken by their parents. It is only when individuals enter the adult world that national and international events become important for their decisions. Information on job opportunities in nearby provinces or countries and knowledge of political regimes and political conflicts, for instance, might be useful to decide where to live and whom to vote for in national elections. Individuals’ personalities and basic orientations toward the social world are consolidated mostly during infancy and adolescence, but political attitudes are formed mainly in adulthood. Therefore, political and economic events will most directly affect the attitudes of adults. By the time individuals reach adulthood, they have already developed their own ways of dealing with people and solving problems of personal relationships. However, impersonal relations and strategic behaviour are much more present in the political world than in everyday life, and knowledge of how to deal with family and friends is rarely enough to navigate in the political world. An understanding of how political institutions work is necessary to properly appreciate how useful these institutions are to solve collective problems or what Copyright © Afrobarometer 2015 2 Afrobarometer Working Papers a hindrance they are to the prosperity of the community. Citizens must raise their reasoning above the practical knowledge of how to deal with people in daily situations. An understanding of political institutions requires a great deal of abstract thought, or,cognitive awareness. Bratton, Mattes, & Gyimah-Boadi (2005b) have found that cognitive awareness increases with education, exposure to mass media, and personal experience. Even people with little education can observe political events such as elections and their results and make their own judgements about the value of democracy. But elections in an environment dominated by patronage and clientelism might be more an expression of the power of leaders to control the votes of populations than an expression of individual free will (Bratton, Mattes, & Gyimah-Boadi, 2005b). Consequently, it is expected that demand for democracy will be higher among those who have lived their adult lives under democratic regimes. Mattes and Bratton (2007), however, did not find any effect of individual exposure to political institutions on either demand for or supply of democracy. The main purpose of this research is precisely to test the hypothesis that long-term exposure to democratic institutions allows even less cognitively sophisticated individuals to understand and appreciate how democracy works and, consequently, to demand democracy. According to this hypothesis, “people constantly acquire new information, developing a running tally of lessons about political regimes accumulated over an entire lifetime” (Mattes & Bratton, 2007, p. 198). Data Afrobarometer Round 5 surveys1 produced data from 34 countries. I deleted data from Swaziland because its survey did not include one of the questions used to build the index of Demand for democracy.2 I also deleted cases with missing respondent age. The data set used in this investigation includes 49,946 cases from 33 countries, but only 27 countries have data on ethnicity, and only 19 have in their history since independence both authoritarian and democratic regimes, as measured by the Polity IV project. Dependent variable Like Bratton and others,3 I measure Demand for democracy based on Afrobarometer survey questions where respondents have the opportunity to agree with the statement that “Democracy is preferable to any other kind of government” and to disapprove of singleparty rule, military government, and presidential dictatorship. To calculate Demand for democracy, I coded the democratic answers as 1 and all other responses as 0. The index is the mean value of the variables. Figures 2 and 3 show the distribution of Demand for democracy: 23,843 respondents (48% of the total) gave democratic answers to all questions and got the maximum score on Demand for democracy, but in some countries (Egypt, Algeria, and Madagascar) less than 20% did so. 1 Afrobarometer describes itself as “a pan-African, non-partisan research network that conducts public attitude surveys on democracy, governance, economic conditions, and related issues across more than 30 countries in Africa. Five rounds of surveys were conducted between 1999 and 2013, and Round 6 surveys are currently under way (2014-2015). Afrobarometer conducts face-to-face interviews in the language of the respondent’s choice with nationally representative samples that yield country-level results with margins of sampling error of +/-2% (for samples of 2,400) or +/- 3% (for samples of 1,200) at a 95% confidence level” (see www.afrobarometer.org). 2 The R scripts necessary to replicate the analyses presented here are available at http://www.lepem.ufc.br/jaa/afr15.tar.gz. 3 See Bratton, 2004; Bratton, Chikwana, & Sithole, 2005a; Bratton, Mattes, & Gyimah-Boadi, 2005b; Bratton, 2007; Mattes & Bratton, 2007. Copyright © Afrobarometer 2015 3 Afrobarometer Working Papers Figure 2: Demand for democracy distribution | 33 countries Figure 3: Demand for democracy distribution | by country | 33 countries Independent variables To calculate individual exposure to democratic institutions, we need data on the national level of democracy throughout recent decades. The two most widely used data sets on country-level democracy are Freedom House and Polity IV (Marshall, Jaggers, & Gurr, 2014). I used Polity IV because it covers a longer period, which is necessary to calculate the individual-level variables for older people, who reached the age of 18 years before Freedom House started classifying political regimes. I used the Polity IV variable that combines the values of autocracy and democracy, including for years of regime transition (Marshall, Jaggers, & Gurr, 2014). Countries with scores from −10 to +5 are considered non-democratic, and those from +6 to +10 are considered democratic.4 Based on this variable, I calculated four indicators of respondents’ exposure to democratic institutions and economic events: • Years of democracy is the number of adult life years lived under democracy between the respondent’s 18th birthday and the survey date. The variable was divided by 100 to bring its range closer to the interval 0–1 and thus make the regression coefficients easier to interpret. • Years of non-democracy is the number of adult life years lived under a nondemocratic regime. Its value was also divided by 100. 4 See http://www.systemicpeace.org/polityproject.html. Copyright © Afrobarometer 2015 4 Afrobarometer Working Papers • Mean Polity IV is the mean value of the Polity IV variable during the respondent’s adult life. Its value was divided by 10. • Mean Polity IV Growth is the mean value of the multiplication of Polity IV and economic growth for each year of adult life. The hypothesis behind the expected positive correlation between Years of democracy and Demand for democracy is that people living under democracy will see its institutions as valuable. Elections will be seen as the normal way of choosing leaders, turnover of government officials will be regarded as the natural consequence of elections, and tolerance toward minorities will be seen as necessary and fair. These and other democratic events and attitudes will be seen as the normal way of achieving peace and prosperity. The longer an individual lives under democracy, the more he or she will demand democracy. People living in a society that either is authoritarian or has a highly flawed democracy do not have the opportunity to see democratic institutions at work. Even if they have heard about peaceful democratic transitions in other countries, they may be afraid that a democratic regime would not work in their own country. A transition to democracy could be seen as a threat of violence and chaos. Thus I expect a negative correlation between Years of nondemocracy and Demand for democracy. Years of democracy will be the same as the number of adult life years for respondents in Botswana, Mauritius, and Namibia, whose Polity IV scores have always been above +5 in recent decades. In these countries, Years of non-democracy will be 0 for all respondents. Similarly, regarding Years of democracy, Algeria, Burkina Faso, Cameroon, Côte d'Ivoire, Egypt, Guinea, Morocco, Mozambique, Tanzania, Togo, and Zimbabwe have received only scores below +6 in their recent past. Hence, when using these variables, it makes sense to analyse data from countries that have had both democratic and non-democratic years in their recent history. If both Years of democracy and Years of non-democracy have significant effects on Demand for democracy, a single variable measuring the mean value of Polity IV during adult life could be more suitable to evaluate the long-term impact of political institutions on attitudes toward democracy. Instead of converting Mean Polity IV into a binary variable, I use the full range of fine-grained Polity IV values. Moreover, there will be variation in Mean Polity IV in any country that has had variation in its Polity IV scores in recent years, that is, all countries surveyed by Afrobarometer, and consequently we do not need to drop countries when including Mean Polity IV in our analyses. The purpose of using Mean Polity IV Growth in the regression analyses is to test whether the economic performance of political regimes is relevant to respondents’ Demand for democracy. The data on economic growth used to calculate Mean Polity IV Growth are from Penn World Table 8.1, which covers the period 1950-2011 (Feenstra, Inklaar, & Timmer, 2015). I used the variable RGDPNA (Real Gross Domestic Product based on National Accounts) to calculate the growth rate (Feenstra, Inklaar, & Timmer, 2013). Missing values with valid values in both the previous and the following years were replaced by the mean value of these two years. Penn World Table does not have data on Algeria, which means that I could not calculate Polity IV Growth for the 1,204 respondents of this country. The other missing values for this variable are related to people aged 18 years (in some countries 18, 19, or 20 years) because there was no data on economic growth for their still-short adult lives. For each year, the growth rate was clustered around the global average growth rate. That is, growth rates below the yearly average resulted in a negative value, and the ones above the average resulted in positive values. The result is that for each country-year, the variable Polity IV Growth has a positive value if either the political regime was a democracy and economic growth was above the world average or the country was a non-democracy and growth was below the average. The value was negative in the reverse situations. If respondents develop their attitudes toward democracy based on the economic performance of the regime, they would be a bit more pessimistic about democracy after each year of bad economic performance, and a bit more optimistic after each year of high economic growth. If they Copyright © Afrobarometer 2015 5 Afrobarometer Working Papers lived in a non-democracy, they would be more hopeful that democracy would give them a better life after each year of bad economic performance of their authoritarian regime, and would regard democracy as less necessary after each year of good economic performance. Control variables In addition to the independent variables on exposure to democracy and to a categorical variable representing the countries, the regression models contain several control variables that are known to influence demand for democracy. Formal education increases individuals’ capacity for abstract thinking and consequently allows them to have a better understanding of how democracy works (or should work) and to feel more confident in their ability to participate in public debates (Donovan & Karp, 2006; Mattes & Bratton, 2007). Even though Education in Afrobarometer data is an ordinal variable, I treat it as numeric, with its 10 categories ranging from 0 (no formal schooling) to 1 (postgraduate). On the one hand, as citizens become older, they accumulate experience with their country’s political system and can understand it better. This effect is similar to gaining years in school, although never as powerful as what can be achieved with formal education. On the other hand, given the current demographic profile of African countries, older people are less educated than younger people. Consequently, the impact of Age on Demand for democracy is clearer when controlled by Education. Another reason to add Age as a control variable in the models is that Age represents accumulated experience, and our four independent variables might be considered different dimensions of this experience. The variable Age was divided by 100. Many studies using survey data add Income as a control variable in their models. Afrobarometer does not ask respondents directly about their income, but it does have questions whose answers are associated with income. Individuals who lack basic material necessities will be more worried about survival than about freedom. Consequently, it is expected that they will more promptly accept alternatives to democracy than most citizens if they perceive these alternatives as having a higher potential to improve their material lives. Following Mattes (2008) and others,5 I use the battery of five questions on whether the respondent has gone without enough food, water, medicines, cooking fuel, or cash income to build a Lived poverty index. The contribution of each item to the index ranges from 0 (if the respondent never went without the item) to 5 (if the respondent “always” went without the item). Lived poverty is the average value of the five variables divided by 5. I also use a battery of questions on the ownership of goods (radio, television, motor vehicle, and mobile phone) to build an Individual affluence index. The value of the index is the mean number of owned items. A social condition especially relevant in the African context is belonging to a specific ethnic group. People sometimes feel that their ethnic group is treated unfairly by the government, and the way they make this judgment may be by comparing the living standards of their group with those of other groups. I expect that the resentment of individuals from less affluent ethnic groups will result in less Demand for democracy. Thus, in addition to calculating Individual affluence, I calculate an indicator of Ethnic affluence, which is the mean value of the Individual affluence index for each ethnic group in a country. Logan and Bratton (2006) have shown that women mostly have the same attitudes as men regarding Demand for democracy but replied “Don’t know” more frequently than men to the questions used to build the index of Demand for democracy. Women are also slightly more likely than men to accept one-party rule due to fear of violence (Logan & Bratton, 2006). Hence I add the variable Gender to the regression models to complete the set of basic demographic variables. 5 See Isaksson (2010) and Dulani et al. (2013). Copyright © Afrobarometer 2015 6 Afrobarometer Working Papers The perception that the state adequately supplies democracy increases the legitimacy of the system and, consequently, regime stability (Zuern, 2009). Using Afrobarometer data, several authors6 have measured this perception with an index of Supply of democracy, built by combining the answers to two questions: “In your opinion, how much of a democracy is your country today?” and “Overall, how satisfied are you with the way democracy works in your country?” For the first question, I coded responses as 1 if they were “A full democracy” or “A democracy with minor problems” and as 0 otherwise. For the second question, the value 1 was attributed to answers “Fairly satisfied” and “Very satisfied.” In both cases, “Don’t know” was coded as 0. The index is the mean value of the two indicators. One of the variables used to calculate Demand for democracy is respondent approval or disapproval of the president governing without Parliament. Previous research has found that demand for democracy is lower among those who voted for a winner because they see Parliament as a hindrance to the president’s actions. Those who voted for a loser have the hope that democracy will bring to power a candidate of their preferred political party (Bratton, 2004). Winners are also less willing to defend democracy (Moehler, 2009). For this reason, I added the intention to Vote for ruling party as a control variable.7 Results Tables 1, 3, 4, and 5 show the results of OLS regressions explaining Demand for democracy. The number of countries covered depends on the control variables included in the models. In all tables, for models with Years of democracy and Years of non-democracy, only countries that have both democratic and authoritarian years in their recent history are included. The number of countries in other models depends on the availability of data. In all tables, instead of asterisks to highlight statistical significance, I opted for showing in parentheses the t-statistic of each coefficient, and I will consider significant the coefficients whose absolute t-statistic value is above 2.8 The relationship between the independent variables and Age, and between Age and Education, are central to a proper understanding of the effects of the independent variables on Demand for democracy. Hence, we will first examine the regression models of Table 1 containing only the control variables. Vote for ruling party has the expected negative effect on Demand for democracy, while Supply of democracy, Individual affluence, and Education have the expected positive effect. Women demand democracy less than men. However, as Logan and Bratton (2006) found, women are twice as likely as men to reply that they “don’t know” (Table 2), and given the way Demand for democracy was calculated, this implies lower index values. 6 See Bratton & Chang, 2006; Mattes & Bratton, 2007; and Bratton & Gyimah-Boadi, 2015. 7 Table A.1 in the appendix shows the list of ruling parties during Afrobarometer surveys. 8 We can roughly say that if the absolute value of the t-statistic is 2, the coefficient has a 95% of chance of being significant; if it is higher than 3, the chances are 99%; and so on. Copyright © Afrobarometer 2015 7 Afrobarometer Working Papers Table 1: OLS: Demand for democracy (control variables only) Model 1 Model 2 (Intercept) 0.67 (50.97) 0.73 (75.55) Algeria -0.29 (-26.68) Botswana 0.00 (0.43) -0.00 (-0.14) Burkina Faso -0.09 (-8.00) -0.08 (-7.61) Burundi 0.00 (0.32) -0.02 (-1.99) Cameroon -0.10 (-8.72) -0.10 (-8.60) Cape Verde -0.03 (-2.75) Côte d'Ivoire 0.03 (2.53) 0.03 (3.07) Egypt -0.23 (-21.17) Ghana 0.02 (1.87) 0.02 (1.93) Guinea -0.05 (-4.77) -0.06 (-5.07) Kenya -0.07 (-7.17) -0.07 (-7.45) Lesotho -0.12 (-11.02) -0.13 (-11.59) Liberia 0.03 (2.73) 0.02 (1.41) Madagascar -0.22 (-19.13) -0.24 (-21.85) Malawi 0.03 (2.78) 0.01 (0.57) Mali -0.13 (-12.20) -0.13 (-11.54) Mauritius -0.00 (-0.23) 0.02 (1.98) Morocco -0.23 (-21.00) Mozambique -0.22 (-23.07) -0.23 (-23.76) Namibia -0.11 (-9.90) -0.12 (-10.45) Niger -0.12 (-10.51) -0.13 (-11.60) Nigeria -0.09 (-8.88) -0.08 (-8.40) Senegal 0.03 (2.64) 0.04 (3.22) Sierra Leone -0.00 (-0.23) -0.01 (-1.33) South Africa -0.19 (-19.13) -0.18 (-18.43) Sudan -0.27 (-24.33) Tanzania 0.00 (0.10) -0.01 (-1.07) Togo -0.08 (-7.69) -0.09 (-8.07) Tunisia -0.22 (-19.68) Uganda 0.05 (5.35) 0.04 (4.02) Zambia 0.08 (7.42) 0.07 (6.60) Zimbabwe -0.05 (-5.28) -0.06 (-5.87) Vote for ruling party -0.02 (-8.24) -0.02 (-8.81) Supply of democracy 0.05 (14.10) 0.04 (14.64) Female -0.04 (-14.69) -0.04 (-16.31) Lived poverty -0.00 (-0.57) -0.02 (-3.44) Individual affluence 0.07 (13.38) 0.08 (14.97) Age 0.05 (5.38) 0.05 (5.16) Education 0.17 (22.04) 0.20 (29.41) Ethnic affluence 0.12 (6.43) Adj. R 0.14 0.16 Num. obs. 40990 49135 Num. countries 27 33 Note: t-statistics are shown in parentheses. Copyright © Afrobarometer 2015 Model 3 0.78 (82.38) -0.29 (-25.90) 0.04 (3.45) -0.09 (-7.97) -0.00 (-0.34) -0.05 (-4.87) -0.01 (-0.82) 0.05 (4.63) -0.21 (-18.60) 0.03 (3.13) -0.04 (-3.97) -0.04 (-3.95) -0.10 (-8.93) 0.05 (4.18) -0.22 (-19.62) 0.02 (2.57) -0.14 (-12.47) 0.04 (3.99) -0.22 (-19.44) -0.21 (-21.20) -0.08 (-7.11) -0.13 (-11.75) -0.05 (-5.04) 0.04 (4.06) 0.01 (1.06) -0.14 (-14.80) -0.23 (-20.82) 0.02 (1.59) -0.06 (-5.84) -0.20 (-17.75) 0.07 (7.00) 0.10 (9.53) -0.01 (-1.39) -0.03 (-10.50) 0.04 (13.85) -0.05 (-19.51) -0.04 (-7.36) 0.13 (27.26) -0.03 (-3.48) 0.15 49161 33 8 Afrobarometer Working Papers Table 2: Percent of “Don’t know” responses on components of Demand for democracy | by gender Men Women Supply of democracy 3.2 6.6 Reject one- Reject military Reject oneparty rule rule man rule 2.1 2.6 3.3 4.8 5.4 6.6 Although much less strong than Individual affluence, Ethnic affluence (Model 1) has a significant effect on Demand for democracy, which indicates that ethnic solidarity and grievances play a role in attitudes toward democracy. Because many countries do not have data on ethnicity, models 2 and 3 do not include this variable. Lived poverty has the expected negative effect on Demand for democracy, but it is not significant when the analysis controls for both Education and Ethnic affluence. The most relevant result for our investigation is that Age has a strong positive effect on Demand for democracy, but only when controlling for Education. Without the control of Education, the effect of Age is negative (Model 3). My interpretation of this result is that the variable Age is a proxy for two different mechanisms: People demand more democracy as they become more experienced and acquire a better understanding of politics, but because older people usually have fewer years of schooling, they do not understand abstract concepts such as democracy as well as young people, and consequently they demand less democracy. In models 1 and 2, we can see the effect of people becoming more experienced, while in Model 3 Age as a proxy for lack of education overtakes Age as a proxy for maturity. Turning to models that include the independent variables, Table 3 presents results for models 4, 5, 6, and 7. I added only one independent variable to each model because the four variables are calculated based on the adult life of respondents and thus have some degree of collinearity. In this table, the absolute value of the t-statistic is higher than 2 for two of the four independent variables. However, before jumping to conclusions, we have to see the models that include the other control variables. Table 3: OLS: Demand for democracy (no control variables) (Intercept) Years of non-democracy Years of democracy Mean Polity IV Mean Polity IV Growth Adj. R2 Model 4 0.82 (105.76) -0.01 (-0.42) Model 5 0.79 (84.15) Model 6 0.82 (98.57) Model 7 0.82 (104.27) 0.16 (4.42) 0.00 (0.06) 0.04 (2.33) 0.11 0.11 0.11 0.11 Num. obs. 29724 29724 49893 47180 Num. countries 19 19 33 32 Notes: Country dummy variables omitted from table; t-statistics are shown in parentheses. When the control variables other than Country are added (Table 4), some results are quite different. The main reason for the changes is the addition of the variable Age. The negative effect of Years of non-democracy (Model 8) becomes significant, and, importantly, Age loses its significance when we control for Years of democracy (Model 9), indicating that older people demand democracy more than younger ones, but only because they have been exposed to democracy for a longer time. Interestingly, the significance of Vote for ruling party disappears when we control for either Years of non-democracy or Years of democracy Copyright © Afrobarometer 2015 9 Afrobarometer Working Papers (models 8, 9, 12, and 13). Perhaps voters need years of exposure to democracy to distinguish between current government and political regime and thus to see specific election results in a broader perspective, as a temporary state of affairs that will change in the near future. But why does exposure to non-democracy have the same effect? This is a topic for future research. Table 4: OLS: Demand for democracy (no Ethnic affluence) (Intercept) Female Education Lived poverty Individual affluence Vote for ruling party Supply of democracy Age Years of non-democracy Years of democracy Mean Polity IV Mean Polity IV Growth Adj. R2 Model 8 0.68 (46.66) -0.04 (-12.21) 0.19 (20.98) -0.02 (-2.80) 0.07 (10.86) -0.01 (-1.98) 0.06 (16.98) 0.15 (4.36) -0.14 (-2.96) Model 9 0.69 (62.98) -0.04 (-12.31) 0.19 (21.06) -0.02 (-2.89) 0.07 (10.45) -0.01 (-2.00) 0.06 (17.02) 0.00 (0.09) 0.26 Model 10 0.74 (58.34) -0.04 (-16.29) 0.20 (29.36) -0.02 (-3.44) 0.08 (14.99) -0.02 (-8.81) 0.04 (14.64) 0.03 (1.92) Model 11 0.73 (75.43) -0.04 (-16.20) 0.20 (28.33) -0.02 (-4.04) 0.07 (14.09) -0.02 (-8.49) 0.04 (13.49) 0.05 (5.00) (5.15) -0.01 (-1.68) 0.01 0.15 0.15 0.16 (0.47) 0.15 Num. obs. 29252 29252 49135 46463 Num. countries 19 19 33 32 Notes: Country dummy variables omitted from table; t-statistics are shown in parentheses. Mean Polity IV has no statistically significant effect on Demand for democracy (Model 10). This means that it is not enough to be exposed to high levels of democracy; the exposure must last for years to yield a significant effect on attitudes toward democracy. Polity IV Growth (Model 11) also is not significant, which means that either people’s attitudes toward democracy are not influenced by the economic performance of the regime or the variable could not capture this influence. Finally, Table 5 adds Ethnic affluence to the four models of the previous table. The results are similar. As already mentioned, the main difference is the loss of significance of Lived poverty. The fact that the coefficients of our four independent variables remain practically the same when some countries are excluded increases our confidence that the results are robust. Copyright © Afrobarometer 2015 10 Afrobarometer Working Papers Table 5: OLS: Demand for democracy (all control variables) (Intercept) Female Education Lived poverty Individual affluence Ethnic affluence Vote for ruling party Supply of democracy Age Years of non-democracy Years of democracy Mean Polity IV Mean Polity IV Growth Adj. R2 Model 12 0.60 (31.21) -0.04 (-11.26) 0.16 (15.84) -0.01 (-0.89) 0.07 (9.55) 0.12 (5.32) -0.00 (-1.05) 0.07 (18.55) 0.19 (4.71) -0.19 (-3.61) Model 13 0.62 (39.46) -0.04 (-11.34) 0.16 (15.94) -0.01 (-0.94) 0.06 (9.21) 0.12 (5.30) -0.00 (-1.08) 0.07 (18.58) -0.01 (-0.45) 0.27 Model 14 0.68 (43.47) -0.04 (-14.67) 0.17 (21.98) -0.00 (-0.57) 0.07 (13.40) 0.12 (6.45) -0.02 (-8.23) 0.05 (14.10) 0.03 (2.25) Model 15 0.67 (50.61) -0.04 (-14.68) 0.17 (21.45) -0.00 (-0.76) 0.07 (13.15) 0.12 (6.33) -0.02 (-8.41) 0.05 (13.89) 0.05 (4.74) (5.04) -0.01 (-1.45) 0.01 0.14 0.14 0.14 (0.45) 0.14 Num. obs. 25395 25395 40990 39795 Num. countries 16 16 27 27 Notes: Country dummy variables omitted from table; t-statistics are shown in parentheses. Conclusion The main argument of this paper is that people living under democracy learn about how democracy works and become more committed to it. They not only say that democracy is the best political regime available, but they also reject military government, single-party rule and presidential dictatorship. Previous studies have shown that the economic performance of political regimes does not significantly influence demand for democracy. In order to test these hypotheses, I created individual-level variables reflecting exposure to both democracy and economic conditions. Like Mattes and Bratton (2007), I did not find evidence that national economic performance is relevant for Demand for democracy. However, I found evidence in support of the hypothesis that exposure to democratic institutions – measured as the number of years lived under either democracy or non-democracy – has a statistically significant, though substantively small, effect on Demand for democracy. One possible explanation for this difference in results is that important control variables included in Mattes and Bratton’s investigation are not included in this research, such as an indicator of whether the postcolonial regime restricted political rights to citizens of European descent and the type of understanding of democracy (substantive or procedural) that individuals have. Another possibility is that Polity IV scores capture the dichotomy between democracy and authoritarianism better than the variable used by Mattes and Bratton. I expected that Mean Polity IV would be a better measure of exposure to democracy than both Years of democracy and Years of non-democracy. However, only the latter, simpler variables proved to be relevant. The results here are quite similar to what I found in analogous research on Latin America (Aquino, 2015). In that case, considering a t value of |2| as a threshold, the number of years under democracy had a positive and significant effect on Demand for democracy (t=2.76), and the effect of the number of years under nondemocratic regimes was negative and significant (t=−2.75) while the mean value of Polity IV Growth was not significant (t=0.67). The only difference was that the mean value of Polity IV Copyright © Afrobarometer 2015 11 Afrobarometer Working Papers during adult life was weakly significant (t=2.02) in Latin America, while it is not significant in Africa (models 6, 10, and 14). Democracy is in constant peril of being either undermined by impatient losers or overcome by greedy winners, but the results presented in this paper show that Vote for ruling party was not significant when controlled by either Years of democracy or Years of non-democracy. Overall, the results allow some optimism regarding the future of democracy: As people live under democracy, they internalize its core values, improving its chances of consolidation. Copyright © Afrobarometer 2015 12 Afrobarometer Working Papers References Aquino, J. A. (2015). Do democratic institutions forge a demand for democracy? An investigation of Latin American citizens’ attitudes. 73rd Annual Midwest Political Science Association Conference. Midwest Political Science Association, Chicago. Bratton, M. (2004). The “alternation effect” in Africa. Journal of Democracy, 15(4),147–158. Bratton, M. (2007). Formal versus informal institutions in Africa. Journal of Democracy, 18(3), 96– 110. Bratton, M., & Chang, E. C. C. (2006). State building and democratization in sub-Saharan Africa: Forwards, backwards, or together? Comparative Political Studies, 39(9), 1059–1083. Bratton, M., Chikwana, A., & Sithole, T. (2005a). Propaganda and public opinion in Zimbabwe. Journal of Contemporary African Studies, 23(1), 77–108. Bratton, M. and Gyimah-Boadi, E. (2015). Political risks facing African democracies: Evidence from Afrobarometer. Afrobarometer Working Paper, (157). Bratton, M., Mattes, R. B., & Gyimah-Boadi, E. (2005b). Public opinion, democracy, and market reform in Africa. Cambridge, UK, and New York: Cambridge University Press. Diamond, L. (2015). Facing up to the democratic recession. Journal of Democracy, 26(1),141–155. Donovan, T., & Karp, J. A. (2006). Popular support for direct democracy. Party Politics, 12(5), 671– 688. Dulani, B., Mattes, R., & Logan, C. (2013). After a decade of growth in Africa, little change in poverty at the grassroots. Afrobarometer Policy Brief No. 1. Available at www.afrobarometer.org. Eckstein, H. (1988). A culturalist theory of political change. American Political Science Review, 82(3), 789–804. Feenstra, R. C., Inklaar, R., & Timmer, M. P. (2013). PWT 8.0: A user guide. Feenstra, R. C., Inklaar, R., & Timmer, M. P. (2015). The next generation of the Penn World Table. American Economic Review, (forthcoming). Gyimah-Boadi, E. (2015). Africa’s waning democratic commitment. Journal of Democracy, 26(1),101– 113. Isaksson, A.-S. (2010). Political participation in Africa: Participatory inequalities and the role of resources. Working Papers in Economics, (462). Logan, C., & Bratton, M. (2006). The political gender gap in Africa: Similar attitudes, different behaviors. Afrobarometer Working Paper No. 58. Available at www.afrobarometer.org. Marshall, M. G., Jaggers, K., & Gurr, T. R. (2014). Polity IV project: Political regime characteristics and transitions, 1800–2013. Vienna, VA. Mattes, R. (2008). The material and political bases of lived poverty in Africa: Insights from the Afrobarometer. CSSR Working Paper (216). Mattes, R., & Bratton, M. (2007). Learning about democracy in Africa: Awareness, performance, and experience. American Journal of Political Science, 51(1), 192–217. Moehler, D. C. (2009). Critical citizens and submissive subjects: Election losers and winners in Africa. British Journal of Political Science, 39(2), 345–366. Moehler, D. C., & Lindberg, S. I. (2009). Narrowing the legitimacy gap: Turnovers as a cause of democratic consolidation. The Journal of Politics, 71(4), 1448–1466. Zuern, E. (2009). Democratization as liberation: Competing African perspectives on democracy. Democratization, 16(3), 585–603. Copyright © Afrobarometer 2015 13 Afrobarometer Working Papers Appendix Table A.1: Proportion of respondents, by country, who said they would vote for the ruling party Country Survey period Ruling party Begin End Algeria 27/01/13 19/02/13 National Liberation Front Benin 16/11/11 06/12/11 Cowry Forces for an Emerging Benin Botswana 30/06/12 12/07/12 Botswana Democratic Party Burkina Faso 03/12/12 17/12/12 Congress for Democracy and Progress Burundi 28/11/12 10/12/12 Nat. Council for the Defense of Democr. Cameroon 17/03/13 02/04/13 Cameroon People's Democratic Mov. Cape Verde 03/12/11 17/12/11 African Party of Indep. of Cape Verde Côte d’Ivoire 11/03/13 26/03/13 Rally of the Republicans Egypt 08/03/13 19/03/13 Freedom and Justice Party Ghana 08/05/12 27/05/12 National Democratic Congress Guinea 23/03/13 12/04/13 Rally of the Guinean People Kenya 02/11/11 29/11/11 Party of National Unity Lesotho 26/11/12 29/12/12 Lesotho Congress for Democracy Liberia 25/06/12 25/07/12 Unity Party Madagascar 11/03/13 07/04/13 Young Malagasies Determined Malawi 04/06/12 01/07/12 Peoples' Party Mali 16/12/12 10/01/13 Alliance for Democracy in Mali Mauritius 07/01/12 26/02/12 Labour Party Morocco 27/04/13 30/05/13 Party of Justice and Development Mozambique 17/11/12 09/12/12 Mozambique Liberation Front Namibia 19/11/12 18/12/12 South West Africa People's Organization Niger 31/03/13 15/04/13 Nigerien Party for Democ. and Socialism Nigeria 30/10/12 19/01/13 People's Democratic Party Senegal 18/02/13 02/03/13 Alliance for the Republic Sierra Leone 23/06/12 17/07/12 All People's Congress South Africa 20/10/11 30/11/11 African National Congress Sudan 13/02/13 23/02/13 National Congress Party Tanzania 28/05/12 30/06/12 Chama Cha Mapinduzi Togo 17/12/12 29/12/12 Union for the Republic Tunisia 10/01/13 01/02/13 Ennahda Movement Uganda 02/12/11 28/02/12 National Resistance Movement Zambia 21/01/12 19/02/13 Patriotic Front Zimbabwe 16/07/12 30/07/12 Zimbabwe African National Union Note: I used information on ruling parties available on Wikipedia. Prop. Copyright © Afrobarometer 2015 14 0.16 0.48 0.51 0.44 0.53 0.40 0.30 0.21 0.11 0.31 0.45 0.21 0.16 0.37 0.11 0.47 0.15 0.28 0.13 0.65 0.61 0.30 0.32 0.42 0.39 0.50 0.36 0.57 0.35 0.15 0.47 0.47 0.32 Afrobarometer Working Papers Recent Afrobarometer working papers No. 159 Tsubura, Machiko. Does clientelism help Tanzanian MPs establish long-term electoral support? 2015 No. 158 Claire, Adida L., Karen E. Ferree, Daniel N. Posner, & Amanda L. Robinson. Who’s asking? Interviewer coethnicity effects in African survey data. 2015 No.157 Bratton, Michael & E. Gyimah-Boadi. Political risks facing African democracies: Evidence from Afrobarometer. 2015 No.156 Croke, Kevin, Guy Grossman, Horacio A. Larreguy, & John Marshall. Deliberate disengagement: How education decreases political participation in electoral authoritarian regimes. 2015 No.155 Bleck, Jaimie & Kristin Michelitch. On the primacy of weak public service provision in rural Africa: Malians redefine ‘state breakdown’ amidst 2012 political crisis. 2015 No.154 Leo, Benjamin, Robert Morello, & Vijaya Ramachandran. The face of African infrastructure: Service availability and citizens’ demands. 2015 No. 153 Gottlieb, Jessica, Guy Grossman, & Amanda Lea Robinson. Do men and women have different policy preferences, and if so, why? 2015 No.152 Mattes, Robert & Samantha Richmond. Are South Africa’s youth really a ‘ticking time bomb’? 2015 No.151 Mattes, Robert. South Africa’s emerging black middle class: A harbinger of political change? 2014 No. 150 Cheeseman, Nic. Does the African middle class defend democracy? Evidence from Kenya. 2014 No. 149 Schaub, Max. Solidarity with a sharp edge: Communal conflict and local collective action in rural Nigeria. 2014 No.148 Peiffer, Caryn & Richard Rose. Why do some Africans pay bribes while other Africans don’t? 2014 No.147 Ellis, Erin. A vote of confidence: Retrospective voting in Africa. 2014 No.146 Hollard, Guillaume & Omar Sene. What drives quality of schools in Africa? Disentangling social capital and ethnic divisions. 2014 No.145 Dionne, Kim Yi, Kris L. Inman, & Gabriella R. Montinola. Another resource curse? The impact of remittances on political participation. 2014 No.144 Carlson, Elizabeth. Social desirability bias and reported vote preferences in Africa surveys. 2014 No.143 Ali, Merima, Odd-Helge Fjeldstad, & Ingrid Hoem Sjursen. To pay or not to pay? Citizens’ attitudes towards taxation in Kenya, Tanzania, Uganda and South Africa. 2013 No.142 Bodenstein, Thilo. Ethnicity and individual attitudes towards international investors: Survey evidence from sub-Saharan Africa. 2013 No.141 Bandyopadhyay, Sanghamitra & Elliott Green. Pre-colonial political centralization and contemporary development in Uganda. 2012 No.140 Sacks, Audrey. Can donors and non-state actors undermine citizens’ legitimating beliefs. 2012 No.139 Justesen, Mogens K. & Christian Bjørnskov. Exploiting the poor: Bureaucratic corruption and poverty in Africa. 2012 No.138 De Luca, Giacomo & Marijke Verpoorten. From vice to virtue? Civil war and social capital in Uganda. 2012 Copyright © Afrobarometer 2015 15 Afrobarometer Working Papers Afrobarometer Working Papers Series Editor: Michael Bratton, [email protected] Editorial Board: E. Gyimah-Boadi, Carolyn Logan, Robert Mattes, Leonard Wantchekon Afrobarometer publications report the results of national sample surveys on the attitudes of citizens in selected African countries toward democracy, markets, civil society, and other aspects of development. Afrobarometer publications are simultaneously co-published by the six Afrobarometer Core Partner and Support Unit Institutions. All Afrobarometer publications can be searched and downloaded from our website at www.afrobarometer.org. Support for Afrobarometer is provided by the UK’s Department for International Development (DFID), the Mo Ibrahim Foundation, the Swedish International Development Cooperation Agency (SIDA), the United States Agency for International Development (USAID), and the World Bank. Core partners: Center for Democratic Development (CDD-Ghana) 95 Nortei Ababio Street, North Airport Residential Area P.O. Box LG 404, Legon-Accra, Ghana Tel: +233 21 776 142 Fax: +233 21 763 028 www.cddghana.org Institute for Empirical Research in Political Economy (IREEP) Arconville, Lot 104 - Parcelle J, 02 BP: 372, Cotonou, Republique du Benin Tel: +229 21 363 873/ 229 94 940 108 Fax: +229 21 362 029 www.ireep.org Institute for Development Studies (IDS), University of Nairobi P.O. Box 30197, Nairobi, 00100, Kenya Tel: +254 20 2247968 Fax: +254 20 2222036 www.ids.uonbi.ac.ke Institute for Justice and Reconciliation (IJR) 105 Hatfield Street, Gardens, 8001, Cape Town, South Africa Tel: +27 21 763 7128 Fax: +27 21 763 7138 www.ijr.org.za Support units: Michigan State University (MSU) Department of Political Science East Lansing, MI 48824 Tel: +1 517 353 6590; Fax: +1 517 432 1091 www.polisci.msu.edu Copyright © Afrobarometer 2015 University of Cape Town UCT) Democracy in Africa Research Unit Centre for Social Science Research Private Bag Rondebosch 7701, South Africa Tel: +27 21 650 3827 Fax: +27 21 650 4657 www.cssr.uct.org.za 16
Baixar