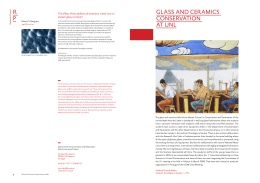
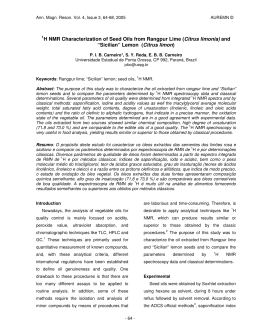
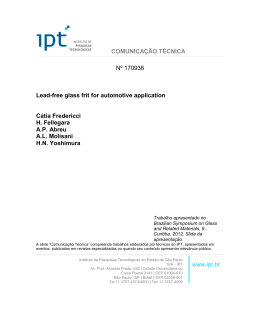
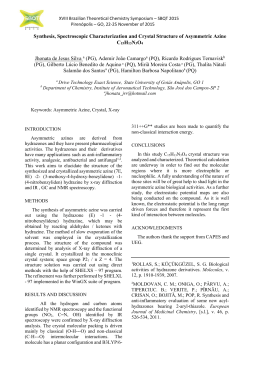
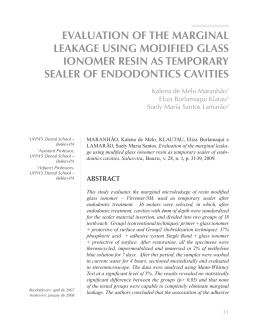
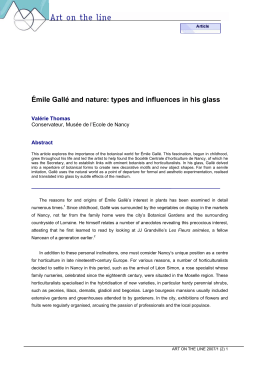
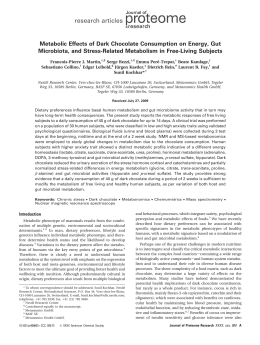
Journal of Non-Crystalline Solids 273 (2000) 8±18 29 www.elsevier.com/locate/jnoncrysol Si MAS±NMR studies of Qn structural units in metasilicate glasses and their nucleating ability J. Schneider a, V.R. Mastelaro a,*, H. Panepucci a, E.D. Zanotto b a Instituto de Fõsica de S~ ao Carlos, Universidade de Sao Paulo, C.P. 369, 13560-970 S~ ao Carlos, SP, Brazil b Departamento de Engenharia de Materiais, UFSCar 13565-905, S~ ao Carlos, SP, Brazil Abstract The purpose of this work is to verify the possible existence of a relationship between the similarity of the local structure of the network-forming cation Si4 (Qn units and chemical shifts) in glasses and isochemical crystals and the nucleating ability of these glasses. Four metasilicate glasses with widely dierent volume nucleation rates: Na2 Ca2 Si3 O9 and Na4 CaSi3 O9 (very large), CaSiO3 (intermediate) and CaMgSi2 O6 (undetectably small) were chosen. We present magic angle spinning nuclear magnetic resonance spectroscopy (MAS±NMR) data for Na2 Ca2 Si3 O9 and Na4 CaSi3 O9 glasses and for their respective isochemical crystalline phases for the ®rst time. Additionally, we repeat NMR measurements of glasses and crystals previously studied by other authors (CaSiO3 and CaMgSi2 O6 ) to test the consistency of our experimental techniques and method of analysis. Dierent central chemical shifts of Q2 resonances in parent glasses and their isochemical crystals were measured, indicating structural dierences. The relative amount of Qn groups in each glass was obtained from the deconvolution of the 29 Si MAS±NMR spectra. The shape of the Qn distribution for each system was considered as a measure of the similarity of the connectivities of SiO4 tetrahedra in each glass with respect to its isochemical crystal (which has only Q2 groups). A correlation was found between the shape of the Qn distribution and the nucleation tendency of these glasses, indicating that similarities between the tetrahedra connectivities in glass and isochemical crystal has a role in determining the internal nucleation tendency of the metasilicate glasses studied. Ó 2000 Elsevier Science B.V. All rights reserved. 1. Introduction One of the authors of this study [1] previously proposed that there are two classes of stoichiometric glass-forming systems: for the ®rst, the volume (presumed to be homogeneous) nucleation rates are experimentally detectable and the temperatures of maximum nucleation rate are the same or greater than the glass transition temper* Corresponding author. Tel.: +55-16 273 9755; fax: +55-16 271 3616. E-mail address: [email protected] (V.R. Mastelaro). ature (Tg ). For typical laboratory conditions, i.e., using centimeter size samples that are heat-treated for a few hours above Tg , the second class of glasses only crystallize heterogeneously by surface nucleation or aided by nucleating agents. For this second family of glasses, the expected temperatures of maximum homogeneous nucleation rates (calculated by the classical nucleation theory) are less than Tg . Thus, it is possible to classify the crystal nucleating ability of dierent systems by this criterion. There are a number of questions concerning the crystal nucleation kinetics in glasses. One of the 0022-3093/00/$ - see front matter Ó 2000 Elsevier Science B.V. All rights reserved. PII: S 0 0 2 2 - 3 0 9 3 ( 0 0 ) 0 0 1 3 9 - 3 J. Schneider et al. / Journal of Non-Crystalline Solids 273 (2000) 8±18 proposed hypotheses postulates that the nucleating tendency depends on the structural similarity between the parent glass and its isochemical crystal phase [2±7]. In qualitative terms, the degree of structural similarity between parent glass and resulting crystal should aect the main thermodynamic parameters controlling nucleation; liquid-crystal surface energy r and thermodynamic driving force DG, thus aecting the nucleation ability of the system. The homogeneous nucleation rate is given by: I K 0 =g exp ÿK 00 r3 =T DG2 , where K 0 , K 00 are constants, g is the viscosity and T is the temperature. Hence, the surface energy dominates due to its power-3 against power-2 for DG. The exact relationships of the structural parameters of glass and crystal with surface energy and driving force are not known; however, there should be some optimum structural similarity. This idea is clari®ed if we analyze two limiting cases: (i) when the structures of glass and isochemical crystal are too dierent, then r should be too large, inhibiting nucleation. On the other hand, in the hypothetical case, (ii) when the structures of glass and crystal are almost identical, r should vanish (which would enhance nucleation), however, DG should also tend to zero, precluding nucleation. To further test this hypotheses, in this article we measure and compare the local structures of the network-forming cation Si4 (Qn groups) in four metasilicate glasses that have dierent volume nucleation rates, i.e.: Na2 Ca2 Si3 O9 and Na4 CaSi3 O9 (largest), CaSiO3 (intermediate) and CaMgSi2 O6 (undetectable nucleation rates). 2. Literature review We will sum up here some of the most relevant studies that propose the existence of a structural relationship between the parent glass and its isochemical crystal and the nucleating ability of the glass. In 1984, Schramm et al. [3] analyzed the devitri®cation of lithium silicate glasses using 29 Si magic angle spinning nuclear magnetic resonance (MAS±NMR). Their studies concentrated on glassy and crystalline Li2 O±2SiO2 (LS2). They 9 found that the most abundant species in LS2 glass are the Q3 species (3 is the number of bridging oxygen per SiO4 tetrahedra). In fact, they obtained the following distribution of Qn species: 22% Q2 , 57% Q3 , 14.6% Q4 and 6.4% Q0 Q1 . As the LS2 crystal should have 100% Q3 , the authors mentioned that the glass had a suciently large concentration of Q3 units to induce crystallization. Moreover, the mean chemical shift of Q3 ()92 ppm) in the glass was similar to that observed in its crystalline phase ()93 ppm). Based on the correspondence of the chemical shifts, they suggested that the local silicon environments in both phases are similar and concluded that glasses of the Li2 O± SiO2 system easily nucleate (which, in fact, they do) because the local environment of silicon in the glass is compatible with those in the isochemical crystal. We will show later that this relationship between the chemical shifts of glasses and crystals that easily nucleate does not hold true for a number of systems. Dickinson [4] compared the structure of glassy and crystalline K2 TiSi3 O9 and analyzed the hypothesis that structural similarity/dissimilarity between the amorphous and crystalline phases could aect nucleation. Heat treatments of glassy K2 TiSi3 O9 showed that only surface crystallization took place. Using Raman spectroscopy and extended X-ray absortion ®ne structure (EXAFS), he observed that there is a clear dierence in the local structures of crystalline and glassy K2 TiSi3 O9 . Whereas the short-range structure of the crystal is typical of metasilicates, with the intermediate range order of ring silicates, the structure of the glass does not have this type of local and intermediate range structure. Instead, the glass contains more polymerized species (three bridging oxygens, BO), in addition to species with two BO. Furthermore, he observed that the largest dierence is in the Ti coordination, for which there is a change in coordination from the regular octahedron of the crystal to mixed 5- and 6-coordination in the glass. Dickinson [4] attributed this large dierence in the structures of the crystalline and glassy phases to the fact that this glass has an undetectably small volume nucleation rate. Looking at it from a more macroscopic structural perspective, Zanotto and Muller [5] proposed 10 J. Schneider et al. / Journal of Non-Crystalline Solids 273 (2000) 8±18 a simple method to predict the nucleation tendency in glass. Their approach was based on the following argument: if the structures of both glass and isochemical crystal phases are similar for compositions that nucleate homogeneously, then the mass densities, q, of glass and crystal must be similar. On the other hand, large dierences between the densities of glass and crystal should be expected for compositions that nucleate heterogeneously. After analyzing the densities of isochemical glassy and crystalline phases for various stoichiometric systems belonging to both families, they concluded that if the density dierence between a glass and its crystalline phase is signi®cant (>10%), it will most likely only nucleate heterogeneously. On the other hand, if the densities are comparable, homogeneous crystal nucleation could occur. In fact, they found some exceptions to this rule because some glasses that only nucleate heterogeneously also have similar densities in the crystal phase. They ascribed these exceptions to the fact that comparable densities do not imply similar structures for glass and crystal, but that the opposite is true, i.e., dierent densities denote distinct structures. Thus, they concluded that similar densities for glass and isochemical crystal is a necessary but not sucient condition for structural similarity and, inferentially for homogeneous nucleation. Using the classi®cation proposed in Ref. [5], for the metasilicate glasses considered in this study we ®nd that glassy and crystalline Na2 Ca2 Si3 O9 , Na4 CaSi3 O9 and CaSiO3 have density dierences Dq=qglass of 1.8%, 3.8%, and 6.6%, respectively, while this dierence is 18.5% for CaMgSi2 O6 . Indeed, volume nucleation is easily detected in the ®rst three systems, while the last only has surface nucleation on laboratory scale. However, as comparable densities for glass and crystal do not unequivocally imply similar structures, it would be interesting to obtain quantitative structural data for the above systems. We will show later that the local structures of the network modi®er cation, Ca, have been determined in two of these systems. Hence, in this work, we extend the structural analysis to the network-forming atoms, Si, for these systems. Muller et al. [6] tested the hypotheses that structural similarity at a molecular level between glass and crystal should favor volume nucleation. Literature data for the molecular structures of several silicate glasses that nucleate homogeneously and heterogeneously were critically analyzed. A comparison was made with the structures of their equilibrium crystalline phases. Muller et al. did, in fact, observe that for glasses in which homogeneous nucleation occurs, the structural arrangements in glass and isochemical crystal appear to be similar while for glasses displaying heterogeneous nucleation, the local structures of glass and crystal is dierent. In short, they concluded that it is possible to predict the nucleation tendency by comparing the molecular structure of the glass and the phase crystallized from such glass. However, we emphasize that only available literature data resulting from a number of dierent studies and often employing dierent structural techniques, were used in the study of Muller et al. [6]. Recently, aiming at more systematic results regarding the short range structure around the network modi®ers in glasses and crystals, Mastelaro et al. [7] undertook an EXAFS analysis of calcium and lead in three dierent silicate glasses: CaSiO3 and Na2 Ca2 Si3 O9 (for which volume nucleation is observed) and PbSiO3 (for which nucleation only occurs on samples surfaces). The results indicated that, for the two glasses that nucleate internally, the local structure of Ca was similar to its short-range order in the corresponding crystalline phases. On the other hand, the short-range order of the glass that only nucleates heterogeneously diered from that of its isochemical crystal. Hence, the proposed relationship between the local structure and the nucleation mechanism was corroborated by the EXAFS analysis. As demonstrated in the summary of previous research, there is growing evidence to support the hypotheses that glasses that have detectable homogeneous nucleation rates have local structures similar to the crystalline phases formed in them, and vice versa. However, quantitative structural information using the same experimental technique for glasses and isochemical crystals (synthesized by devitri®cation), for both classes of systems, were only obtained for the network J. Schneider et al. / Journal of Non-Crystalline Solids 273 (2000) 8±18 11 modi®ers. Therefore, the purpose of this work is to make a quantitative analysis of the short-range structure around the network-forming cation Si4 (Qn groups). With this information, we hope to verify the possible relationship of these groups in glass and corresponding crystal with the nucleation tendency. Four stoichiometric metasilicate glasses having dierent volume nucleation rates are considered. Quantitative 29 Si MAS±NMR spectra were obtained for these glasses and their corresponding crystalline phases obtained by devitri®cation. 3. Experimental The glasses were prepared by melting homogeneous mixtures of analytical grade reagents in 100-ml Pt crucibles, in electric furnaces. The melting temperatures ranged from 1450°C to 1550°C, with a hold time of about 2 h. The liquids were then cast between cold steel plates and manually pressed at an estimated cooling rate between 100°C/s and 500°C/s. To obtain fully crystallized samples, the specimens were subjected to nucleation and development treatments, which were chosen after a differential scanning calorimetry (DSC) analysis. The Na2 Ca2 Si3 O9 glass sample was heated at 600°C for 24 h and then at 690°C for 20 min; the Na4 CaSi3 O9 glass sample was heated at 505°C for 12 h and then at 596°C for 8 h; the CaSiO3 glass sample was heated at 725°C for 120 h and then at 885°C for 12 h and, ®nally, the CaMgSi2 O6 glass sample was heated at 874°C for 22 h and then at 877°C for 25 h. The four metasilicate glasses measured in this work have dierent internal nucleation rates: Na4 CaSi3 O9 Imax 1014 mÿ3 sÿ1 , Na2 Ca2 Si3 O9 1012 mÿ3 sÿ1 , CaSiO3 106 mÿ3 sÿ1 and CaMgSi2 O6 < 103 mÿ3 sÿ1 [1]. The crystalline phases obtained through devitri®cation were measured by X-ray diraction (XRD). Diractograms were obtained in an automatic difractometer (Rigaku Rota¯ex model RU200B), with nickel ®ltered CuKa radiation Figs. 1 and 2 present the XRD patterns (1.540 A). of the Na2 Ca2 Si3 O9 and Na4 CaSi3 O9 (Figs. 1(a) and (b)) and CaSiO3 and CaMgSi2 O6 (Figs. 2(a) and (b)). Fig. 1. XRD patterns of Na2 Ca2 Si3 O9 and Na4 CaSi3 O9 crystalline phases. High resolution 29 Si±NMR spectra were obtained in magnetic ®eld of 9.4 T, at a frequency of 79.45 MHz, with a spectrometer (Varian Unity INOVA). Measurements were carried out under magic-angle sample spinning (MAS) of up to 5 kHz, using a 7 mm wide-body CP/MAS probe (from Varian) and 7 mm zirconia rotors. The spectra were obtained from Bloch decay (BD) signals after p/2 pulses of 4 ls length. Relatively long recycle times were used to avoid any possible eects of dierential relaxation across the inhomogeneously broadened NMR line. No saturation of the NMR signal was detected using recycle times exceeding 250 s. Up to 600 free induction decay (FID) signals were collected and averaged. The resonance line of a polycrystalline kaolinite sample was used as the secondary external standard for referencing chemical shifts ()91.2 ppm in respect to tetrametilsilane, TMS). 12 J. Schneider et al. / Journal of Non-Crystalline Solids 273 (2000) 8±18 Fig. 3. High resolution 29 Si±NMR spectra of crystalline samples. Arrows points to resonance lines associated with impurity phases present in the specimens (see text for details). Fig. 2. XRD patterns of CaSiO3 and CaMgSi2 O6 phases. 4. Experimental results The XRD patterns presented in Figs. 1 and 2 were indexed according to the JCPDS powder diraction ®les [8±11]. However, one or two crystallographic peaks in the XRD could not be indexed, indicating that the solids obtained after the crystallization could contain minor quantities of other crystalline phases. We used the crystalline compounds as a reference for the interpretation of the NMR spectra of the glasses. Fig. 3 shows the high-resolution 29 Si±NMR spectra of the four crystalline samples. A number of resonance lines can be observed, with a full with at half maximum (FWHM) typically less than 2 ppm. Table 1 shows the results for the isotropic chemical shift and the integrated intensity of each line, obtained from a multiple lorentzian ®tting to the experimental data. The attribution of NMR lines to Qn groups was done by considering the stoichiometry and crystallographic data of each material. Fig. 4 shows the 29 Si±NMR spectra of the corresponding samples. For each glass, a resonance line covers the chemical shift range of silicon in several Qn groups with n 0; . . . ; 4. A deconvolution of the spectra was performed to obtain the Qn distribution, using the common assumption of Gaussian distributions of isotropic chemical shifts for each type of Qn unit [12±14]. Unfortunately, overlapping of Qn resonances frequently occur, giving co-variances between best-®t intensity parameters and, consequently, to uncertainties regarding the relative populations of the Qn species. To minimize these problems, some physical criteria were imposed on the ®tting procedure to discard unrealistic numerical results. Thus, FWHMs of individual Gaussians were re- J. Schneider et al. / Journal of Non-Crystalline Solids 273 (2000) 8±18 13 Table 1 Isotropic chemical shifts and line intensities of the 29 Si±NMR lines of the crystalline samples (possible identi®cation of minor phases are discussed in the text) Crystal Center (ppm) 2 )88.2 0.3 )90.4 0.3 )92.8 0.3 )a )a )a b )76.7 0.2 )85.0 0.3 )87.0 0.3 71 )a )a Q2 Q2 c )83.5 0.4 )87.8 0.2 )88.9 0.2 )89.5 0.2 81 28 5 29 5 35 5 Q2 Q2 Q2 d )82.0 0.5 )84.0 0.2 )88.0 0.5 52 77 4 18 3 Na2 Ca2 Si3 O9 Q Na4 CaSi3 O9 Q2 Q2 Wollastonite Diopside Area (%) e a Strongly overlapped. Impurity phase, possibly Na2 SiO3 . c Impurity phase, pseudo wollastonite. d Impurity phase, orto-ensteatite. e Impurity phase, wollastonite. b Fig. 4. High resolution stricted to less than 20 ppm, based on the chemical shifts observed in dierent crystalline silicates [15]. In addition, the centers of adjacent Gaussians from dierent Qn units had to be separated by more than 5 ppm. The number of Gaussians used in each case was determined by the chemical shift range spanned by the NMR spectrum and other spectral features, such as partially resolved bumps or asymmetries. With these criteria, up to four partially overlapped Gaussian distributions were needed to deconvolute these spectra. Equivalent acceptable ®ttings were obtained from deconvolutions with three and four Gaussian functions. To choose the physically signi®cant ®ttings, stoichiometric criteria and literature data of chemical shifts were considered. For glassy wollastonite and diopside, though small, there is an appreciable spectral intensity in the chemical shift range of Q4 ()115 to )100 ppm), which is rarely overlapped with Q3 [15]. It is, therefore, possible to ensure the existence of Q4 groups in these glasses. Conversely, the NMR 29 Si±NMR spectra of glassy samples. spectra of glassy Na2 Ca2 Si3 O9 and Na4 CaSi3 O9 samples indicate that there are no Q4 groups in their networks. Additionally, the identi®cation of Q2 resonances was done assuming that the distribution of Qn species in metasilicates must satisfy the stoichiometric condition Q0 + Q1 Q3 + Q4 , so that the average is always Q2 . Thus, the remaining resonances were readily assigned. Table 2 shows the ®tted parameters for the chemical shift distributions of each Qn group in the four samples. For wollastonite and diopside, four Gaussian deconvolutions were performed because of the presence of Q4 groups, while for Na2 Ca2 Si3 O9 and Na4 CaSi3 O9 samples, only three Gaussian functions were used. If a fourth Gaussian is added, its chemical shift cannot be assigned to Q0 or Q4 species. Separations of approximately 7 ppm between the centers of Qn and Qn1 distributions were obtained in all glasses, with FWHM varying from 7 to 12 ppm. Although the Q0 Q1 Q3 Q4 constraint was not imposed in the ®ttings, Table 2 shows that this condition was 14 J. Schneider et al. / Journal of Non-Crystalline Solids 273 (2000) 8±18 Table 2 Chemical shifts, line-widths and integrated intensities of the Composition Crystal d (ppm) 29 Si±NMR lines corresponding to dierent Qn units in the four glassesa Glass Center (ppm) 0:5 ppm FWHMb (ppm) 1 ppm Area (%) Chemical shift dierence for Q2 in crystal ± glass d-center (ppm) Na2 Ca2 Si3 O9 Q1 Q2 Q3 )88.2/)90.4/)92.8 )73.4 )80.0 )88.5 9 10 9 16 5 72 8 12 5 8.2/10.4/12.8 Na4 CaSi3 O9 Q1 Q2 Q3 )85/)87 )70.0 )77.5 )85.3 7 8 9 14 5 67 8 19 7 7.5/9.5 Wollastonite Q1 Q2 Q3 Q4 )75.6 )82.6 )91.8 )103.3 10 11 11 11 20 5 64 8 14 5 21 Diopside Q1 Q2 Q3 Q4 )77.5 )84.0 )92.7 )103.0 11 11 12 12 28 8 43 10 25 6 41 )87.8/)88.9/)89.5 )84 5.2/6.3/6.9 0 a For comparison, the values of isotropic chemical shift d for the main resonance lines in crystals and their dierence respect to the Q2 central chemical shift in glasses are also shown. b FWHM: full width at half maximum. met for all samples, within the uncertainty of the numerical procedures. For clarity, we will describe and compare the results for each glass and crystal separately. 4.1. CaSiO3 (wollastonite) This glass has a small volume nucleation rate. At room temperature, the stable crystalline forms of CaSiO3 contain ÔdreierÕ single chains of silicate tetrahedra [16±18]. Thus, there are three dierent Q2 sites for silicon in the unit cell. The 29 Si±NMR spectrum of the crystalline wollastonite does, indeed, show three resolved resonance lines at )89.5, )88.9 and )87.8 ppm associated with these sites, with 93% of the total integrated intensity observed. These chemical shifts agree with previous observations of Smith et al. [19] and M agi et al. [20], who detected a broader line centered at around )89 ppm. The remaining 7% of the silicon contributing to the NMR spectrum corresponds to a smaller resonance line at )83.5 ppm. Its isotropic chemical shift seems rather shielded to correspond to Q1 chain terminators generated by absent tetrahedra. Furthermore, the existence of a number of non-bridging O±H groups can be disregarded since no 29 Si±NMR signal was detected after 1 H±29 Si cross-polarization experiments performed on this sample. Based on the chemical shift, 4 ppm less shielded than the main resonance lines, we might suggest Al substitution for Si, giving rise to a Q2 (1 Al) silicon resonance. Nevertheless, this substitution is an unlikely possibility because no 27 Al±NMR signal was obtained from Bloch decay experiments, even after considerable signal averaging. Then, the )83.5 ppm resonance probably originates from a small fraction of another of the known forms of wollastonite, diering in the arrangement of the silicate chains. In fact, Magi et al., reported for pseudo-wollastonite a resonance line exactly at )83.5 ppm [20]. The following distribution was obtained from the deconvolution of the NMR spectrum of the glassy wollastonite sample: 20% Q1 , 64% Q2 , 14% J. Schneider et al. / Journal of Non-Crystalline Solids 273 (2000) 8±18 Q3 and 2% Q4 . Thus, the largest amount of silicon in glass and crystal samples corresponds to Q2 groups. It is useful to compare these fractions with those obtained by Zhang et al. [12,14]. They applied a 2D 29 Si±NMR technique to correlate isotropic (MAS) and anisotropic (o-MAS) spectra of glassy wollastonite. They obtained more accurate percentages for the Qn distribution with respect to the usual method of ®tting the 1D MAS spectrum. They obtained Q0 0:7 0:1%, Q1 19:3 0:3%, Q2 54:7 0:3, Q3 24:1 0:5% and Q4 1:1 0:1%, which are comparable with our results (the dierence for the most abundant species, Q2 , is about 15%). Considering that the 2D approach should be more precise, we assume that the Qn determination method used in this work presents a maximum discrepancy of 15%, based on the dierence for the Q2 fraction. As for the center of chemical shift distributions, the ones shown in Table 2 compare with those reported by Zhang et al. [14]: )74.6 ppm for Q1 , )81.7 ppm for Q2 and )90.4 ppm for Q3 . 4.2. CaMgSi2 O6 (Diopside) This sample has an undetectable homogeneous nucleation rate. Crystallographic data of diopside indicates that the silicate tetrahedra are arranged in Ôin®niteÕ linear chains, with only one non-equivalent silicon site in the unit cell [21]. Fig. 3 actually shows that the NMR spectrum of the crystal has three resonance lines. The most intense line (77%), centered at )84 ppm with 0.5 ppm FWHM, corresponds to Q2 units. Two other smaller and broader lines are observed at )88 ppm (18%) and )82 ppm (5%), which are also in the Q2 chemical shift range. Previous NMR measurements made by Smith et al. [19] and M agi et al. [20] have shown a single resonance centered at )85 ppm, a shift comparable to that obtained in our measurement for the strongest resonance, but with 5 ppm FWHM. 27 Al NMR experiments were also performed on our sample; however, no appreciable signal was detected, indicating that Al, if present, are in concentrations too small to be detected by NMR. On the other hand, eects of hydration as those observed by Peck et al. [22] can also be disregarded in this case, because no signal was 15 observed after 1 H±29 Si cross polarization experiments. Therefore, we associated the smaller NMR lines to sample inhomogeneities, possibly distorted wollastonite ()88 ppm line) and orthoenstatite, Mg2 Si2 O6 , ()82 ppm line), the last one according to the measurements reported in Ref. [20]. For the glassy sample, the distribution of Qn units was: 28% Q1 , 43% Q2 , 25% Q3 and 4% Q4 . To the best of our knowledge, only one MAS±NMR experiment has so far been reported for diopside by Murdoch et al. [23]. No quanti®cation of the Qn species was made. The maximum of the spectrum was located at )82.0 ppm and, by analogy with the observed chemical shift of Q2 units in the crystal, Murdoch et al. concluded that the dominant connectivity in the network is Q2 . The deconvolution of our spectrum gives 43% Q2 with a chemical shift at around )83.0 ppm. Therefore, our results agree with those reported in Ref. [23]. 4.3. Na2 Ca2 Si3 O9 As mentioned earlier, this glass has the largest homogeneous nucleation rate in the studied set of samples. In crystalline Na2 Ca2 Si3 O9 , the silicon is organized in six-membered rings with a C2 symmetry [24]. Thus, there are three dierent Si sites with Q2 connectivity in the unit cell. Accordingly, (Fig. 3) the NMR spectrum is composed of three partially resolved resonance lines centered at )88.2, )90.4 and )92.8 ppm. Due to the partially disordered structure of the Na2 Ca2 Si3 O9 crystal, where Na/Ca sites with fractional occupation number were determined from XRD [24], the resonance lines are broader than those from wollastonite and diopside. For the glassy sample, the most satisfactory ®tting gives the following distribution of species: 16% Q1 , 72% Q2 and 12% Q3 . On the other hand, as seen in Table 2, resonance lines in the crystalline state appear more shielded with respect to the center and width of the ®tted Q2 distribution in the glass ()80.0 ppm). 4.4. Na4 CaSi3 O9 This glass has a similarly large homogeneous nucleation rate. As far as we know, crystallographic data are not available for this material. 16 J. Schneider et al. / Journal of Non-Crystalline Solids 273 (2000) 8±18 However, since it is a metasilicate, according to stoichiometric considerations only Q2 groups should exist in the homogeneous crystal. As shown in Fig. 3, there are at least two overlapping lines in the NMR spectra, at approximately )85 and )87 ppm, which are associated with Q2 species. The total width of the group of lines is 4 ppm, a width identical to that observed in the spectrum of crystalline Na2 Ca2 Si3 O9 . Thus, the presence of additional unresolved 29 Si lines cannot be disregarded in Na4 CaSi3 O9 . Also, occupational disorder in the crystalline structure may be responsible for the broadening of the resonance lines, as in Na2 Ca2 Si3 O9 . On the other hand, the NMR spectrum of this crystal has a resonance (0.35 ppm FWHM) centered at )76.7 ppm. In dierent crystal samples prepared from the same glass rod, this signal appeared with varying intensity (from 5% to 8%), without changes in the shape of the other lines. The smaller FWHM of this minor signal indicates that silicon atoms are located in a more ordered structure, as compared with those silicons contributing to the resonances at )85/)87 ppm. Based on this fact, we could assign the )76.7 ppm resonance to an impurity silicate phase, perhaps Na2 SiO3 , which has a single Q2 resonance at )76.8 ppm [20]. For the glassy Na4 CaSi3 O9 sample, the following distribution of Qn units resulted: 14% Q1 , 67% Q2 , 19% Q3 . a function of the central chemical shift for Qn resonance. Na2 Ca2 Si3 O9 , Na4 CaSi3 O9 and wollastonite glasses have similar Qn distributions, Q2 being the most abundant species (72%, 67% and 64±55%, respectively). From the overall shape of these distributions, we propose that the shortrange order around Si4 in the glass is more similar in respect to its crystal phase (where only Q2 connectivities exist) for the systems with sharper distributions. Due to the presence of Q4 units, wollastonite has a slightly wider distribution than Na-containing glasses. Diopside has a substantially smaller content of Q2 species (43%) and, consequently, has the larger Qn distribution among the studied glasses. Therefore, glasses having the greatest nucleating ability have a considerable amount of tetrahedra having the same connectivity as in the crystal phase and a smaller width of the Qn distribution. On the other hand, there are signi®cant dierences between the chemical shifts of the Q2 species in the glasses and isochemical crystals. Resonance in crystalline Na2 Ca2 Si3 O9 , Na4 CaSi3 O9 and wollastonite are systematically more shielded than the corresponding Q2 resonance in glasses. Table 2 shows that the chemical shift dierences are considerable and are even comparable to the FWHM of the Qn distributions in the glasses. Therefore, 5. Discussion As we have brie¯y described before, Schramm et al. [3] reasonably proposed that the LS2 glass (we emphasize that this composition is not a metasilicate) has a high tendency to homogeneous crystallization owing to: (a) Local structural similarity between the glass and crystalline phases, inferred from the similarity of the chemical shifts for Q3 in glassy and crystalline LS2. (b) High concentration of Q3 in the glass (greater than 50%). In the set of metasilicate glasses studied in this work, only criterion (b) applies (for Q2 instead of Q3 ). The overall Qn distribution can be visualized in Fig. 5, where integrated intensities are plotted as Fig. 5. Integrated intensities for the Gaussian Qn distributions of isotropic chemical shift for each glass. The chemical shifts correspond to the centers of the Qn distributions. The points with sticks in the lower part of the plot show the positions of the main Q2 resonance lines observed in the corresponding isochemical crystals. J. Schneider et al. / Journal of Non-Crystalline Solids 273 (2000) 8±18 there are appreciable structural dierences in the environment of Q2 -units in glass and in crystal, despite the similarity in the dominant connectivity (Q2 ) of the network-forming cations, although it is dicult to determine the extent of these dierences. A deshielding eect on the silicon resonance in glass can be produced by geometrical distortions, such as longer Si±O distances or more acute Si±O±Si angles, and by weaker bonds between the modi®er cation and O atoms [15]. It should be noted that, even in crystalline Na2 Ca2 Si3 O9 , there is a 4.5 ppm dierence between two non-equivalent silicon atoms in the same 6-membered ring, a difference comparable to some dierences observed between crystal and glass. Quite surprisingly to us is that the chemical shifts for the Q2 groupings in crystalline and glassy diopside are in close agreement. It is impossible, however, to infer structural similarity from this coincidence because agreement between chemical shifts is only a necessary condition for local similarity. Therefore, similarity in the overall degree of connectivity of the forming cations in glass and crystal, inferred from the shape of the Qn distribution, seems to be more important to internal nucleation than a close structural similarity around the Q2 silicon atoms, probed by the chemical shifts. It is interesting to note (Fig. 5 and Table 1) that the centers of Qn distributions in Na4 CaSi3 O9 glass are systematically shifted by approximately 3 ppm in respect to the corresponding ones in Na2 Ca2 Si3 O9 glass. The same shift is detected for the Q2 species in the crystal: the group of lines are centered at around )90 ppm in Na2 Ca2 Si3 O9 and at )87 ppm in Na4 CaSi3 O9 , spanning a 5 ppm range in the spectrum. Based on these results we suggest a similar structural relationship between the glass and the crystal phase for both compositions. The silicon±oxygen tetrahedra in the crystalline phases are organized in Q2 groups, forming rings (in Na2 Ca2 Si3 O9 and possibly in Na4 CaSi3 O9 ) or chains (in wollastonite and diopside). Though high-resolution 1D-NMR can probe the distribution of Si in terms of Qn units, it shows very little about the topological relationships among these groups. The local range of the 1D-NMR experiment, restricted to a typical radius of 1 nm, gives 17 little information about tetrahedral neighbors outside the ®rst coordination sphere. An exploration of medium range connectivities in glasses with extreme nucleation and qualitatively dierent Qn populations, such as those observed in Na2 Ca2 Si3 O9 and diopside, would be very useful. In summary, the systems that have the largest nucleation rates (Na2 Ca2 Si3 O9 and Na4 CaSi3 O9 ) have the largest percentage of Q2 units (72% and 67%, respectively) and the smallest Qn distributions. The only other groupings in these glasses are Q1 and Q3 . Wollastonite, having a lower nucleation rate than Na-containing glasses, has a smaller Q2 content (64%), but some amount of Q4 is detected in this glass, widening its Qn distribution. Diopside, displaying undetectable homogeneous nucleation, has an even larger Qn distribution. Only 43% of the network-forming cations are organized in Q2 units and, consequently, a larger fraction of Q1 , Q3 and Q4 species are present in this glass than in the other compositions. Finally, we stress that while the correlation of the Qn distribution and nucleation tendency in the metasilicate glasses studied here is interesting, the possibility of a fortuitous coincidence should not be dismissed. Literature data for other systems, for instance, disilicates Li2 O á 2SiO2 (LS2), Na2 O á 2SiO2 (NS2), K2 O á 2SiO2 (KS2), show an opposite trend. In the case of these disilicates, for which the crystal phases are 100% Q3 , the crystal nucleation rates decrease from LS2 to KS2 while the amount of Q3 increase in that order: 63±71% Q3 in LS2, 79% Q3 in NS2 and 86% Q3 in KS2 [25]. These ®ndings deserve further attention. We hope that the present study encourages similar analyses of a broader set of metasilicate glasses, in order to check whether there is or not a general trend for metasilicates. 6. Conclusions The dierences in the chemical shifts of the predominant Q2 species in glass and crystal indicate short range dierences between the silicon environments, even in those systems displaying the greatest nucleating ability. On the other hand, the 18 J. Schneider et al. / Journal of Non-Crystalline Solids 273 (2000) 8±18 shape of the Qn distribution, indicating the degree of similarity between silicate connectivity in glass and isochemical crystal, shows a correlation with the internal nucleation tendency of the four metasilicate glasses studied. We should stress, however, that while the correlation of the Qn distribution and nucleation tendency in the metasilicate glasses studied here is quite interesting, the possibility of a fortuitous coincidence cannot be dismissed. Literature data for other families of glasses, for instance, disilicates, do not show the same trend. Thus, to generalize the present ®ndings for metasilicates, and to seek plausible explanations for the phenomenon, additional eort should be directed to verify the existence of the correlation in other metasilicate systems. Acknowledgements ~o de Amparo a J.S. thanks FAPESP (Fundacßa Pesquisa do Estado de S~ ao Paulo, Brazil) for a post-doctoral fellowship. The critical comments of Boris A. Shakmatkin and Natalia M. Vedishcheva from the Institute of Silicate Chemistry, St. Petersburg, are fully appreciated. Funding by CNPq, PRONEX and FAPESP (grant no. 99/0871-2) is deeply appreciated. References [1] E.D. Zanotto, J. Non-Cryst. Solids 89 (1987) 361. [2] B.H.W.S. de Jong, W.S. Keefer, G.E. Brown, Ch.M. Taylor, Geochim. Cosmochim. Acta 45 (1981) 1291. [3] C.M. Schramm, B.H.W.S. de Jong, V.E. Parziale, J. Am. Chem. Soc. 106 (1984) 4396. [4] J.E. Dickinson, in: Proceedings of the XV International Congress on Glass, Leningrad, vol. 1a, 1989, p. 192. [5] E.D. Zanotto, E. Muller, J. Non-Cryst. Solids 130 (1991) 220. [6] E. Muller, K. Heide, E.D. Zanotto, J. Non-Cryst. Solids 155 (1993) 56. [7] V.R. Mastelaro, E.D. Zanotto, N. Lequeux, R. Cortes, J. Non-Cryst. Solids 262 (2000) 191. [8] Powder Diraction File No. 22-1455, JCPDS-ICDD 1983. [9] Powder Diraction File No. 12-670, JCPDS-ICDD 1983. [10] Powder Diraction File No. 11-654, JCPDS-ICDD 1983. [11] Powder Diraction File No. 27-88, JCPDS-ICDD 1983. [12] P. Zhang, C. Dunlap, P. Florian, P.J. Grandinetti, I. Farnan, J.F. Stebbins, J. Non-Cryst. Solids 204 (1996) 294. [13] J. Mahler, A. Sebald, Solid State Nucl. Magn. Res. 5 (1995) 63. [14] P. Zhang, P. Grandinetti, J.F. Stebbins, J. Phys. Chem. B 101 (1997) 4004. [15] G. Engelhardt, D. Michel, High Resolution Solid-State NMR of Silicates and Zeolites, Wiley, Norwich, 1987. [16] Y. Ohashi, L. Finger, Carnegie Institution of Washington: Yearbook (CIWYA 75), 1976, p. 746. [17] K.F. Hesse, Zeit. Krist. 168 (1984) 93. [18] K. Mamedov, N. Belov, Dokl. Akad. Nauk SSSR 107 (1956) 463. [19] K.A. Smith, R.J. Kirkpatrick, E. Olde®eld, D.M. Henderson, Am. Mineral. 68 (1983) 1206. [20] M. M agi, E. Lipmaa, A. Samoson, G. Engelhardt, A. Grimmer, J. Phys. Chem. 88 (1984) 1518. [21] B. Warren, W.L. Bragg, Z. Kristallogr. Kristall. Kristallphys. Kristallchem. 69 (1928) 168. [22] J.A. Peck, I. Farnan, J.F. Stebbins, Geochim. Cosmochim. Acta 52 (1988) 3017. [23] J.B. Murdoch, J.F. Stebbins, I.S.E. Carmichael, Am. Mineralogist 70 (1985) 332. [24] H. Ohsato, Y. Takeuchi, I. Maki, Acta Crystallogr. C 42 (1986) 934. [25] H. Maekawa, T. Maekawa, K. Kawamura, T. Yokokawa, J. Non-Cryst. Solids 127 (1991) 53.
Baixar