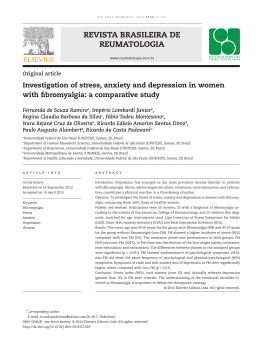
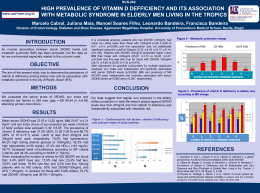
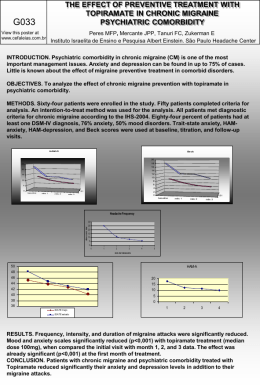
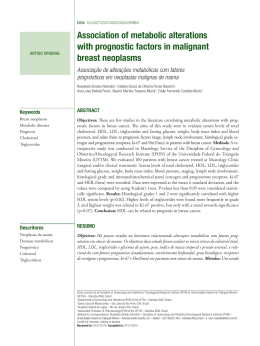
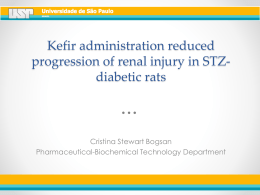
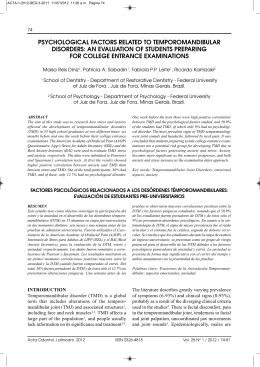
Metabolic Effects of Dark Chocolate Consumption on Energy, Gut Microbiota, and Stress-Related Metabolism in Free-Living Subjects Francois-Pierre J. Martin,†,¶ Serge Rezzi,†,¶ Emma Peré-Trepat,† Beate Kamlage,‡ Sebastiano Collino,† Edgar Leibold,§ Jürgen Kastler,‡ Dietrich Rein,# Laurent B. Fay,† and Sunil Kochhar*,† Nestlé Research Center, Vers-chez-les-Blanc, CH-1000 Lausanne 26, Switzerland, Metanomics GmbH, Tegeler Weg 33, 10589 Berlin, Germany, BASF SE, 67056 Ludwigshafen, Germany, and Metanomics Health GmbH, Tegeler Weg 33, 10589 Berlin, Germany Received July 27, 2009 Dietary preferences influence basal human metabolism and gut microbiome activity that in turn may have long-term health consequences. The present study reports the metabolic responses of free living subjects to a daily consumption of 40 g of dark chocolate for up to 14 days. A clinical trial was performed on a population of 30 human subjects, who were classified in low and high anxiety traits using validated psychological questionnaires. Biological fluids (urine and blood plasma) were collected during 3 test days at the beginning, midtime and at the end of a 2 week study. NMR and MS-based metabonomics were employed to study global changes in metabolism due to the chocolate consumption. Human subjects with higher anxiety trait showed a distinct metabolic profile indicative of a different energy homeostasis (lactate, citrate, succinate, trans-aconitate, urea, proline), hormonal metabolism (adrenaline, DOPA, 3-methoxy-tyrosine) and gut microbial activity (methylamines, p-cresol sulfate, hippurate). Dark chocolate reduced the urinary excretion of the stress hormone cortisol and catecholamines and partially normalized stress-related differences in energy metabolism (glycine, citrate, trans-aconitate, proline, β-alanine) and gut microbial activities (hippurate and p-cresol sulfate). The study provides strong evidence that a daily consumption of 40 g of dark chocolate during a period of 2 weeks is sufficient to modify the metabolism of free living and healthy human subjects, as per variation of both host and gut microbial metabolism. Keywords: Chronic stress • Dark chocolate • Metabonomics • Chemometrics • Mass spectrometry • Nuclear magnetic resonance spectroscopy Introduction Metabolic phenotype of mammals results from the combination of multiple genetic, environmental and sociocultural determinants.1,2 In man, dietary preferences, lifestyle and genetics influence individual metabolic phenotype, and therefore determine health status and the likelihood to develop diseases.3 Variations in the dietary pattern affect the metabolism of humans via the key entry points of gut microbiota.4 Therefore, there is clearly a need to understand human metabolism at the system level with emphasis on the expression of both host and meta-genomes, environmental and lifestyle factors to meet the ultimate goal of providing better health and wellbeing with nutrition. Although predominantly cultural in origin, dietary preferences also result from multiple biological * To whom correspondence should be addressed. Sunil Kochhar, Nestlé Research Center, BioAnalytical Sciences, P.O. Box 44, Vers-chez-les-Blanc, CH-1000 Lausanne 26, Switzerland. E-mail, [email protected]; telephone, +41 785 9336; fax, +41 (21) 785 9486. † Nestlé Research Center. ¶ Contributed equally to the manuscript. ‡ Metanomics GmbH. § BASF SE. # Metanomics Health GmbH. 10.1021/pr900607v CCC: $40.75 XXXX American Chemical Society and behavioral processes, which integrate satiety, psychological perception and metabolic effects of foods.5 We have recently described how dietary preferences can be associated with specific signatures in the metabolic phenotypes of healthy humans, with a metabolic signature based on a modulation of host and gut microbial metabolism.3 Perhaps one of the greatest challenges in modern nutrition is to interrogate and classify the critical metabolic interactions between the complex food matricesscontaining a wide range of biologically active compoundssand human system metabolism and to understand their role in diverse human disease processes. The sheer complexity of a food matrix, such as dark chocolate, may determine a large variety of effects on the metabolism. Many studies have indeed demonstrated the potential health implications of dark chocolate constituents, but rarely as a whole product. For instance, cocoa is rich in flavonoids, mainly flavan-3-ols (epicatechin, catechin and their oligomers), which were associated with benefits on cardiovascular health by maintaining low blood pressure, improving endothelial function, and by reducing thrombotic state, oxidative and inflammatory states.6,7 Benefits of cocoa on improvement of insulin sensitivity and glucose tolerance were also Journal of Proteome Research XXXX, xxx, 000 A research articles 8,9 reported. Other biochemically active molecules naturally occurring in chocolate include theobromine, a bitter alkaloid also known to reduce blood pressure, phenylethylamine, a monoamine alkaloid which can act as neurotransmitter, and N-oleoyl- and N-linoleoyl-ethanolamine that slow the rate of anandamide breakdown, a brain neurotransmitter.10,11 Therefore, if there is growing evidence on the health benefits associated with chocolate, mechanisms of action of chocolate bioactive components at the molecular levels are poorly understood. This is particularly the case for benefits related to brain health and improvement of stress states where only symptomatic data, such as brain blood flow, are available.12 In the present study, we have sought to capture a global view of the metabolic changes associated with chocolate consumption in healthy and free living men and women using metabonomics. Nutrimetabonomics provides a system approach to assess systemic metabolic status of an individual, which encapsulates information on genetic and environmental factors,1,13 gut microbiota activity,14,15 lifestyle16 and food habits.3 Here, we have used proton nuclear magnetic resonance (1H NMR) spectroscopy and mass spectrometry (MS) as complementary analytical platforms for monitoring metabolic changes associated with a daily intake of 40 g of dark chocolate over a period of 2 weeks in the urine and blood plasma of 30 individuals classified according to their self-reported anxiety trait. We describe the metabolic variations induced by dark chocolate and discuss their association with changes in energy homeostasis, gut microbial activity and the metabolism associated with stress. Material and Methods Recruitment of Volunteers. This study was conducted by TNO Quality of Life, Zeist (The Netherlands) in accordance with the ethical principles of Good Clinical Practice and the Declaration of Helsinki. The protocol was approved by the Medical Ethics Committee METOPP (Medisch-Ethische Toetsing Onderzoek Patiënten en Proefpersonen/medical ethics review of research with patients and test subjects) on April 3, 2006 (The Netherlands). A total of 30 subjects (11 males, 19 females) were enrolled in the study and gave written informed consent (Table 1). The study was designed as a randomized (by age, gender, anxiety trait), parallel, open study. The inclusion of the volunteers was decided upon medical history, age (18-35 years), body mass index (BMI, 18-25 kg · m-2), and blood clinical analyses (Table 1). The exclusion criteria included psychiatric, metabolic, endocrine, gastrointestinal and eating behavior disorders. In addition, smoking, use of medication that may influence appetite and/or sensory functioning, pregnancy, reported slimming or medically prescribed diet, reported unexplained weight loss or gain in the month prior to the screening, alcohol consumption superior to, respectively, 21 and 28 units per week for females and males were also considered as exclusion criteria. Clinical Trial. Participants were asked to avoid consumption of chocolate or chocolate containing products during an 8-day run-in period. The nutritional intervention lasted 2 weeks with a daily intake of 40 g of commercially available dark chocolate (Noir Intense, 74% cocoa solids, Nestlé). On day 1 (preintervention) and days 8 and 15 (postintervention), fasting blood plasma and morning spot urine samples were collected. A daily amount of 40 g of dark chocolate was consumed twice per day as a midmorning and a midafternoon snack (20 g each). Participants were divided up into either high or low anxiety B Journal of Proteome Research • Vol. xxx, No. xx, XXXX Martin et al. Table 1. Participant Information Subject ID age [years] BMI [kg/m2] high (H)/low (L) anxiety trait anxiety score gender 2 5 6 7 9 15 17 20 21 25 31 36 41 44 45 49 53 56 59 61 65 72 74 76 77 78 80 87 94 95 28 18 24 18 23 26 21 18 24 21 19 31 22 23 23 23 21 20 26 18 22 28 23 34 22 22 26 20 21 26 21.4 21.2 25.4 21.1 23.3 24.1 19.7 21.0 20.9 21.8 18.8 22.0 21.6 22.7 21.8 20.0 20.8 23.0 21.4 20.9 21.4 24.6 20.2 20.0 23.6 24.2 21.3 18.6 24.4 20.6 L H H L L H L L L L H H H L H H L L L H L L H H L L H H L L 72 50 61 76 72 50 74 78 71 72 55 53 56 71 56 63 72 73 76 56 72 73 56 56 73 76 61 59 70 70 F F M M M F F F M M F F M M F F F F M M F F F F F F M F F M trait subgroup according to the evaluation of their dispositional stress as assessed by scoring on the anxiety trait scale of the State-Trait Anxiety Inventory (STAI) test.17 The STAI is the definitive instrument for measuring anxiety in adults that clearly differentiates between the temporary condition of “anxiety state” and the more general and long-standing status of anxiety trait. The STAI scores from 70 to 78 and from 42 to 64 described low and high anxiety trait, respectively (Table 1). The study included 4 high and 7 low anxiety trait males, and 9 high and 10 low anxiety trait females (Table 1). Metabolic data from subjects having reported adverse events, such as nausea, vomiting, or diarrhea (subjects ID 6, 15, 17, and 44) were excluded from the statistical analysis to avoid introduction of biases in the final outcome of the study. 1 H NMR Analysis of Plasma and Urine Samples. Plasma samples (495 µL) were introduced into 5 mm NMR tubes with 55 µL of deuterium oxide (D2O) used as locking substance. Urine samples (500 µL) were adjusted to pH 6.8 using 100 µL of a deuterated phosphate buffer solution (KH2PO4, final concentration of 0.2 M) containing 1 mM of sodium 3-(trimethylsilyl)-[2,2,3,3-2H4]-1-propionate (TSP) into a 5 mm NMR tube. Metabolic profiles were measured at 300 K on a Bruker Avance II 600 MHz spectrometer equipped with a 5 mm inverse probe (Bruker Biospin, Rheinstetten, Germany). Three types of 1H NMR spectra were registered for each blood plasma sample, including a standard 1H detection with water suppression, a Carr-Purcell-Meiboom-Gill spin-echo with water suppression and a diffusion-edited pulse sequences, as reported previously.3 The standard spectra were acquired with a relaxation delay of 4 s and a mixing time of 100 ms. CPMG research articles Metabolic Effects of Dark Chocolate Consumption spin-echo spectra were measured using a spin-echo loop time of 19.2 ms and a relaxation delay of 4 s. Diffusion-editing spectra were obtained using a relaxation delay of 1 s, pulsed field gradients set at 46.8 G · cm-1, and a diffusion delay of 120 ms during which the molecules are allowed to diffuse. Urine spectra were acquired using the standard sequence, with a relaxation delay of 2.5 s and a mixing time of 100 ms. For each sample, 32 (plasma) and 256 (urine) free induction decays (FIDs) were collected into 64 K data points using a spectral width of 12019.2 Hz, corresponding to an acquisition time of 2.7 s. Prior to Fourier transformation, FIDs were multiplied by an exponential weighting function corresponding to a line broadening of 0.3 Hz (standard and CPMG spectra) and of 1 Hz (diffusion-edited spectra). The acquired NMR spectra were manually corrected for phase and baseline distortions, and referenced to the chemical shift of R-glucose at δ 5.236 for plasma and of TSP at δ 0.0 for urine using the TOPSPIN (version 2.1, Bruker Biospin, Rheinstetten, Germany) software package. The metabolite identification was achieved using literature data,18 and confirmed by 2D 1H NMR spectroscopy experiments performed on selected samples. Mass Spectrometric Analysis of Plasma and Urine Samples. For mass spectrometry-based metabolite profiling analyses, proteins were removed from plasma and urine samples by precipitation. Subsequently, two nonpolar and two polar fractions were separated for GC-MS and LC-MS/MS analysis, respectively, by adding water and a mixture of ethanol and dichloromethane. For GC-MS analysis, the nonpolar fraction was treated with methanol under acidic conditions to yield the fatty acid methyl esters. Both fractions were further derivatized with O-methyl-hydroxyamine hydrochloride and pyridine to convert oxo-groups to O-methyl-oximes and subsequently with a silylating agent before analysis.19 In LC-MS analysis, both fractions were reconstituted in appropriate solvent mixtures. HPLC was performed by gradient elution using methanol/water/formic acid on reversed phase separation columns. Mass spectrometric detection technology which allows target and high sensitivity MRM (Multiple Reaction Monitoring) profiling was performed in parallel to a full screen analysis. In the case of urine analysis, a photometric creatinine analysis according to Jaffé was performed prior to polar MS analysis and samples diluted to the same creatinine concentration.20 The polar fraction was applied to each of the systems. For GC-MS and LC-MS/MS profiling, data were normalized to the median of reference samples which were derived from a pool of all pretreatment samples (Day 1) to account for interand intrainstrumental variation. Steroids, catecholamines and their metabolites were measured by online SPE-LC-MS/MS (Solid phase extraction-LC-MS/MS).21 In the case of urine samples, conjugated derivatives of steroids were enzymatically cleaved prior to analyses using a beta-glucuronidase [EC 3.2.1.31] and an arylsulfatase [EC 3.1.6.1] from Helix pomatia. For plasma measurements, absolute quantification was performed by means of stable isotope-labeled standards. The analyses of cortisol in plasma as well as catecholamines and steroids in urine were performed by normalization to pool levels as described for profiling. Chemometrics. NMR data was converted into 22 K data points over the range of δ 0.2-10.0 and imported into MATLAB environment (The MathWorks, Inc., Natick, MA). Interpolation of all the spectra to the same chemical shift followed by zeroing the intensity values of the water peak from δ 4.68 to 5.10 was performed. The NMR spectra were normalized to a constant total sum of all intensities within the specified range and autoscaled prior to multivariate data analyses (MVA). MS data were normalized to the median of pooled samples and autoscaled before MVA. Principal components analysis (PCA)22 was first performed to visualize the global variance of the data sets and to pinpoint outliers. PCA is an important tool for visualizing data structures and one of the most applied dimensionality reduction methods. The aim of PCA is to represent the original data (X) by a set of new orthogonal variables so-called principal components (PCs) which are linear combinations of the original variables. Because the extracted PCs maximize the data variance, PCA is sensitive to the presence of outliers. The data matrix X is decomposed to a score matrix U and a loading matrix V, plus an error matrix E. The elements of the loadings give information about the contribution of the original variables (NMR or MS) to each PC and the elements of the scores provide information about metabolic similarities and dissimilarities between samples. Partial Least Squares (PLS) and Orthogonal PLS (O-PLS) discriminant analyses (PLS-DA and O-PLS-DA) were also applied for detailed classification purposes.23 In PLS-DA, a dependent variable y is modeled using latent variables, maximizing the covariance between X (NMR or GC/LC-MS data) and y. Variable y is a binary vector with value 0 for one class and value 1 for the other class under study; in this paper, y is related to time- and anxiety trait-dependent metabolic variations after dark chocolate supplementation. In particular, O-PLS-DA, which is a modification of PLS, separates the systematic variation in X into two parts, one linearly related to y and representing the between class variation, and another one orthogonal to y and representing the within class variation. In other words, it provides a way to filter out metabolic information (NMR or GC/LC-MS data) that is not correlated to the predefined classes (time, anxiety trait). The robustness of statistical models was assessed using the standard 7-fold cross validation method. Validity of the model against overfitting was determined by computing the total explained variance of X and y (R2(X), R2(Y)) and the crossvalidated predictive ability (Q2(Y)) values of the models as reported in Tables 2 and 3. Negative or very low values of the Q2(Y) indicate that no statistically significant differences were observed. Influential variables that are correlated to the group separation are identified using the variable coefficients according to a previously published method.24 S-plot was used to visualize the variable influence in the MS data models.25 In addition, a Student’s t test with an alpha of 0.05 was performed on GC/LC-MS variables and one representative NMR signal areas representative of influential metabolites. Chemometric analysis was performed using the SIMCA-P+ (version 12.0, Umetrics AB, Umeå, Sweden) software package and in-house developed MATLAB routines. Results NMR and MS Metabolic Profiling of Blood Plasma and Urine. A wide range of amino and organic acids, ketone bodies, sugars, osmolytes, saturated and unsaturated fatty acids and triglycerides were detected using 1H NMR spectroscopy and GC/LC-MS analysis of blood plasma. Holistic NMR plasma profiles dominated by low molecular weight components (CPMG spectra) and macromolecules (diffusion-edited spectra) were complemented by GC/LC-MS semiquantitative measures of 148 targeted metabolites. Similarly, the 1H NMR urine Journal of Proteome Research • Vol. xxx, No. xx, XXXX C research articles Martin et al. Table 2. O-PLS-DA Model Summary for Discriminating Urine and Plasma Metabolic Profiles Based on the Dark Chocolate Consumption along the Studya models model descriptors day 0 vs 8 day 8 vs 15 day 0 vs 15 Q2(Y) R2(X) R2(Y) Q2(Y) R2(X) R2(Y) Q2(Y) R2(X) R2(Y) Q2(Y) R2(X) R2(Y) Q2(Y) R2(X) R2(Y) Q2(Y) R2(X) R2(Y) Q2(Y) R2(X) R2(Y) Q2(Y) R2(X) R2(Y) Q2(Y) R2(X) R2(Y) NS NS NS NS NS NS 0.32 0.20 0.95 0.26 0.26 0.96 0.22 0.16 0.92 NS 0.16 0.17 0.70 0.16 0.38 0.74 0.07 0.19 0.88 NS 0.38 0.14 0.87 0.26 0.20 0.90 0.28 0.15 0.91 NS NS NS NS NS NS NS NS 0.17 0.24 0.88 NS NMR Diffusion-edited plasma data NMR CPMG plasma data NMR Urine data NMR Urine data (high stress subjects) NMR Urine data (low stress subjects) MS Plasma data MS Urine data MS Urine data (high stress subjects) MS Urine data (low stress subjects) a Key: NS, the class separation obtained through the predictive component was not statistically significant. Table 3. O-PLS-DA Model Summary for Discriminating Urine and Plasma Metabolic Profiles Based on High and Low Anxiety Traitsa models NMR Diffusionedited plasma spectra NMR CPMG plasma spectra NMR Urine spectra MS Plasma data MS Urine data model descriptors Q2(Y) R2(X) R2(Y) Q2(Y) R2(X) R2(Y) Q2(Y) R2(X) R2(Y) Q2(Y) R2(X) R2(Y) Q2(Y) R2(X) R2(Y) high/low anxiety trait at day 0 high/low anxiety trait at day 8 high/low anxiety trait at day 15 NS NS NS 0.28 0.29 0.85 0.18 0.20 0.88 0.12 0.15 0.90 0.58 0.25 0.91 NS 0.23 0.20 0.89 NS NS NS 0.16 0.20 0.93 0.22 0.14 0.95 NS a Key: NS, the class separation obtained through the predictive component was not statistically significant. profiles exhibited a set of resonances arising from major low molecular weight molecules, such as ketone bodies, organic acids, amino acids, and aromatic metabolites were completed with 157 targeted metabolites measured with LC-MS. Overview of Metabolic Variations by PCA. PCA was first applied to assess the inherent similarity of the urine and plasma metabolic profiles using 4 PCs. For urine, PC1-4 explained, respectively, 12, 7, 6, and 5% of the total variance present in D Journal of Proteome Research • Vol. xxx, No. xx, XXXX the NMR data and 17, 8, 7, and 6% in the MS data (Supplementary Figure 1A,B). The urine samples from the subject 21 were removed from the statistical analysis due to a statistically dominant dilution effects in the NMR profile. For plasma, PC1-4 explained 23.9, 8.7, 5.3, and 4.5% of the total variance, respectively, in the NMR data and 13.8, 9.0, 6.5, and 5.6% in the MS data (Supplementary Figure 1C,D). PCA highlighted that interindividual variability of the metabolic profiles of urine and plasma tended to be greater than intraindividual variations (Supplementary Figure 1). Analysis of NMR-derived models revealed that interindividual differences were associated with variations in the urinary levels of creatinine, trimethylamineN-oxide (TMAO), hippurate, citrate, and lactate, and plasma composition in lipoproteins, lipids, phosphocholine and glucose. Investigations of the MS-derived models indicated that the main source of metabolic variations between subjects was due to changes in the urinary excretion of xylose, lactate, glycerate, lysine and 4-dihydroxyhippurate, and plasma concentrations of serotonine, corticosterone, 3,4-hydroxyphenylacetate, and homovanillate. Interpretation of the PCA scores plot did not reveal any distribution of the samples according to age, time, BMI and self-reported anxiety. However, a separation trend due to gender differences could be observed and was particularly marked in MS urinary data along the second PC. Additional investigations were performed using O-PLS-DA to maximize the separation between the groups of samples (high and low anxiety trait or time of sample collection) and identify class-specific metabolites (Tables 2 and 3). Daily Consumption of Dark Chocolate Induces a Specific Metabolic Signature. Supervised chemometric analyses of the urine NMR and MS data revealed statistically significant time-dependent changes, as noted by the positive value of the model predictability parameter Q2(Y). Interpretation of the urine O-PLS-DA scores plots (Figures 1 and 2) and model descriptors (Table 2) indicated that a 1 week daily intake of dark chocolate by free living subjects is reflected in the metabolic profiles as assessed by NMR spectroscopy. The metabolic changes became even more significant after 2 weeks of consumption, as observed by the greater value of Q2(Y) value and a clearer separation of the two groups of samples in the scores plot (Table 2, Figures 1 and 2). Interpretation of the corresponding O-PLS-DA coefficients plots indicated that, after 1 week, chocolate consumption resulted in increased levels of 4-hydroxyphenylacetate and several unassigned metabolites giving resonances at δ 7.85 (s), 8.03 (s), 8.22 (s), 3.0 (s), 3.39 (s), 3.91 (m) and 3.53(s) (Table 4, Figure 1). These metabolic changes were associated with downward trends in creatinine, and an unassigned aromatic metabolite giving resonances at δ 7.51 (m) and 7.70 (m). Comparison of samples obtained at baseline and after 2 weeks of treatment revealed greater metabolic changes in both endogenous and gut microbial metabolism. In particular, after 2 weeks of chocolate consumption, these metabolic changes were maintained and were associated with additional decreased levels of phenylacetylglutamine and pcresol sulfate (Table 4). Intriguingly, MS-based metabolic profiling showed that chocolate-induced metabolic effects were statistically significant only in subjects with inherent high anxiety trait (Tables 2 and 4). Interpretation of the loadings plot showed that chocolate consumption was associated with decreased levels of normetanephrine, adrenaline, corticosterone, noradrenaline, progesterone, leucine, cortisol and asparagine, and an increase Metabolic Effects of Dark Chocolate Consumption research articles Figure 1. 1H NMR time-dependent metabolic effects of regular dark chocolate consumption O-PLS-DA scores (A) and coefficients plots (B) for the models discriminating urine samples collected at baseline (day 0) and 1 week (day 8) of treatment derived from O-PLS-DA of 1H NMR spectra. of glucose-6-phosphate, cystine and threonic acid (Figure 2). Additional analyses of the urinary NMR data indicated that the effects of dark chocolate consumption on urinary excretion of aromatic compounds were similar in both high and low anxiety trait subjects (Tables 2 and 4). Additional chemometric analyses of blood plasma metabolic profiles did not reveal statistically significant effects of dark chocolate over the time as assessed by NMR or MS (Table 2). Anxiety Trait is Associated with a Specific Human Metabolic Signature. Chemometric analysis of urinary NMR and MS profiles revealed significant compositional changes associated with self-reported anxiety trait (Table 3, Figures 3 and 4). For NMR data, analysis of the coefficients plots indicated that subjects with a higher anxiety trait were characterized with higher urinary excretion of hippurate, glycine, citrate, and lower levels of methyl-succinate, trans-aconitate, and a series of unassigned signals, most likely arising from a polyol, and a signal at δ 1.24 (Table 5, Figure 3). These metabolic changes were also associated with trends toward higher urine levels of succinate, lactate and urea, and trends toward lower urinary excretion of trimethylamine (TMA), and p-cresol sulfate (Table 5). For MS data, high anxiety trait subjects showed higher urinary concentrations of glycine, 3-methoxytyrosine, β-alanine, proline, 3,4-dihydroxyphenylalanine (DOPA), adrenaline, an upward trend of lactate, and lower levels of p-cresol sulfate, aconitate, and a downward trend of arabitol when compared to low anxiety trait individuals (Table 5, Figure 4). Structure annotation of p-cresol sulfate metabolite is based on strong analytical evidence (combinations of chromatography, MS, chemical reactions, deuterium-labeling, database and literature search, comparison to similar/homologue/isomeric reference compounds). Analysis of the blood plasma NMR and MS profiles reveal subtle but significant anxiety trait related metabolic differences at the baseline and after 2 weeks of dietary intervention (Table Journal of Proteome Research • Vol. xxx, No. xx, XXXX E research articles Martin et al. Figure 2. MS time-dependent metabolic effects of regular dark chocolate consumption O-PLS-DA scores (A) and coefficients (B) plots for the models discriminating urine samples collected at baseline (day 0) and 2 weeks (day 15) of treatment derived from O-PLS-DA of MS data. 3). Interpretation of the NMR coefficients plots indicated that high anxiety subjects tended to have a relative higher level of choline, and lower concentrations of glycine and glutamine compared to low anxiety individuals (Table 5). In addition, after 2 weeks of treatment, high anxiety trait individuals showed increased concentrations of glutamate and choline, and decreased levels of acetate in plasma (Table 5). Analysis of the S-plots derived from MS data analysis showed increased levels of lycopene and β-carotene in high anxiety trait subjects at baseline, and the higher plasma concentration of β-carotene was still observed after 2 weeks of treatment with dark chocolate (Table 5). Moreover, at 2 weeks post-treatment, F Journal of Proteome Research • Vol. xxx, No. xx, XXXX subjects with a high self-reported anxiety trait also showed increased levels of normetanephrine (Table 5). Effects of Dark Chocolate Consumption on Anxiety Trait Related Metabolism. The anxiety trait-related metabolic differences observed in urine were significantly reduced following 1 and 2 weeks intervention with dark chocolate, as noted with the low/negative value of the Q2(Y) parameter and the loss of statistically significant differences between the groups (Tables 3 and 5). The NMR and MS signals corresponding to the influential metabolites identified by chemometrics were analyzed using a Student t test (Table 5) and displayed using boxand-whiskers plots in order to explore their changes overtime research articles Metabolic Effects of Dark Chocolate Consumption Table 4. Summary of Time-Dependent Metabolite Effects of Dark Chocolate Consumption in Urinea metabolites/p-values measured by day 0 vs 8 day 8 vs 15 day 0 vs 15 4-Hydroxyphenylacetate Adrenaline Asparagine Corticosterone Cortisol Cystine Glucose-6-phosphate Normetanephrine Phenylacetylglutamine p-Cresol sulfate Threonic acid NMR MS MS MS MS MS MS MS NMR NMR MS 0.0000 - 0.0455 0.0212 0.0262 - 0.0033 0.0360 0.0477 0.0144 0.0157 0.0440 0.0488 0.0040 0.0354 0.0470 0.0809 a Key: - designates difference not significant at 95% confidence level. (Figure 5). The changes of hippurate, p-cresol sulfate, glycine, citrate, trans-aconitate, proline, DOPA, and β-alanine showed similar trends from high anxiety trait individuals toward low anxiety trait subjects and further support a normalization of the metabolic profiles (Table 5). Interestingly, anxiety traitrelated metabolic signatures in blood plasma were maintained over the duration of the clinical trial, except for lycopene for which the difference was not significant following the dietary intervention. In addition, t tests were performed on the contrasts for the second ((t1 - t0)high vs (t1 - t0)low) and third time points ((t1 - t0)high vs (t1 - t0)low) to assess the metabolic relationships between anxiety trait and dark chocolate consumption (Supplementary Table 1). The results validated significant relationships between anxiety trait level, chocolate consumption and the urinary excretion of 3-methoxytyrosine, adrenaline, glycine and trans-aconitate, as well as plasma levels of acetate (Supplementary Table 1). Discussion In the present study, NMR- and MS-based metabolic profiling are shown as complementary techniques to provide a comprehensive modeling of the biological response of a free living population to a daily consumption of dark chocolate. The overview of urine and plasma metabolite profiles revealed that interindividual differences were greater than intraindividual variations, which illustrates the strong influence of lifestyle and genetics on individual metabolic phenotypes. Such metabolic variations make the study of the metabolic effects of dark chocolate in free-living subjects difficult when using nonsupervised chemometric methods. Here, metabonomics is applied to pinpoint modulation of the host and gut microbial metabolism in response to daily consumption of dark chocolate with emphasis on stress-associated metabolic changes. Self-Reported Anxiety Trait is Associated with Specific Urine and Plasma Metabolic Signatures. In the current experiment, individuals were classified according to their dispositional stress as assessed by scoring on the well-validated anxiety trait scale of the State-Trait Anxiety Inventory (STAI) test.17 The chemometric modeling of metabolite variations in relation to anxiety trait levels revealed different physiological processes in the absence of a specific nutritional intervention. Others have provided evidence that chronic and acute stress may contribute to the disruption of metabolic homeostasis, and subsequently to individual susceptibility to diseases.26 In particular, the individual response to chronic stress is tightly connected to the hypothalamic-pituitary-adrenal metabolic axis 27 and the sympathoadrenal system. Our observations described systemic changes in hormonal metabolism of high anxiety trait individuals when compared to low anxiety trait subjects, as observed by MS with a higher urinary excretion of adrenaline, DOPA and 3-methoxytyrosine, two intermediates in dopamine synthesis.28 The first step in the catecholamine metabolism is the hydroxylation of the amino acid tyrosine to DOPA, by the rate-limiting enzyme in catecholamine biosynthesis tyrosine hydroxylase. DOPA is then decarboxylated to dopamine which is the direct precursor to noradrenaline and adrenaline. It is well-described that physical and mental stress simulates the release of adrenaline via the sympathetic nervous system and synthesis of the adrenocorticotropic hormone that enhances the activity of specific enzymes, including tyrosine hydroxylase.29 Therefore, the concomitant increased urinary levels of DOPA, 3-methoxy-tyrosine and adrenaline highlight a greater synthesis of catecholamines in subjects stratified with high anxiety trait, with inferred effects on energy metabolism.27 The results obtained by NMR and MS also demonstrated a functional relationship between anxiety trait levels and several pathways involving the tricarboxylic acid cycle (citrate, succinate, aconitate), gluconeogenetic pathways (lactate), urea cycle (urea, proline), and protection against oxidative stress (plasma concentrations of lycopene and β-carotene). In particular, the anticorrelated variation of citrate and trans-acotinate suggested additional variations in renal tubular pH and aconitase activity.30 Therefore, the observed metabolic changes were consistent with the stress-mediated modulation of gluconeogenesis by catecholamines.27 Moreover, NMR-based metabolic profiling of urine showed that high anxiety trait individuals tended to have lower urinary concentrations of polyols, including arabitol an intermediate in the pentose and glucuronate metabolism, which may also reflect a modulation of energy metabolism as a function of dispositional stress. Nowadays, there is strong evidence that life stress impacts directly on gastrointestinal function in animals and humans via modulation of key physiological parameters, such as intestinal permeability and secretion and release of biological mediators.31,32 Changes of gastrointestinal functional ecology are intimately linked to gut microbial populations and activities,33 and abnormal microbiota composition is often observed in the development of irritable bowel syndromes.34 Urine of mammals contains many polar cometabolites resulting from gut microbial-mammalian metabolic interactions.1,35 Therefore, metabolic monitoring of urinary excretion of many aromatic compounds (e.g., phenolics, indoles and benzoyl derivatives), methylamines, short chain fatty acids and their hydroxylation products provides indirect information on the gut microbial metabolic activities.36,37 For instance, multivariate statistical modeling of urine and blood plasma indicated a modulation of choline metabolism, that is, high circulating levels of plasma choline and low urinary excretion of trimethylamine, coprocessed by the gut microbiota from dietary compounds containing choline.37 Moreover, differences in anxiety trait levels were associated with differential urinary excretion of p-cresol sulfate and hippurate. These changes reflected different gut microbial metabolism of aromatic amino acids.14,36 Certain aromatic compounds, such as benzoate and phenylacetate, that can be coprocessed by the gut microbiota are well-characterized glycine and glutamine level reducing agents.38,39 Both NMRand MS-based metabolite profiling of urine revealed relatively higher excretion of glycine in high anxiety trait individuals, with inferred relationships with amino acid interconversion, and Journal of Proteome Research • Vol. xxx, No. xx, XXXX G research articles Martin et al. Figure 3. Stress and anxiety trait metabolic signatures in 1H NMR spectra O-PLS-DA scores (A) and coefficients (B) plots for the models discriminating urine samples collected at baseline (day 0) according to self-reported anxiety trait derived from O-PLS-DA of 1H NMR spectra of urine. benzoate metabolism. Additional blood plasma metabolic variations at baseline and at the end of the study, that is, reduction of circulating levels of plasma glycine and glutamine/ glutamate, may be functionally related to changes of benzoate and phenylacetate metabolism in response to bacterial processing of dark chocolate. The Biological Response of Free Living Subjects to a Daily Consumption of Dark Chocolate was Dependent on Self-Reported Anxiety Trait. The metabolic response to chocolate intervention in the whole cohort revealed that a daily intake of dark chocolate resulted in subtle and cumulative metabolic effects on the urinary excretion of gut microbial cometabolites over a 2 weeks period. Increased levels of 4-hydroxyphenylacetate and decreased content of phenylacetylglutamine and p-cresol sulfate reflected the adaptation of gut microbiota to process dark chocolate content and its active ingredients, such as phenylethylamine, N-oleoyl- and N-linoleoyl-ethanolamine, H Journal of Proteome Research • Vol. xxx, No. xx, XXXX theobromine, flavonoids (epicatechin, catechin and their oligomers).36,37,40 In particular, urinary excretion of 4-hydroxyphenylacetate and hippurate was previously ascribed to intake of polyphenols-rich products such as chocolate.41 These observations are therefore complementary to our preliminary investigations of metabolic signatures associated to chocolate dietary habits.3 Our observations indicated that the metabolic impact of a daily intake of dark chocolate was strongly dependent on the dispositional stress state of the individuals, as noted with statistically significant metabolic effects only in subjects with inherent high anxiety trait. Consumption of dark chocolate resulted in the decrease of the levels of catecholamines (adrenaline, noradrenaline, normetanephrine), corticosterone, and the stress hormone cortisol in the urine from subjects with high dispositional stress. Chronic stress is correlated with increases in stress hormones cortisol and catecholamines,42-45 research articles Metabolic Effects of Dark Chocolate Consumption Figure 4. Stress and anxiety trait metabolic signatures in MS profiles O-PLS-DA scores (A) and coefficients (B) plots for the models discriminating urine samples collected at baseline (day 0) according to self-reported anxiety trait derived from O-PLS-DA of MS profiles of urine. Key: *Structure annotation is based on strong analytical evidence (combinations of chromatography, mass spectrometry, chemical reactions, deuterium-labeling, database and literature search, comparison to similar/homologue/isomeric reference compounds). and our results suggest potential beneficial implications of dark chocolate consumption for reduction of mental and/or physical stress and improvement of the metabolic response to stress. Moreover, the anxiety trait-related metabolic differences observed in urine (e.g., levels of hippurate, p-cresol sulfate, glycine, citrate, trans-aconitate, proline, DOPA, and β-alanine) tended to be normalized toward the levels observed in low anxiety trait subjects, whereas metabolic signatures in blood plasma were maintained over the duration of the clinical trial. Therefore, our observations provided additional evidence that consumption of dark chocolate may beneficially impact on stress-associated metabolism as observed through a partial normalization of stress-related differences in energy metabolism and gut microbial activities. Conclusions Our study in free living and healthy humans demonstrates a link between metabolic phenotype of individuals and specific dietary patterns. The current observations strongly support the idea that specific foods impact on human metabolism through the modulation of gut microbial activities. The daily consumption of dark chocolate resulted in a significant modification of the metabolism of healthy and free living human volunteers with potential long-term Journal of Proteome Research • Vol. xxx, No. xx, XXXX I research articles Martin et al. Table 5. Summary of Time-Dependent Metabolite Differences between High and Low Anxiety Trait Individuals in Urine and Plasmaa metabolites/p-values measured by biofluids high/low anxiety trait at day 0 high/low anxiety trait at day 8 high/low anxiety trait at day 15 3-Methoxytyrosine Acetate Aconitate Adrenaline Choline Citrate DOPA Glutamate Glycine Glycine Hippurate Lycopene Methylsuccinate Normetanephrine p-Cresol sulfate Proline Trimethylamine Trans-Aconitate β-alanine β-Carotene MS NMR MS MS NMR NMR MS NMR NMR MS NMR MS NMR MS MS MS NMR NMR MS MS Urine Plasma Urine Urine Plasma Urine Urine Plasma Urine Urine Urine Plasma Urine Plasma Urine Urine Urine Urine Urine Plasma 0.0080 0.0289 0.0448 0.0420 0.0356 0.0130 0.0045 0.0207 0.0350 0.0205 0.0070 0.0304 0.0100 0.0253 0.0444 0.0082 0.0169 0.0251 0.0425 0.0333 0.0056 0.0260 0.0191 0.0300 0.0046 0.0160 0.0440 a Key: - designates difference not significant at 95% confidence level. Figure 5. Time-dependent metabolic differences between high and low anxiety trait individuals Comparison of MS signals of plasma β-carotene, urine p-cresol sulfate and glycine, and area normalized intensities of representative signals of hippurate, trans-aconitate, and citrate from 1H NMR urine metabolic profiles displayed using box-and-whisker plots. For metabolites identified by 1H NMR spectroscopy, data are presented as area normalized intensities (a.u.) as follows: 1 × 10⁻² a.u. for citrate, 1 × 10⁻⁴ a.u. for transaconitate and 1 × 10⁻¹ a.u. for hippurate. Median values are highlighted by dashed and solid lines. Statistical significance of differences with time and anxiety trait levels is reported in Tables 4 and 5. consequences on human health within only 2 weeks treatment. This was observable through the reduction of levels of stress-associated hormones and normalization of the J Journal of Proteome Research • Vol. xxx, No. xx, XXXX systemic stress metabolic signatures. Therefore, subtle changes in dietary habits are likely to modulate the metabolic status of free-living individuals that might be associated with long- research articles Metabolic Effects of Dark Chocolate Consumption term health consequences, in particular via the activity of the symbiotic bacterial partners. Abbreviations: CPMG, Carr-Purcell-Meiboom-Gill; MS, mass spectrometry; NMR, nuclear magnetic resonance; O-PLSDA, orthogonal projection to latent structure discriminant analysis; PCA, principal component analysis; PLS-DA, projection to latent structure discriminant analysis. Acknowledgment. We thank TNO Quality of Life, Zeist (The Netherlands) and Juliet Farrar (Nestlé Research Center, Lausanne, Switzerland) for conducting the study. The authors acknowledge the help and input of Philippe Guy, Ivan Montoliu Roura, and Nicolas Antille of Nestlé Research Center, Lausanne, Switzerland. Supporting Information Available: Supplementary Figure 1, principal component analysis of biological matrices; Supplementary Table 1, summary of contrast test statistics to assess metabolic relationships between anxiety trait levels and chocolate consumption in urine and plasma. This material is available free of charge via the Internet at http://pubs.acs.org. (17) (18) (19) (20) (21) (22) (23) (24) References (1) Nicholson, J. K.; Holmes, E.; Wilson, I. D. Gut microorganisms, mammalian metabolism and personalized health care. Nat. Rev. Microbiol. 2005, 3 (5), 431–438. (2) Dethlefsen, L.; Fall-Ngai, M.; Relman, D. A. An ecological and evolutionary perspective on human-microbe mutualism and disease. Nature 2007, 449 (7164), 811–818. (3) Rezzi, S.; Ramadan, Z.; Martin, F. P.; Fay, L. B.; Bladeren, P. V.; Lindon, J. C.; Nicholson, J. K.; Kochhar, S. Human Metabolic Phenotypes Link Directly to Specific Dietary Preferences in Healthy Individuals. J. Proteome Res. 2007, 6 (11), 4469–4477. (4) Blaut, M.; Clavel, T. Metabolic diversity of the intestinal microbiota: implications for health and disease. J. Nutr. 2007, 137 (3), 751S– 755S. (5) Drewnowski, A. Taste preferences and food intake. Annu. Rev. Nutr. 1997, 17, 237–253. (6) Scalbert, A.; Williamson, G. Dietary intake and bioavailability of polyphenols. J. Nutr. 2000, 130 (8), 2073S–2085S. (7) Serafini, M.; Bugianesi, R.; Maiani, G.; Valtuena, S.; De, S. S.; Crozier, A. Plasma antioxidants from chocolate. Nature 2003, 424 (6952), 1013. (8) Grassi, D.; Necozione, S.; Lippi, C.; Croce, G.; Valeri, L.; Pasqualetti, P.; Desideri, G.; Blumberg, J. B.; Ferri, C. Cocoa reduces blood pressure and insulin resistance and improves endotheliumdependent vasodilation in hypertensives. Hypertension 2005, 46 (2), 398–405. (9) Taubert, D.; Roesen, R.; Lehmann, C.; Jung, N.; Schomig, E. Effects of low habitual cocoa intake on blood pressure and bioactive nitric oxide: a randomized controlled trial. JAMA, J. Am. Med. Assoc. 2007, 298 (1), 49–60. (10) Parker, G.; Parker, I.; Brotchie, H. Mood state effects of chocolate. J Affect. Disord. 2006, 92 (2-3), 149–159. (11) di Tomaso, E.; Beltramo, M.; Piomelli, D. Brain cannabinoids in chocolate. Nature 1996, 382 (6593), 677–678. (12) McDonald, I. Gordon Holmes Lecture: Gordon Holmes and the neurological heritage. Brain 2007, 130 (1), 288–298. (13) Holmes, E.; Loo, R. L.; Stamler, J.; Bictash, M.; Yap, I. K.; Chan, Q.; Ebbels, T.; De, I. M.; Brown, I. J.; Veselkov, K. A.; Daviglus, M. L.; Kesteloot, H.; Ueshima, H.; Zhao, L.; Nicholson, J. K.; Elliott, P. Human metabolic phenotype diversity and its association with diet and blood pressure. Nature 2008, 453 (7193), 396–400. (14) Martin, F. P.; Wang, Y.; Sprenger, N.; Yap, I. K.; Lundstedt, T.; Lek, P.; Rezzi, S.; Ramadan, Z.; van, B. P.; Fay, L. B.; Kochhar, S.; Lindon, J. C.; Holmes, E.; Nicholson, J. K. Probiotic modulation of symbiotic gut microbial-host metabolic interactions in a humanized microbiome mouse model. Mol. Syst. Biol. 2008, 4, 157. (15) Martin, F.-P. J.; Wang, Y.; Sprenger, N.; Yap, I. K. S.; Rezzi, S.; Ramadan, Z.; Pere-Trepat, E.; Rochat, F.; Cherbut, C.; van Bladeren, P.; Fay, L. B.; Kochhar, S.; Lindon, J. C.; Holmes, E.; Nicholson, J. K. Top-down systems biology integration of conditional prebiotic transgenomic interactions in a humanized microbiome mouse model. Mol. Syst. Biol. 2008, 4, 205. (16) Stella, C.; Beckwith-Hall, B.; Cloarec, O.; Holmes, E.; Lindon, J. C.; Powell, J.; van der, O. F.; Bingham, S.; Cross, A. J.; Nicholson, J. K. (25) (26) (27) (28) (29) (30) (31) (32) (33) (34) (35) (36) (37) (38) (39) (40) (41) Susceptibility of human metabolic phenotypes to dietary modulation. J. Proteome Res. 2006, 5 (10), 2780–2788. Spielberger, C.; Gorsuch, R.; Lushene, R. Manual for the SelfEvaluation Questionnaire; Consulting Psychologists Press: Palo Alto, CA, 1983. Nicholson, J. K.; Foxall, P. J.; Spraul, M.; Farrant, R. D.; Lindon, J. C. 750 MHz 1H and 1H-13C NMR spectroscopy of human blood plasma. Anal. Chem. 1995, 67 (5), 793–811. Roessner, U.; Wagner, C.; Kopka, J.; Trethewey, R. N.; Willmitzer, L. Technical advance: simultaneous analysis of metabolites in potato tuber by gas chromatography-mass spectrometry. Plant J. 2000, 23 (1), 131–142. Cook, J. G. Creatinine assay in the presence of protein. Clin. Chim. Acta 1971, 32 (3), 485–486. Yamada, H.; Yamahara, A.; Yasuda, S.; Abe, M.; Oguri, K.; Fukushima, S.; Ikeda-Wada, S. Dansyl chloride derivatization of methamphetamine: a method with advantages for screening and analysis of methamphetamine in urine. J. Anal. Toxicol. 2002, 26 (1), 17–22. Wold, S.; Esbensen, K.; Geladi, P. Principal component analysis. Chemom. Intell. Lab. Syst. 1987, 2 (1-3), 37–52. Trygg, J.; Wold, S. Orthogonal projections to latent structures (OPLS). J. Chemom. 2002, 16 (3), 119–128. Cloarec, O.; Dumas, M. E.; Trygg, J.; Craig, A.; Barton, R. H.; Lindon, J. C.; Nicholson, J. K.; Holmes, E. Evaluation of the orthogonal projection on latent structure model limitations caused by chemical shift variability and improved visualization of biomarker changes in 1H NMR spectroscopic metabonomic studies. Anal. Chem. 2005, 77 (2), 517–526. Wiklund, S.; Johansson, E.; Sjostrom, L.; Mellerowicz, E. J.; Edlund, U.; Shockcor, J. P.; Gottfries, J.; Moritz, T.; Trygg, J. Visualization of GC/TOF-MS-based metabolomics data for identification of biochemically interesting compounds using OPLS class models. Anal. Chem. 2008, 80 (1), 115–122. Gunnar, M.; Quevedo, K. The neurobiology of stress and development. Annu. Rev. Psychol. 2007, 58, 145–173. Noble, R. E. Diagnosis of stress. Metabolism 2002, 51 (6), 37–39. Hyland, K.; Surtees, R. A.; Rodeck, C.; Clayton, P. T. Aromatic L-amino acid decarboxylase deficiency: clinical features, diagnosis, and treatment of a new inborn error of neurotransmitter amine synthesis. Neurology 1992, 42 (10), 1980–1988. Eisenhofer, G.; Kopin, I. J.; Goldstein, D. S. Catecholamine metabolism: a contemporary view with implications for physiology and medicine. Pharmacol. Rev. 2004, 56 (3), 331–349. Nicholson, J. K.; Higham, D. P.; Timbrell, J. A.; Sadler, P. J. Quantitative high resolution 1H NMR urinalysis studies on the biochemical effects of cadmium in the rat. Mol. Pharmacol. 1989, 36 (3), 398–404. Caso, J. R.; Leza, J. C.; Menchen, L. The effects of physical and psychological stress on the gastro-intestinal tract: lessons from animal models. Curr. Mol. Med. 2008, 8 (4), 299–312. Santos, J.; Perdue, M. H. Stress and neuroimmune regulation of gut mucosal function. Gut 2000, 47 (4), 49–51. Tannock, G. W. New perceptions of the gut microbiota: implications for future research. Gastroenterol. Clin. North Am. 2005, 34 (3), 361–382. Matto, J.; Maunuksela, L.; Kajander, K.; Palva, A.; Korpela, R.; Kassinen, A.; Saarela, M. Composition and temporal stability of gastrointestinal microbiota in irritable bowel syndrome--a longitudinal study in IBS and control subjects. FEMS Immunol. Med. Microbiol. 2005, 43 (2), 213–222. Yap, I. K.; Li, J. V.; Saric, J.; Martin, F. P.; Davies, H.; Wang, Y.; Wilson, I. D.; Nicholson, J. K.; Utzinger, J.; Marchesi, J. R.; Holmes, E. Metabonomic and microbiological analysis of the dynamic effect of vancomycin-induced gut microbiota modification in the mouse. J. Proteome Res. 2008, 7 (9), 3718–3728. Selmer, T.; Andrei, P. I. p-Hydroxyphenylacetate decarboxylase from Clostridium difficile. A novel glycyl radical enzyme catalysing the formation of p-cresol. Eur. J. Biochem. 2001, 268 (5), 1363– 1372. Zeisel, S. H.; Blusztajn, J. K. Choline and human nutrition. Annu. Rev. Nutr. 1994, 14, 269–296. Yang, D.; Brunengraber, H. Glutamate, a window on liver intermediary metabolism. J. Nutr. 2000, 130 (4), 991S–994S. Beliveau, G. P.; Brusilow, S. W. Glycine availability limits maximum hippurate synthesis in growing rats. J. Nutr. 1987, 117 (1), 36–41. Rechner, A. R.; Kuhnle, G.; Bremner, P.; Hubbard, G. P.; Moore, K. P.; Rice-Evans, C. A. The metabolic fate of dietary polyphenols in humans. Free Radical Biol. Med. 2002, 33 (2), 220–235. Rios, L. Y.; Gonthier, M. P.; Remesy, C.; Mila, I.; Lapierre, C.; Lazarus, S. A.; Williamson, G.; Scalbert, A. Chocolate intake Journal of Proteome Research • Vol. xxx, No. xx, XXXX K research articles increases urinary excretion of polyphenol-derived phenolic acids in healthy human subjects. Am. J. Clin. Nutr. 2003, 77 (4), 912– 918. (42) Seematter, G.; Binnert, C.; Tappy, L. Stress and metabolism. Metab Syndr. Relat. Disord. 2005, 3 (1), 8–13. (43) Goldstein, D. S. Catecholamines and stress. Endocr. Regul. 2003, 37 (2), 69–80. (44) Goldstein, D. S.; Dionne, R.; Sweet, J.; Gracely, R.; Brewer, H. B., Jr.; Gregg, R.; Keiser, H. R. Circulatory, plasma catecholamine, L Journal of Proteome Research • Vol. xxx, No. xx, XXXX Martin et al. cortisol, lipid, and psychological responses to a real-life stress (third molar extractions): effects of diazepam sedation and of inclusion of epinephrine with the local anesthetic. Psychosom. Med. 1982, 44 (3), 259–272. (45) Berk, L. S.; Tan, S. A.; Berk, D. Cortisol and Catecholamine stress hormone decrease is associated with the behavior of perceptual anticipation of mirthful laughter. FASEB J. 2008, 22 (1), 946. PR900607V
Baixar