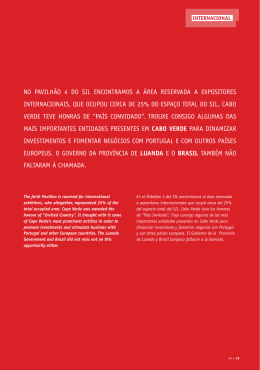
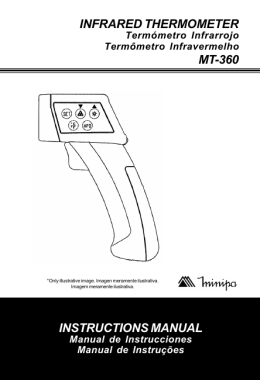
Determinaciones sobre el diagrama 25-03-2014 Exemplo EXCEL Indice CAPE • El índice CAPE se define como la Energía Potencial Convectiva Disponible, se mide en J/Kg, indica el potencial de ascenso que tiene una burbuja de aire una vez inestabilizado. A mayor valor, mayor inestabilidad. • CAPE = Gravedad * SUMP (DELZ * (Tp - Ta) / Ta) • • Donde: • SUMP = Suma sobre todas las capas del sondeo desde el nivel de Libre Conveccion NLC hasta el Nivel de Equilibrio NE para las cuales (Tp - Ta) es mayor que cero. • DELZ = Espesor • Tp = Temperatura de una parcela elevada por un proceso adiabático seco hasta el Nivel de Condensación por Ascenso NCA y luego por un proceso adiabático húmedo hasta lograr el equilibrio con el ambiente • Ta = Temperatura del ambiente Ambiente Partícula Passo 1: Temp Temp (TpAmb Parcel(º Camada Press Tp-Ta Ta)/Ta alt(m) Δz (m) (ºK) K) 263.8 268.2 4.4 0.016 4975 1 500 257.8 263.2 5.4 0.021 5610 635 2 450 250.1 258.2 8.1 0.031 6458 848 3 400 241.5 253.2 11.7 0.046 7250 792 4 350 243.2 273.5 30.3 0.111 8210 960 5 300 223.1 233.2 10.1 0.043 9240 1030 6 250 213.0 223.2 10.2 0.046 10430 1190 NE p a p a CAPE g dz a a NCL NCL NE g z Passo 1: Depois de ter examinado o som e determinou a NLC (ou NCC) e NE, deves tabular a temperatura ambiente e a temperatura parcela de ar (lembra, em Kelvin) para cada nível de pressão do NLC (ou NCC) para a NE . Passo 2: Utilizando as informações da Tabela 1, resolver a equação 1 em cada nível. Sugiro ter uma segunda tabela como o dado como Tabela 2. Passo 1: Temp Temp (TpAmb Parcel(º Camada Press Tp-Ta Ta)/Ta alt(m) Δz (m) (ºK) K) 263.8 268.2 4.4 0.016 4975 1 500 257.8 263.2 5.4 0.021 5610 635 2 450 250.1 258.2 8.1 0.031 6458 848 3 400 241.5 253.2 11.7 0.046 7250 792 4 350 243.2 273.5 30.3 0.111 8210 960 5 300 223.1 233.2 10.1 0.043 9240 1030 6 250 213.0 223.2 10.2 0.046 10430 1190 Passo 2: Camada Delta z 1 2 3 4 5 6 500 450 400 350 300 250 camada Temp de Δz (m) Acel. Grav. Quoc* CAPE** 4975 9.8 0.0164 102.1 5610 635 9.8 0.0205 170.5 6458 848 9.8 0.0314 243.5 7250 792 9.8 0.0462 434.8 8210 960 9.8 0.1108 1118.4 9240 1030 9.8 0.0433 505.2 10430 1190 Total CAPE 2574.6 08579 Lisboa Observations at 12Z 08 Feb 2014 • • • • • • • • • • • • • • Station information and sounding indices Station number: 8579 Observation time: 140208/1200 Station latitude: 38.76 Station longitude: -9.13 Station elevation: 105.0 Showalter index: 9.78 Lifted index: 7.06 LIFT computed using virtual temperature: 7.15 SWEAT index: 135.98 K index: -28.80 Cross totals index: 17.60 Vertical totals index: 20.70 Totals totals index: 38.30 Agua precipitável = r-rs • • • • • • • • • • • • • • • • Convective Available Potential Energy: 20.24 CAPE using virtual temperature: 28.78 Convective Inhibition: -0.05 CINS using virtual temperature: 0.00 Equilibrum Level: 785.71 Equilibrum Level using virtual temperature: 782.69 Level of Free Convection: 915.71 LFCT using virtual temperature: 921.55 Bulk Richardson Number: 0.16 Bulk Richardson Number using CAPV: 0.23 Temp [K] of the Lifted Condensation Level: 279.91 Pres [hPa] of the Lifted Condensation Level: 921.55 Mean mixed layer potential temperature: 286.53 Mean mixed layer mixing ratio: 6.76 1000 hPa to 500 hPa thickness: 5482.00 Precipitable water [mm] for entire sounding: 15.96 Distintos tipos de estabilidade atmosférica num diagrama termodinámico Distintos tipos de estabilidade na atmosfera
Baixar