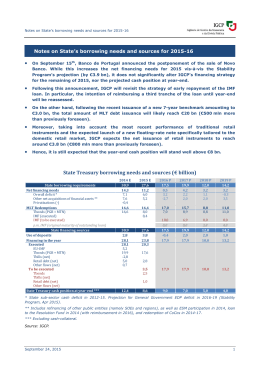
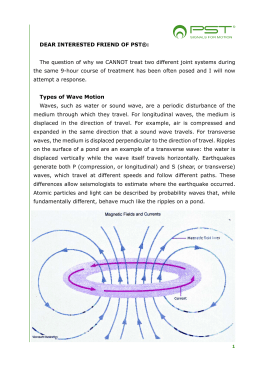
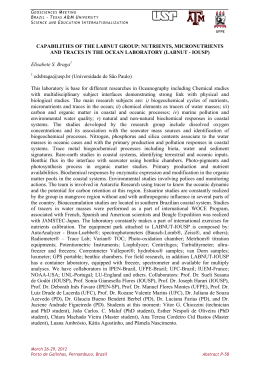
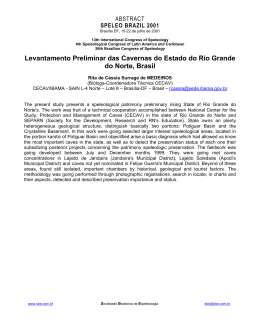
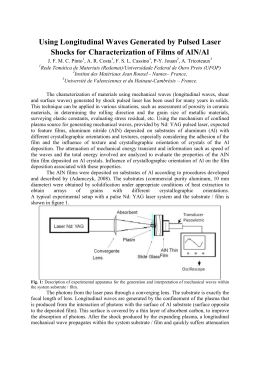
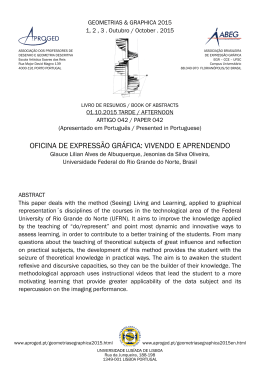
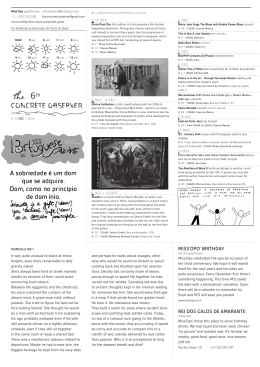
th
5 IGCP 526 Conference “Continental Shelves: Risks, Resources and Record of the Pats”.
Sidney, British Columbia, Canada 2011.
OSCILLATORY COASTAL WAVES AND CURRENTS PROFILE IN THE
NORTHERN CONTINENTAL SHELF OF RIO GRANDE DO NORTE STATE,
NORTHEAST BRAZIL
Matos, M.F.A. and Amaro, V.E.
Post-Graduation Program in Geophysics and Geodynamics, Federal University of Rio
Grande do Norte, Natal/RN, Brazil.
E-mail: [email protected], [email protected]
The northern coast of Rio Grande do Norte State, Northeast Brazil, is an
important focus of oil and natural gas exploitation, salt industry, shrimp farming, wind
farms and fishing industry, in addition to other small-scale activities, such as tourism.
The oil industry, particularly, concentrated in the continental shelf of shallow water
depths of 6 to 30 m (DANTAS et al., 2010). In this coast, under conditions of high
economic pressure, a coastal dynamic are intense and has important morphological
features systems such as barrier islands, estuaries, tidal flat, mangroves, and complex
seafloor features. Such morphological features interact with the hydrodynamic agents,
as waves, currents, tides, winds, weather and climate.
These conditions due to the articulation of environmental impacts from landuse
of the coastal zone generated by these activities have been detected in coastal areas and
shallow continental shelf in other regions of Brazil and all around the world, especially,
about the risk of hydrocarbon contamination of the high sensitivity coastal ecosystems.
The rising environmental impacts and the importance of coastal environments, as well
as better understand the behavior of dynamic coastal processes and hydrodynamics;
justify the establishment of the accuracy of the processes caused by the effect of waves,
currents and tides by means of measurements and environmental monitoring.
Thus, this communication describes observations, procedures of measurements
made in the study area, especially on the area adjacent to the Diogo Lopes estuary. Such
sites were defined before the intense dynamics occurring in the area, therefore, this
segment reveals the highest coastal sediment transport, action of waves and drift
currents. The characterization will contribute to understanding, particularly of coastal
line changes, as the systems formed by the barrier islands of Ponta Tubarão and Barra
Fernandez.
.
Introduction
The northern coast of Rio Grande do Norte, northeast Brazil, is submitted to an
intense coastal hydrodynamics, resulting from the combination of geological,
oceanographic, climatic and biological events, linked to anthropogenic issues.
The morphological instability is confirmed by the coastal erosion and/or accretion
of coastal line resulting from the invariable action of waves, sea level variation, climatic
conditions, neotectonic activities and the lack of continental sediments supply to the
shelf, that control the development of constructive and erosive features along the coast
(SOUTO et al., 2009). Current studies on the shoreline have mainly involved
monitoring the evolution and temporal variations of the shoreline morphodynamics and
its correlation with the wave parameters. However, they are sporadic in space and time.
Essentially, the studies related to waves, currents and tides, are vital to characterizing
the wave climate of the coast, as well as of fundamental importance for studies related
to sediment balance and morphodynamics, supporting coastal engineering activities.
th
5 IGCP 526 Conference “Continental Shelves: Risks, Resources and Record of the Pats”.
Sidney, British Columbia, Canada 2011.
This is the perspective to understand the processes responsible for coastal and
marine environmental changes imposed whether constructive or destructive, which
brought the need for environmental monitoring in this region (NASCIMENTO, 2009;
MATOS et al., 2011). This region has fragile ecosystems coexisting with major
socioeconomic activities, such as oil exploitation, sea salt and shrimp farming,
agriculture, fisheries and tourism (SILVA et al, 2010). Such activities are conflicting
with each other, either by physical space use or the environmental relevance as the risk
of oil spill. Therefore, the main objective of this work is the monitoring the waves and
ocean currents on inner continental shelf waters, but precisely in the mouth of elongate
estuary of Diogo Lopes.
Study Area Characteristics
The study area is located in the shallow inner continental shelf adjacent to the
estuary of Diogo Lopes, where are installed the barrier island system of Ponta do
Tubarao e Barra do Fernandez (Figure 1).
Two devices were placed in strategic locations: The first point (PT1), was
anchored at a distance of 3.6 km of the shoreline, with water depths between 5-6 meters,
and near the Serra oil field. The second point (PT2) is located north of the barrier
islands system of Ponta Tubarão and Barra Fernandez, at a distance of about 7.4 km of
the shoreline, at depths between 7-8 meters.
The data acquisition was between October 2010 to February 2011. This interval
is characterized as the driest month on the region, with a predominance of winds from
the northeast, and rainfall deficit below 50 mm.
The tidal conditions are between 234 cm to 43 cm of spring tide and 221 cm to 56
of neap tide, therefore showing as a region dominated by waves and tides.
The waves data acquisition occurred during spring tide, under conditions of semidiurnal tidal, where the middle level (Z_0) set is 139 cm above the reduction level (RN)
with maximum spring tide-high tide of 234 cm above the RN, mean high tide sea-neap
tide of 221 cm and minimum neap tide of 56 cm according to the tide gauge station of
Macau Harbor (DHN, 2010).
th
5 IGCP 526 Conference “Continental Shelves: Risks, Resources and Record of the Pats”.
Sidney, British Columbia, Canada 2011.
Figure 1. Study area and local ADCP and S4 in situ measurements.
Materials and Methods
The parameters related to waves and currents were obtained using acoustic-type
ADCP and current electromagnetic model type S4. Both devices were anchored in the
places showed in Figure 1. The waves and currents data obey a set of record for the
episode of highest tidal range of events, considering spring tides.
The statistical analysis method of acoustic wave sensors was the Maximum
Likelihood MLMST, with surface control, standard method for estimating directional
wave spectral (KHAMA et al., 2005; PEDERSEN et al., 2007). The current analysis
used the method proposed by Trageser e Elwany (1990). It describes the procedure for
processing data from waves and currents through the program Wave Analysis. For the
average speed was adopted AS et al. (2011).
Results and Discussions
Wave Analysis
Spectral analysis performed based on the records obtained in each of devices
allowed to obtain the values of significant wave height HS, maximum height Hmax,
significant interval TS, peak interval TP, mean direction, DIRmed, and direction of peak
DIRTp, along the campaign interval.
In addition to the significant wave values, the extreme values are presented.
Capitão et al. (1999) showed that the extreme values of wave heights, intervals and
direction, besides the significant values, associated with a particular return interval,
which is determined by the regime of extremes, is a fundamental aspect in the design of
offshore structures mainly.
th
5 IGCP 526 Conference “Continental Shelves: Risks, Resources and Record of the Pats”.
Sidney, British Columbia, Canada 2011.
For such waves estimates were considered the frequency of every 7 days for
each interval (Dez/2010 e Feb/2011), coinciding with intervals of major change of
events and phases of spring tide. Figure 2 shows that the heights to grow during the first
day before the cycle of spring tide, followed by two days of early stages of spring tide
cycle, with significant wave height Hs (A1) maximum of 1.96 m, 0.84 m and average
minimum of 1.26 m. From the four days, the values begin to fall, the days are near the
neap tidal cycle; the same will occur over the maximum height of waves (A4), with
averages of 3.21 m, 1.87 m and average minimum of 1.07 m over the interval Ts of
significant wave (A2) values were revealed with a maximum of 6.63 s; average
minimum of 4.47 s; for the peak interval Tp (A5), values had a greater variation, with
Tp up to 15.26 s, mean of 8.92 is less than 3.04 s.
The data indicate that most of the waves arriving from the northeast, with small
variations in the direction of northwest (A3 e A6).
A2
1
4
2
00:01
00:01 00:01 00:01
00:01
00:01
00:01 00:01 00:01
7-Day
Cycle
(Dez/2010)
300
200
100
0
00:01 00:01 00:01
00:01
00:01
00:01 00:01 00:01
7-Day
Cycle
(dez/2010)
7-Day Cycle (Dez/2010)
A5
A6
20
400
3
15
300
2
0
7-Day
Cycle
(Dez/2010)
00:01 00:01 00:01
00:01
00:01
00:01 00:01 00:01
DIRTp (º)
5
Tp (s)
Hmax (m)
6
0
0
A4
400
8
Ts (s)
Hs (m)
2
A3
DIRmed (º)
A1
10
5
0
00:01
7-Day Cycle (Dez/2010)
200
100
0
00:01 00:01 00:01
00:01
00:01 00:01 00:01
7-Day00:01
Cycle
(Dez/2010)
Figure 2 – Characteristics of the maritime agitation cycle of 7 days (Dez/2010) during
the spring tide.
In the second interval (February 2011) the characteristics of sea wave climates
reveal different waves propagating along the coast, as evidenced by extreme values and
presented significant (Figure 3). Under these conditions the characteristics of waves
during this interval were: HS of 4.53 meters for the average maximum, average 2.13 m
and 0.66 m minimum HS (B1); the maximum heights Hmax (B4), showed significant
increase for the region, 7,56 m the maximum, 3,56 m a média de Hmax e 1,10 m a
Hmax minimum. The behavior of the interval (B2 e B5) were also higher than the
interval of maximum with Ts 7s, 85s, mean of Ts de 5,54s e Ts minimum de 3,17s; in
the extreme values of Tp are the characteristics: Tp maximum of 16,5s, Tp mean of
10,12s e Tp minimum of 2,94s.
Concerning the trend of wave propagation, there is a greater irregularity in the
dispersion of the spectrum, it means Dirmed as the spectrum of peak directions DirTp (B3
e B6). The figure shows the directions of the waves scattered in extremely variable
concentrations of Dirmed and directions from NW and NE in the background.
th
5 IGCP 526 Conference “Continental Shelves: Risks, Resources and Record of the Pats”.
Sidney, British Columbia, Canada 2011.
B1
B2
8
3
4
300
200
100
0
0
B4
0
7-Day Cycle (Feb/2011)
7-Day Cycle (Feb/2011)
7-Day Cycle (Feb/2011)
B5
B6
18
Tp (s)
6
3
400
DIRTp (º)
9
Hmax (m)
400
DIRmed (º)
Ts (s)
6
Hs (m)
B3
9
300
200
100
0
0
7-Day Cycle (Feb/2011)
0
7-Day Cycle (Feb/2011)
7-Day Cycle (Feb/2011)
Figure 3 – Characteristics of the maritime agitation cycle of 7 days (Feb/2011) during
the spring tide.
The variations in wave heights, phase and directions, are combined with varying
levels of strength as the influence of extreme winds; in turn it is influenced by the North
Brazil Current that determines the pattern of ocean circulation in the region with NW
and NE trends notably, as will be shown below.
Current Analysis
Measurements of wave orbital velocity are converted to axial velocity
components U and V component and especially the coastal current speed. The
maximum values (positive) of all records of velocity components of cross-shore
component is associated with a speed with direction to the coast and minimum values
(negative) correspond to a speed with direction out to sea, after correcting the values
obtained directly from the instrument, principally of the principal directions. On the
other hand, the alongshore component shows the maximum (positive) to NW and
minimum (negative) to NE (Figure 4).
The difference in amplitude between the two components of orbital velocity,
especially in Figure 5 with a record of 7 days of measurements during the phase of the
spring tide, and the cross-shore component of velocity has a larger range of negative
values of the alongshore component, and guidance more frequently in NW direction
(Figure 7). This means that during this interval of measurement it was more affected by
the current of NW, then spreading in parallel with the shoreline (alongshore).
The expected result would be a chance for this region by its geographical
position, since the refraction waves, as they come into shallower waters, causes the
rotation of the direction of propagation of the same propagation order in the direction
parallel to the bathymetric lines and, in this case, parallel to the shoreline.
Figures 6, 7, 8 and 9 presented the current standards for the two intervals. Note
that the patterns of currents vary throughout a interval of one day. In general, lower
values of currents are in the early hours of the day, with another variable in the lower
range at night. The values are increasing and show two peaks of values above 0.20 m/s
th
5 IGCP 526 Conference “Continental Shelves: Risks, Resources and Record of the Pats”.
Sidney, British Columbia, Canada 2011.
at night. In the first interval the maximum current speed was 030 m/s, mean 0.12 m/s
minimum of 0.05 m/s.
In the second interval the average of speed currents remain close to expectations,
no major changes. The maximum current velocity was 0.27 m/s, mean 0.12 m/s and
minimum of 0.09 m/s.
The directions patterns are generally from NW and secondly NE. Note that the
phase in which the currents begin with directions from NE to NW during the day, to that
effect with the highest concentration, subsequently decay back to the NE quadrant and
successively, with a dominant pattern over interval of measurements.
30
U, V (cm/s)
20
10
0
-10
-20
-30
Longshore
Cross-shore
Figure 4 - Cross-shore (U) and alongshore (V) components horizontal velocity, acquisition
frequency of 15 days of measurements.
30
U_Cross-shore
V_longshore
U, V (cm/s)
20
10
0
-10
-20
-30
7-Day Cycle
Figure 5 - Cross-shore (U) and longshore (V) components horizontal velocity measured during
the cycles of spring tide, detail for 7 days of continuous measurements.
Speed (m/s)
0.4
0.2
0.0
03/12/2010 00:00
7-Day Cycle (Dec/2010)
Figure 6 - Components of horizontal velocity measured during the spring tide cycle, detail for 7
days of continuous measurements.
th
5 IGCP 526 Conference “Continental Shelves: Risks, Resources and Record of the Pats”.
Sidney, British Columbia, Canada 2011.
Dir (º)
400
200
0
7-Day Cycle (Dec/2010)
Figure 7 – Spectrum of the current velocities directions during spring tide, detail for 7 days of
continuous measurements.
Speed (m/s)
0.4
0.2
0.0
7-Day Cycle (Feb/2011)
Figure 8 – Components of horizontal velocity measured during the spring tide cycle, detail for 7
days of continuous measurements.
Dir (º)
400
200
0
7-Day Cycle (Feb/2011)
Figure 9 – Spectrum of the current velocities directions during the cycle of spring tide, detail for
7 days of continuous measurements.
Conclusions
The conclusions of the waves trends and velocities analysis, the U component
(cross-shore) and V (longshore) showed similar amplitude values between the speeds
that the U component has a higher frequency of negative values during the entire
measurement interval and during a 7-day cycle phases of spring tides.
The velocity component parallel to the shoreline is of greater importance in
recording speed in sediment transport along the coast. The set of values of currents and
waves will decisively influence the processes of accretion/erosion along the coast, as is
obvious in figures 10 and 11.
th
5 IGCP 526 Conference “Continental Shelves: Risks, Resources and Record of the Pats”.
Sidney, British Columbia, Canada 2011.
Figure 10 – Waves action from NW and NE directions acting on the configuration of
the shoreline, Ponta Tubarão Barrier Island.
Figure 11 – Wave action from NW and NE directions acting on the configuration of the
coast, Ponta Tubarão Barrier Island.
References
Dantas, S.T.P.L.; Amaro, V.E.; Costa, B.C.P. 2010. Mangrove Reforestation as a
Mesotidal Coastal Protection and Clean Development Mechanism on MacauSerra Oil Field, Potiguar Basin, Northeast Brazil. Journal of Coastal Research, v.
1, p. 1, 2010.
DHN. 2010. Diretoria de Hidrografia e Navegação. Bases de dados da tábua de maré
obtidas para os meses de Outubro a Dezembro de 2010.
Capitão, R., Conceição, J. M. F., Mendes de Carvalho, M., Covas, J. A, 1999. Definição
de Regimes de Agitação Marítima – Casos de Estudo, AIPCN/PIANC,
Comunicação das 1ª Jornadas Portuguesas de Engenharia Costeira e Portuária
1999, Porto, 31-34.
th
5 IGCP 526 Conference “Continental Shelves: Risks, Resources and Record of the Pats”.
Sidney, British Columbia, Canada 2011.
Kahma, K.; Hauser, D.; Krogstad, H. E.; Lehner, S.; Monbaliu, J.; Wyatt, L. R. 2005.
Measuring and analysing directional spectra of ocean waves, COST Action 714,
EUR 21367, Brussels.
Matos, M.F.A.; Fortes, C.J.E.M.; Amaro, V.E.; Scudelari, A.C.; Neves, C.F. 2011.
Análise de dados a partir de métodos in situ no Litoral Setentrional do Rio
Grande do Norte. In: VI Congresso sobre Planeamento e Gestão das Zonas
Costeiras dos Países de Expressão Portuguesa”, Boa Vista, Cabo Verde, APRH,
p.73.
Moura, T.; Fortes, C.J.E.M.; Capitao, R.C.; Sancho, F. (2011) – Relatório da Campanha
BRISA II. Costa da Caparica. 11 a 15 de Maio de 2010. Relatório BRISA
3/2010.
Nascimento, M.C. 2009. A erosão costeira e sua influência sobre a atividade petrolífera:
alternativas sustentáveis na mitigação de impactos ambientais. Dissertação de
Mestrado. Geodinâmica e Geofísica, Universidade Federal do Rio Grande do
Norte, Natal, Rio Grande do Norte, Brasil, 229p.
Pedersen, T.; Siegel, E; Wood, J. 2007. Directional wave measurements from a
subsurface buoy with an acustic wave and current profile (AWAC). MIS, 0933957-35-1, 10p.
Silva, D.R.V.; Amaro, V.E.; Souto, M.V. S.; Nascimento, M.C.; Pereira, B. R. 2010.
Geomorfologia de uma área com alta sensibilidade ambiental na Bacia Potiguar
(NE Brasil). Gerenciamento Costeiro Integrado, v. 10, p.545-566.
Souto, M.V.S. 2009. Análise da evolução costeira do Litoral Setentrional do Estado do
Rio Grande do Norte, Região sob influência da indústria petrolífera.Tese de
Doutorado. Geodinâmica e Geofísica, Universidade Federal do Rio Grande do
Norte, Natal, Rio Grande do Norte, Brasil, 171p.
Baixar