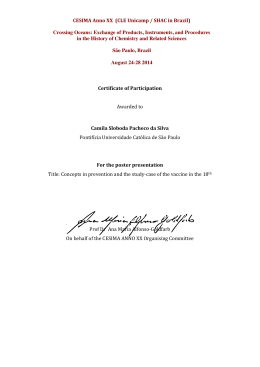
EVALUATION OF THE SOCIAL ECONOMIC INDICATORS OF THE MUNICIPALITIES OF THE
SÃO PAULO STATE GROUPS 1, 2 AND 3 WITH THE USE OF MULTIVARIATE ANALYSIS OF
VARIANCE
ARTIGO – ADMINISTRAÇÃO PÚBLICA
Maria Aparecida Gouvêa
Associate Professor, Department of Business Administration, University of São Paulo
School of Economics, Business Administration and Accounting (FEA-USP)
Professor, Statistics and Research Methodology, Department of Business
Administration, FEA-USP− São Paulo-SP, Brazil
E-mail: [email protected]
Recebido em: 1/7/2008
Aprovado em: 7/9/2009
Patrícia Siqueira Varela
Master of Controllership and Accounting, University of São Paulo School of
Economics, Business Administration and Accounting (FEA-USP)
Doctoral student, Controllership and Accounting program, FEA-USP− São Paulo-SP,
Brazil
E-mail: [email protected]
Milton Carlos Farina
Master of Business Administration, Escola de Administração de Empresas de São
Paulo, Fundação Getulio Vargas (FGV)
Doctoral student, Administration program, University of São Paulo School of
Economics, Business Administration and Accounting (FEA-USP)
Professor and coordinator, Information Systems, Statistics, and Actuarial Sciences
programs, Centro Universitário Capital – Unicapital− São Paulo-SP, Brazil
E-mail: [email protected]; estatí[email protected]
ABSTRACT
This article is part of an extensive study that deals with the statistical analysis of several groups of
municipalities. The objective of this study is to ascertain whether the mean per capita values of transfers
from the Municipalities Participation Fund (Fundo de Participação dos Municípios, FPM), the state Tax on
the Circulation of Goods and Services (ICMS) quota, and tax revenue are statistically different among the
municipalities of the state of São Paulo, classified by the State Social Responsibility Index into municipalities
with high economic and social indicators (group 1), municipalities with high wealth and medium/low social
indicators (group 2), and municipalities with low wealth and high/moderate social indicators (group 3),
based on multivariate analysis of variance. We found that the Tax Revenue variable had the highest mean
difference among the three groups. We may state that, for the three groups analyzed, the ICMS quota has
provided benefits to group 1 in terms of resources available for social investments. The distribution of FPM
resources, in turn, is contributing effectively to creating equitable conditions for municipalities in the state.
Key words: Public Revenues, São Paulo State Social Responsibility Index, Multivariate Analysis of
Variance.
REGE, São Paulo, v. 17, n. 2, p. 121-134, abr./jun. 2010
Maria Aparecida Gouvêa, Patrícia Siqueira Varela e Milton Carlos Farina
AVALIAÇÃO DE INDICADORES SOCIOECONÔMICOS DOS GRUPOS 1, 2 E 3 DE
MUNICÍPIOS PAULISTAS COM O USO DA ANÁLISE MULTIVARIADA DE VARIÂNCIA
RESUMO
Este trabalho faz parte de um amplo estudo que combina diversos grupos de municípios paulistas, os quais
são analisados mediante técnicas estatísticas. O trabalho objetivou indicar se as variáveis valores per capita
de transferência do Fundo de Participação dos Municípios (FPM), quota-parte do Imposto sobre Circulação
de Mercadorias e Serviços (ICMS) e Receita Tributária arrecadada têm médias estatisticamente diferentes
entre os municípios paulistas caracterizados pelo Índice Paulista de Responsabilidade Social (IPRS) como
municípios com altos índices econômicos e sociais (grupo 1), municípios com alto índice de riqueza e
médios/baixos índices sociais (grupo 2) e municípios com baixo índice de riqueza e altos/médios índices
sociais (grupo 3), com base na análise multivariada de variância. Foi observado que a variável Receita
Tributária possui a maior diferença de média entre os três grupos. É possível dizer que, para estes grupos
analisados, o grupo 1 tem sido beneficiado pela Quota-parte de ICMS com a disponibilização de recursos
para investimentos na área social. A distribuição do FPM, por sua vez, está contribuindo de forma efetiva
para tornar as condições dos municípios mais equitativas.
Palavras-chave: Receitas Públicas, Índice Paulista de Responsabilidade Social, Análise Multivariada de
Variância.
EVALUCIÓN DE INDICADORES SOCIOECONÓMICOS EN LOS GRUPOS 1,2 Y 3 DE
MUNICÍPIOS DE SAO PAULO CON EL USO DE ANÁLISIS MULTIVARIANTE DE LA
VARIANZA
RESUMEN
Este trabajo es parte de un amplio estudio que combina varios grupos de municipios paulistas, que son
analizados mediante técnicas estadísticas. El trabajo tuvo como objetivo indicar si las variables valores per
capita de transferencia del Fondo de Participación de los Municipios (FPM), cuota-parte del Impuesto sobre
Circulación de Mercaderías y Servicios (ICMS) y Ingreso Tributario recogido tienen promedios
estadísticamente diferentes entre los municipios paulistas caracterizados por el Índice Paulista de
Responsabilidad Social (IPRS) como municipios con altos índices económicos y sociales (grupo 1),
municipios con alto índice de riqueza y medianos/bajos índices sociales (grupo 2) y municipios con bajo
índice de riqueza y altos/medianos índices sociales (grupo 3), basado en el análisis multivariado de
varianza. Fue observado que la variable Ingreso Tributario posee la mayor diferencia de media entre los
tres grupos. Es posible decir que, para estos grupos analizados, el grupo 1 ha sido beneficiado por la Cuotaparte del ICMS con la disponibilidad de recursos para inversiones en el área social. La distribución del
FPM, a su vez, está contribuyendo de forma efectiva para hacer las condiciones de las ciudades más
equitativas.
Palabras-clave: Ingresos Públicos, Índice Paulista de Responsabilidad Social, Análisis Multivariada de
Varianza.
122
REGE, São Paulo, v. 17, n. 2, p. 121-134, abr./jun. 2010
Evaluation of the Social Economic Indicators of the Municipalities of the São Paulo State Groups 1, 2 and 3
with the Use of Multivariate Analysis of Variance
1. INTRODUCTION
In the last decades, one of the core issues of State
reform is the radical change in the rule concerning
the social division of labor, that is, the
responsibility taken by municipalities and by the
private sector in the production of goods and
services, which were considered a duty of the State
(OSZLAK, 1998, p. 53).
In the specific case of the municipalities,
decentralization has been the strategy of choice
both for the State reform process and for the
redemocratization of the country, making possible
the transfer of power, resources and attributions to
local governments.
Local governments were the major beneficiaries
of the tax decentralization started in the second half
of the 1970s and reinforced by the 1988
Constitution, especially due to the federal and state
transfers they received. The federal Municipalities
Participation Fund (FPM) and the state Tax on the
Circulation of Goods and Services (ICMS) quota
are the main transfers made to the municipalities.
To the majority of municipalities, constitutional
transfers represent the most significant source of
funding for their expenses. Bovo (2001, p. 114)
states that, for more than 3.000 out of the 5.550 or
so municipalities in the country, constitutional
transfers, especially the FPM, make up 90% of their
resources.
It must also be stressed that the main municipal
taxes – the Tax on Services (ISS) and the Tax on
Urban and Territorial Property (IPTU) – show
greater power of collection in medium-sized and
large municipalities. Moreover, in the criteria for
the transfer of the ICMS tax quota belonging to the
municipalities (25% of the total collected by the
State), the intensity of economic production exerts
great influence – that is, the transferred values are
directly related to the potential for wealth
generation at the municipal level. “[...] the
predominant logic underlying this tax is to reward
economically
successful
municipalities.”
(ABRUCIO; COUTO, 1996, p. 44).
The criteria for distribution of the resources
which make up the FPM has a significant impact on
the finances of small municipalities. According to
Subsection II, art. 161, of the 1988 Federal
Constitution, is the duty of the complementary law
REGE, São Paulo, v. 17, n. 2, p. 121-134, abr./jun. 2010
to establish rules on how FPM resources must be
distributed, seeking a socio-economical balance
between municipalities. Currently, the main
criterion for FPM allotment is the size of the
population. However, one may inquire whether this
criterion alone would be enough to achieve the
socio-economical balance intended, as the
differences between the municipalities are not
restricted to this factor exclusively, but are also
dependent on economic terms, urbanization levels,
physical conditions, capacity for tax collection, and
other factors, besides proper resource management
by the municipality.
Analysis of the reality of local governments in
São Paulo state under the lens of the São Paulo
State Social Responsibility Index (IPRS) shows
groups of municipalities with different combinations
of wealth levels, longevity indicators, and education
indicators (FUNDAÇÃO SEADE, 2005a). The
present study focuses on three groups of
municipalities with discrepancies in wealth levels
and social indicators. One hypothesis raised is that
the criteria for FPM distribution influence the
capacity for social investments of the groups by
being a means of income redistribution.
Based on the premise that larger municipalities
have higher economic output and, consequently,
collect more taxes and are given larger ICMS
transfers, FPM transfers should favor small
municipalities. Thus, the following research
question was established:
Are the mean values of the variables (i) per
capita tax revenue, (ii) per capita ICMS quota, and
(iii) per capita FPM different between groups of
municipalities within the state of São Paulo as
defined by the IPRS?
The aim of this study is to ascertain whether
some of the groups of São Paulo state
municipalities as defined by the IPRS have different
mean per capita values of FPM transfers, ICMS
quotas, and collected tax revenue. Furthermore, we
will attempt to determine the relationship between
these variables as a set and the classification of the
municipalities given by the IPRS.
2.
THEORETICAL BACKGROUND
This section presents the theoretical framework
on which the study is based.
123
Maria Aparecida Gouvêa, Patrícia Siqueira Varela e Milton Carlos Farina
2.1.
Municipalities Participation Fund - FPM
The main feature of the Brazilian experience
concerning the decentralization process was the
lack of coordination, which, in turn, brought
consequences such as an increase in inter- and
intra-regional socio-economical inequalities and
inadequate distribution of fees to the three federal
levels by the Federal Constitution of 1988, which
implies the coexistence of gaps or an overlapping of
functions (AFFONSO, 1996). This was due to the
fact that the decentralization process, which began
in the late 1970s in the context of
redemocratization, was commanded by the states
and, mainly, by the municipalities, not by the
federal government (AFFONSO, 1996).
The Constitution’s lack of definition on the
division of competencies notwithstanding, states
and municipalities ended up taking on new
responsibilities due to an increase in the volume of
available
resources
coming
from
fiscal
decentralization, decreasing federal expenses and
pressure from civil society (AFFONSO, 1996).
According to Abrucio and Couto (1996),
municipalities began to face a double challenge: to
ensure basic social welfare conditions for their
populations (welfare function) and to promote the
economical development based on actions at the
local level, in partnership with civil society
(development function).
To the authors, facing these challenges would
depend on three parameters: the federal fiscal
structure, the socio-economical differences between
the municipalities, and the characteristic political
dynamic of municipal government (ABRUCIO;
COUTO, 1996).
The fiscal decentralization process, which began
in the 1970s, was reinforced by the Federal
Constitution of 1988, having as its main
consequences an increase in the tax-levying power
of subnational unities within their own jurisdictions
and an increase in the availability of nonearmarked resources for municipalities, as a result
of constitutional transfers, including the
Municipalities Participation Fund (FPM) and
participation in ICMS revenue (ABRUCIO;
COUTO, 1996).
Although local governments had increased their
fiscal potential, this process did not occur in a
homogeneous
fashion
among
Brazilian
124
municipalities. Bovo (2001) points out that the main
source of tax for the municipalities are the Tax on
Services Rendered (ISS), the Municipal Real Estate
Tax (IPTU) and the Property Transfer Tax (ITBI),
which are taxes with better collecting potential in
medium-sized and large municipalities, as urban
property and the service sectors in small
municipalities, which are eminently rural, are of
little significance.
“The insufficiency of available redistributive
tools, especially at the municipal level, is an
aggravating circumstance” (ABRUCIO; COUTO,
1996, p. 43). Resources transferred by the Union
and by the states to municipalities should serve as a
device for generating equitable conditions to allow
Brazilian municipalities to face the new social
responsibilities. However, this is not always the
case, as with the ICMS quota, which rewards
economically successful municipalities (ABRUCIO;
COUTO, 1996, p. 44).
Thus, municipal performance in the social area is
highly influenced by the redistributive efficiency or
inefficiency of the Municipality Participation Fund.
The FPM is a constitutional transfer made by the
Union to the municipalities, which comprises 22.5%
of the Tax Revenue (IR) collected and the Tax on
the Industrialized Products (IPI).
The transfer of the resources that make up the
FMP is divided into three parts:
•
10% are distributed to the state capitals
according to coefficients that take into account
the inverse of per capita income and the
population of the State.
•
86.4% are distributed to municipalities in the
countryside, according to coefficients defined by
population brackets in Decree-Law 1881/81.
•
3.6% are destined to the Reserve Municipalities
Participation Fund, which are distributed
between the municipalities in the countryside
with a coefficient of 4.0 until 1998 and 3.8 from
fiscal year 1999 onwards. Reserve resources are
a complement to the values received according to
the prior item, and the distribution occurs
according to the coefficients of the inverse per
capita income and the population of the State.
In all three cases, the participation of each
municipality is given by the division of its
REGE, São Paulo, v. 17, n. 2, p. 121-134, abr./jun. 2010
Evaluation of the Social Economic Indicators of the Municipalities of the São Paulo State Groups 1, 2 and 3
with the Use of Multivariate Analysis of Variance
coefficient by the sum of the coefficients of the
Brazilian municipalities within each group.
According to Section 4, art. 91 of Decree-Law
no. 1881/81, the upper and lower limits of the
population brackets will be readjusted when,
according to census data, the total population of the
country is shown to have had a percentage increase
based on the previous census.
According to Section 1, art. 1 of Complementary
Law 91/97, municipality participation quotas will
be readjusted yearly based on official population
data obtained by the Brazilian Institute of
Geography and Statistics (IBGE). However, Section
2 of the same article establishes that the 1997 FPM
participation coefficients will remain unchanged for
the municipalities which had their coefficients
reduced due to IBGE estimates. The added earnings
resulting from this decision have been gradually
eliminated since 1999, and are expected to be
totally eliminated by 2008.
Abrucio and Couto (1996) view the criteria for
the distribution of the FPM as inefficient, as they
consider the income factor only for larger cities and
state capitals.
In other municipalities, the main criterion for
FPM resource distribution is the size of the
population, with coefficients of participation being
established by population brackets instead of a
specific number, as can be seen in Table 1.
Table 1: Individual FPM Participation Coefficients
Population brackets
(1980)
10,188 or less
10,189 to 13,584
13,585 to 16,980
16,981to 23,772
23,773 to 30,564
30,565 to 37,356
37,357 to 44,148
44,149 to 50,940
50,941 to 61,128
Coefficient
Population brackets
(1980)
61,129 to 71,316
71,317 to 81,504
81,505 to 91,692
91,623 to 101,880
101,881 to 115,464
115,465 to 129,048
129,049 to 142,632
142,632 to 156,216
over 156,216
0.6
0.8
1
1.2
1.4
16
18
20
2.2
Coefficient
2.4
2.6
2.8
3.0
3.2
3.4
3.6
3.8
4.0
Source: Adapted from Decree-Law no. 1881/81, Article 1.
The range of the brackets and the fact that
coefficients do not increase in the same proportion
as the population brackets do is the cause of a large
difference between municipalities if the per capita
FPM is considered, benefiting small municipalities.
Data from the National Treasury Department
(STN, 2007) show that 86 out of 516 São Paulo
state municipalities received the amount of R$
2,176,261.73 in FPM transfers in 2004. Of these 86
municipalities, the smallest one (Nova Castilho),
with a population of 1020, received an annual per
capita FPM of R$ 2. The largest municipality,
Valentim Gentil, with a population of 9,990,
received an annual per capita FPM of R$ 217.84.
The same FPM amount is given to municipalities
with very different population sizes, but within the
same population bracket. These disparities occur
for all values of FPM revenue within the various
brackets.
REGE, São Paulo, v. 17, n. 2, p. 121-134, abr./jun. 2010
Apart from the city of São Paulo, the municipality
of Osasco was given the highest amount of total
FPM, R$ 28,212,304.42; concerning the per capita
distribution, it was given one of the lowest amounts,
R$ 40.54, because the amount from the FPM does
not increase in the same proportion of the
population.
There is a tendency for larger municipalities to
receive lower per capita FPM transfers. There are
also differences in the fiscal capacity of the
municipalities and in the management of the
benefits coming from the distribution of the ICMS
quota.
2.2.
São Paulo State Social Responsibility Index
In the public sector, several initiatives and
experiences in the use of social indicators can be
observed. The best known is from the United
Nations (UN), which, during the 1990s, created the
Human Development Index (HDI), introducing in
125
Maria Aparecida Gouvêa, Patrícia Siqueira Varela e Milton Carlos Farina
its conception the variables of longevity and
education, as well as income, to compare national
development.
Other experiences have appeared since the
creation of the HDI, as is the case of the São Paulo
State Social Responsibility Index (IPRS). This index
was constructed by the State Data Analysis System
Foundation (SEADE), a São Paulo state
government organization, in response to a request
from the leaders and counselors of the Forum São
Paulo – Século XXI for the construction of indices
that would allow the continuous detection of
progress – or not – of the development of the São
Paulo state municipalities towards a much-desired
society widely discussed in the Forum.
The objective of the IPRS is the classification of
São Paulo state municipalities regarding the quality
of life of their inhabitants. In order to achieve this,
the three dimensions within the HDI (income,
longevity and education) were taken into account,
although using other variables more appropriate to
the municipal reality. The initial idea was to use
indicators which could evaluate not only the results
of the efforts made by the public power in favor of
local-level development, but the level of
participation and control of the civil society over
those actions as well.
To obtain this index, São Paulo state
municipalities were classified by cluster analysis
into groups with similar features of wealth,
longevity and education, and named as follows: (1)
hub municipalities, (2) economically dynamic and
low social development, (3) healthy and low
economic development, (4) low economical
development and undergoing social transition, and
(5) low economic and social development.
The variables considered in each of the IPRS
dimensions and the corresponding weighting
structure are summarized in Table 2.
Table 2: Summary of selected variables and weighting structure
Dimension
Municipal wealth
Longevity
Education
Selected variables
Residential power consumption
Power consumption in the agriculture, commerce, and
service sector
Mean compensation of registered and public sector
employees
Per capita fiscal added value
Perinatal mortality
Child mortality
Mortality in the 15-to-39-year age bracket
Mortality among those 60 years or older
Percentage of youths 15 to 17 years old who graduated
elementary school
Percentage of youths 15 to 17 years old with at least four
years’ formal education
Percentage of youths 18 to 19 years old who graduated
secondary school
Percentage of children 5 to 6 years old who attend
preschool
Contribution towards
indicator
44%
23%
19%
14%
30%
30%
20%
20%
36%
8%
36%
20%
Source: FUNDAÇÃO SEADE, 2005b.
The synthetic indicator of each dimension is the
result of the combination of the variables, and the
weight of each variable in combination was
obtained through factor analysis. To make
comparison between the municipalities easy, the
indicator was turned into a scale from 0 to 100.
126
SEADE Foundation synthesized the indicators of
municipal wealth, longevity and education into a
categorical scale, which express the “general
pattern” of the created groups. The synthesis of the
criteria for the creation of the groups of
municipalities by the IPRS is described in Table 3.
REGE, São Paulo, v. 17, n. 2, p. 121-134, abr./jun. 2010
Evaluation of the Social Economic Indicators of the Municipalities of the São Paulo State Groups 1, 2 and 3
with the Use of Multivariate Analysis of Variance
Table 3: IPRS group formation criteria
Groups
Group 1
Group 2
Group 3
Group 4
Group 5
IPRS group formation criteria
High wealth, high longevity, medium education
High wealth, high longevity, high education
High wealth, medium longevity, medium education
High wealth, medium longevity, high education
High wealth, low longevity, low education
High wealth, low longevity, medium education
High wealth, low longevity, high education
High wealth, medium longevity, low education
High wealth, high longevity, low education
Low wealth, high longevity, medium education
Low wealth, high longevity, high education
Low wealth, medium longevity, medium education
Low wealth, medium longevity, high education
Low wealth, low longevity, medium education
Low wealth, low longevity, high education
Low wealth, low longevity, medium education
Low wealth, high longevity, low education
Low wealth, low longevity, low education
Description
High wealth level and
good social indicator
levels
High wealth levels, but
unable to reach good
social indicator levels
Low wealth level, but
good social indicator
levels
Low wealth levels and
medium longevity and/or
education indicators
Financially and socially
disadvantaged
Source: FUNDAÇÃO SEADE, 2005b.
Table 3 shows different combinations of
municipal levels of wealth and social indicators.
Three groups stand out: group 1 for its high level of
municipal wealth and good social indicators; group
2 for high levels of wealth and average or low levels
of social indicators; and group 3, despite its low
level of wealth, shows good performance in the
social context.
Group 1 is made up of large São Paulo state
municipalities and important regional hubs located
along the main highway axes of the state, and in
2002 was home to 50% of the state population
(nearly 19 million people). Group 2, with a
population of more than 10 million, contains
municipalities located mainly in the metropolitan
areas and their surroundings, and are
characterized by industrial activities, gated
communities, and potential for tourism. Group 3
comprised 201 small and medium municipalities
with an estimated population of 3 million in 2002.
The small size of the population in group 3 is,
theoretically, a factor which should make the tools
of decentralization in health and education more
transparent and efficient.
Therefore, the question arises of whether
government transfers, especially the FPM, influence
the capacity of the municipalities, in the three
groups, of making social investments. However, it is
REGE, São Paulo, v. 17, n. 2, p. 121-134, abr./jun. 2010
important to emphasize that social indicator
patterns are not dependant exclusively on funding
conditions. Quality of spending and environmental
factors, such as the seasonality of the population of
tourist destinations, are determinant factors of
public policy performance as well.
3.
METHODS
The following section describes the methods of
this study.
3.1.
Population
The target population concerns the capital and
the São Paulo state countryside municipalities
belonging to groups 1, 2, and 3. The particularities
of groups 1, 2 and 3 suggest the possibility of a
distinct distribution of the FPM, ICMS quota and
tax revenue. This led to an interest in the analysis of
these three groups.
3.2.
Data collection
Data were collected on four variables: FPM,
ICMS quota, Tax revenue, and IPRS municipality
groups.
Data were obtained from two sources: 2002
SEADE Foundation website data (2005b) on all São
127
Maria Aparecida Gouvêa, Patrícia Siqueira Varela e Milton Carlos Farina
Paulo state municipalities, that is, all 645
municipalities of the state; and 2007 National
Treasury Department data on 518 São Paulo state
municipalities.
3.3.
Prior treatment of data
To confirm the significance of the per capita tax
revenue values of the three groups studied, the
multivariate analysis of variance technique was
employed.
The independent variable is named iprs, which
identifies the municipalities from groups 1, 2, and 3
of the IPRS, and the dependant variables are the
per capita values of FPM transfers, ICMS quota
and tax revenue.
Some premises inherent to the multivariate
analysis of variance must be checked. Such
suppositions can be summarized into: (1) absence
of outliers, (2) normality of the dependent variables,
(3) absence of multicollinearity between the
dependent variables, and (4) equality of variance
and covariance matrices.
The following section presents an investigation of
missing data and our verification of these
suppositions.
3.3.1. Treatment of missing data
Regarding missing data, we must focus on the
reasons which led to their being missing in the first
place (HAIR JR. et al., 2006, p. 49). There were no
National Treasury Department data on all 645 São
Paulo State municipalities, only on 518. According
to Hair Jr. et al. (2006), the simplest and more
straightforward approach is to include only
complete data observations in the study, which was
our chosen approach.
3.3.2. Treatment of outliers
Of the 518 municipalities, two had wrong data,
with excessively discrepant FPM values (Bento de
Abreu and Ouroeste), suggesting errors in the data
available on the National Treasury Department
website (STN, 2007). Therefore, treatment of
outliers was made on the 516 remaining
municipalities. The advantage of analyzing the
whole set is that in this way the variables from
public revenues of each municipality are compared
128
to the observations on all São Paulo state
municipalities, as the IPRS classification covers the
whole state.
The disadvantage lies in the fact that if the
analysis was made in respect of groups 1, 2, and 3,
there would be fewer outliers. This restrictive
treatment, however, could raise doubts concerning
its legitimacy in the use of multivariate techniques.
The chosen detection method for outliers was the
Mahalanobis distance, which is recommended in
the multivariate context (HAIR JR. et al., 2006). For
the simultaneous focus on the three variables of per
capita public revenues in this study, a centroid was
calculated and the Mahalanobis distance of each
municipality in relation to this centroid. Each
distance is then compared to a critical value
obtained in the Student’s t distribution. The
municipalities of Paulínia, Águas de São Pedro and
São Paulo were considered outliers, as their
distances exceeded this critical value. After the
treatment of missing data and outliers, the total
sample was narrowed down to 513 municipalities.
Group 1 has 61 municipalities, group 2 has 70
municipalities and group 3, 154 municipalities, for
a total of 285 municipalities in the three groups.
The three variables for per capita public revenue
were also standardized using the Z–scores method.
3.3.3. Normal Distribution
For the standardized per capita dependent
variables subjected to the normal logarithm, a nonparametric Kolmogorov-Smirnov goodness-of-fit
test was applied. A transformation to the natural
logarithm was necessary to obtain better fit to the
normal distribution. The per capita FPM, ICMS
and tax revenue variables obtained the following
significance levels: 0.156, 0.523, and 0.294
respectively, which reinforces the goodness of fit to
the normal curve of the 3 variables. The notations
fpmt, icmst and rect that were used from this section
on correspond to the per capita variables
standardized and subjected to the natural
logarithm.
3.3.4. Multicollinearity
We will first check the correlation between the
pairs of variables on Table 4:
REGE, São Paulo, v. 17, n. 2, p. 121-134, abr./jun. 2010
Evaluation of the Social Economic Indicators of the Municipalities of the São Paulo State Groups 1, 2 and 3
with the Use of Multivariate Analysis of Variance
Table 4: Group correlation matrix
fpmt
1.000
0.386
-0.631
fpmt
icmst
rect
icmst
0.386
1.000
-0.167
rect
-0.631
-0.167
1.000
Source: Authors.
economically successful municipalities, although
this correlation is not very high in modulo (-0.167).
The correlations which can be considered
significant in modulo are fpmt with icmst (0.386)
and rect with fpmt (-0.631). The results show that
federal resources (fpmt) and state resources (icnst)
are positively correlated, that is, municipalities
which receive more resources from the Union also
receive more resources from the state and viceversa. However, municipalities with more municipal
resources (rect) receive fewer federal resources
(fpmt).
The use of multivariate analysis of variants
(MANOVA) presumes that the dependent variables
are correlated. Thus, a certain level of
multicollinearity between them is desired. Bartlett’s
test and the Roy-Bargman stepdown F-test were
used in the evaluation of intensity of
multicollinearity. Table 5 presents the results of
Bartlett’s test.
The negative correlation between icmst and rect
indicates that state resources (icmst) do not reward
Table 5: Bartlett’s sphericity test
Degrees of
freedom
5
Chi-square
131.989
Descriptive level
0.000
Source: Authors.
Table 5 shows rejection of hypothesis that the
correlation matrix of the three variables presented
in Table 4 is equal to the identity matrix. Thus, the
use of MANOVA is justified.
Table 6 presents the results of the Roy-Bargman
stepdown F - test.
Table 6: Roy-Bargman stepdown F-test
Variables
fpmt
icmst
rect
Mean square
between groups
64.108
18.203
12.742
Mean square
within groups
0.688
0.734
0.513
Stepdown F
93.232
24.802
24.845
G. L.
Between
2
2
2
G. L.
Within
282
281
280
Stepdown F
significance
0.000
0.000
0.000
Source: Authors.
Table 6 shows that, for each variable, the
hypothesis that its mean is the same in the three
groups is rejected when the other variables are
included. So, each of the three dependent variables
has features that distinguish groups 1, 2 and 3.
Therefore, the intercorrelation between the three
variables does not characterize a high level of
multicollinearity, supporting the use of MANOVA.
REGE, São Paulo, v. 17, n. 2, p. 121-134, abr./jun. 2010
3.3.5. Variance and Covariance Matrix Equality
According to Table 7, Box’s M test presented a
significance of 0.040 – that is, the null hypothesis is
rejected, considering the 0.05 level, but not
strongly. The expectation in this test is the nonrejection of the null hypothesis, which states the
equality of the three groups' covariance matrices.
Authors such as Hair et al. (2006, p. 409) clarify
that this test is extremely sensitive to sample
129
Maria Aparecida Gouvêa, Patrícia Siqueira Varela e Milton Carlos Farina
correct application of the technique. Thus, the
result of this test does not negate the use of
MANOVA.
fluctuation and size. When the result practically
straddles the border between hypothesis acceptance
and rejection, the authors believe that the study did
not stray far from the supposition established for
Table 7: Results of Box’s M test
Box’s M
Approximate F
df1
df2
Significance
9.707
1.701
12
156466
0.040
Source: Authors.
To test the hypothesis that the variance of each
variable was homogeneous across all three groups,
we used Levene’s test. Table 8 shows that variances
may be considered equal only with significance
levels that are more restrictive (lower than 1.3%).
Table 8: Levene’s test
Levene test
F
Sig.
3.834
0.023
3.192
0.043
5.986
0.013
fpmt
icmst
rect
Source: Authors.
Therefore, generally speaking, all premises for
application of MANOVA were met.
4.
This section will show some univariate and
multivariate statistics.
4.1.
ANALYSIS OF RESULTS
Descriptive statistics
This section will show some univariate statistics.
The core MANOVA question is as follows: do
variables fpmt, icmst, and rect, considered
simultaneously, have different means in groups 1, 2,
and 3?
Table 9 below shows the descriptive statistics
relative to means and standard deviations in each
group.
Table 9: Descriptive Statistics
Group 1
Group 2
Group 3
Variables
fpmt
icmst
rect
fpmt
icmst
rect
fpmt
icmst
rect
Mean
-0.8290
0.4726
0.8253
-0.9818
-0.2891
1.1015
0.4312
0.1243
-0.2913
SD
0.9346
0.9788
0.7878
0.7324
1.1807
0.9404
0.8264
0.8568
0.6774
Source: Authors.
The negative means of the fpmt variable in
groups 1 and 2 suggest that lower values of this
revenue
were
transferred
to
wealthier
130
municipalities. Wealth is proved by the positive
means of rect. The opposite is found with means in
group
3,
which
comprises
low-wealth
REGE, São Paulo, v. 17, n. 2, p. 121-134, abr./jun. 2010
Evaluation of the Social Economic Indicators of the Municipalities of the São Paulo State Groups 1, 2 and 3
with the Use of Multivariate Analysis of Variance
4.2.
municipalities, that is, it showed a positive fpmt
mean and a negative rect mean.
Multivariate analysis
4.2.1. Variable mapping
Notably, standard deviation values were very
high, showing great heterogeneity within each
group.
Seeking to visualize the relationship between the
variables and the three groups, we created two
ranges for each variable and conducted multiple
correspondence analysis. Creation of these ranges
made the variables non-metric, a requirement for
the use of this technique. Chart 1 shows this
relationship.
Chart 1: IPRS and public revenues
1,0
iprs2
icms1
,5
iprs3
rect1
fpm1
0,0
fpm2
rect2
-,5
icms2
Dimensião 2
-1,0
iprs1
-1,5
-2,0
-1,5
-1,0
-,5
0,0
,5
1,0
Dimensão1
Source: Authors.
Suffixes 1 and 2 correspond to ranges 1 and 2,
with code 2 corresponding to the highest values of
each variable. For iprs, groups 1 and 2 had the
highest rect and lowest fpmt values – the opposite of
group 3. This chart suggests that the variables,
when considered simultaneously, have the power to
distinguish the three study groups.
[ ] [ ][ ]
µ fpmt
1
µ fpmt
2
µ fpmt
1
µ rect
2
µ rect
The test’s statistical hypothesis (H0) corresponds
to the equality of the vector of the means of the
three dependent variables along the three groups
(independent variable).
3
H 0 : µicmst = µicmst ¿ µicmst
1
2
3
µ rect
4.2.2. Multivariate test for equality of means
versus
H 1 :at least one t group with mean≠
3
REGE, São Paulo, v. 17, n. 2, p. 121-134, abr./jun. 2010
131
Maria Aparecida Gouvêa, Patrícia Siqueira Varela e Milton Carlos Farina
Table 10 shows the results of the multivariate test
for equality of means.
Table 10: Multivariate test
Test
Pillai’s criterion
Wilks’ lambda
Hotelling trace
Roy’s largest root
Value
0.608
0.435
1.203
1.114
F
40.942
48.254
55.926
104.364
G. L.
Entre
6
6
6
3
G. L.
Dentro
562
560
558
281
F significance
0.000
0.000
0.000
0.000
Effect size
0.304
0.341
0.376
0.527
Power
1.00
1.00
1.00
1.00
Source: Authors.
Table 10 contains the four multivariate tests most
used in MANOVA. The results of each test point to
rejection of the null hypothesis, that is, public
revenues, when considered as a set, show a highly
statistically significant difference among the three
groups of municipalities studied.
The statistical power obtained for each test was
1.00, showing that group sizes and group effect
sizes on dependent variables were sufficient to
ensure that the statistical differences detected were
effective.
After concluding that the three public revenue
variables differed as a set in all three groups
studied, we examined each variable separately to
assess its distinguishing value for each group. To
test the equality of means for each variable in the
three groups, we used the F test, available in
MANOVA, the statistic of which is the same as that
obtained in univariate ANOVA. As shown in Table
11, we found that means could be considered
different with a significance level of 0.05.
Table 11: F test
F test
F
Sig.
93.232
0.000
10.155
0.000
96.771
0.000
fpmt
icmst
rect
Source: Authors.
The highest value for the F-test statistic was
found for variable rect. Thus, rect is the variable
most able to distinguish the three groups, followed
closely by the fpmt variable.
Table 12 below shows the group that most differs
from the others for each dependent variable,
according to Scheffé’s post-hoc test for multiple
comparisons, performed due to rejection of the null
hypothesis in all three study groups.
Table 12: Descriptive statistics
Group 1
fpmt
icmst
rect
Group 2
Group 3
X
X
X
Source: Authors.
“X” marks the group whose mean is statistically
different from the means of the other two groups for
each public revenue variable.
132
In group 3, the highest FPM transfers were
consistent with what is expected for making funding
conditions for this group more equitable as
compared to those of the two other groups.
REGE, São Paulo, v. 17, n. 2, p. 121-134, abr./jun. 2010
Evaluation of the Social Economic Indicators of the Municipalities of the São Paulo State Groups 1, 2 and 3
with the Use of Multivariate Analysis of Variance
5.
CONCLUSIONS
Our interest in comparing the revenues of
specific groups of municipalities in the state of São
Paulo arose from the existence of different
economic and social levels, which led to the
question of whether government transfers –
particularly FPM transfers – are contributing to the
generation of equitable conditions for spending on
public services.
The volume of resources available at the local
level for use in socioeconomic projects depends on
the fiscal capacity of each municipality and on
existing mechanisms for the redistribution of
resources. Given the greater capacity of larger
municipalities to collect revenue independently at
the municipal level, due to the characteristics of
municipal taxes, criteria for municipal participation
towards federal and state revenues are expected to
be effective in terms of revenue redistribution.
However, as our theoretical review and analysis of
empirical data showed, this is not always the case.
Mean per capita public revenues were different
across groups 1, 2, and 3.The former had higher
per capita tax revenues and lower per capita FPM
values.
Analysis of the relationship between variables
showed that the greater the fiscal capacity of a
municipality, the lower its per capita FPM revenue
and the higher its per capita tax revenue will be.
Testing for equality of means showed that the per
capita tax revenue variable was most capable of
distinguishing among the three groups of
municipalities.
We may also say that, in the three groups studied,
FPM distribution criteria are contributing towards
the effective use of available revenues.
FPM criteria contribute towards the treatment of
horizontal inequalities, that is, the generation of
equitable conditions for municipalities to promote
social welfare within their communities. However,
this will depend on their capacity to turn available
public resources into public goods adapted to the
needs of the population – which is considered one
of the greatest advantages of decentralized systems
– and on how each municipality carries out its
distributive functions. It is important to stress that
reducing inequality between municipalities does not
REGE, São Paulo, v. 17, n. 2, p. 121-134, abr./jun. 2010
necessarily imply solving the issue
socioeconomic disparities among their citizens.
of
The poor performance of group 2 in terms of
social indicators when compared to groups 1 and 3
cannot be justified merely by the findings of this
study. Other variables must also be considered,
such as whether the municipality is a tourist
destination, whether the municipality is a bedroom
community, its internal inequalities, and the quality
of public spending. In fact, environmental factors
and public spending should be considered in the
assessment of public policy results, but this falls
beyond the scope of this study.
We cannot state that these results are reproduced
in other groups of municipalities in the state of São
Paulo or even other municipalities in Brazil, and
thus recommend that this analysis be repeated for
other select groups of municipalities.
Another suggestion involves the classification of
municipalities by the SEADE Foundation. It may be
interesting to include not only wealth-generating
capacity as a criterion for grouping municipalities,
but also the availability of resources for public
policies.
6.
REFERENCES
ABRUCIO, F. L.; COUTO, C. G. A redefinição do
papel do Estado no âmbito local. São Paulo em
Perspectiva, São Paulo, v. 10, n. 3, p. 40-47, jul.set. 1996.
AFFONSO, R. Os municípios e os desafios da
federação no Brasil. São Paulo em Perspectiva, São
Paulo, v. 10, n. 3, p. 3-10, jul.-set. 1996.
BOVO, J. M. Gastos sociais dos municípios e
desequilíbrio financeiro. Revista de Administração
Pública, Rio de Janeiro, v. 35, n. 1, p. 93-117, jan.fev. 2001.
BRASIL. Constituição (1988). Constituição da
República Federativa do Brasil. 21. ed. São Paulo:
Saraiva, 2001. (Coleção Saraiva de Legislação).
______. Decreto-Lei nº 1.881 de 27 de agosto de
1981. Available at: <http://www.senado.gov.br>.
Retrieved on: 20 Jan. 2005.
133
Maria Aparecida Gouvêa, Patrícia Siqueira Varela e Milton Carlos Farina
______. Lei Complementar nº 91 de 22 de
dezembro
de
1997.
Available
at:
<http://www.senado.gov.br>. Retrieved on: 20 Jan.
2005.
FUNDAÇÃO SEADE. Índice Paulista de
Responsabilidade Social: metodologia. Available
at:
<http://www.seade.gov.br/produtos/iprs/pdf/
metodologia.pdf>. Retrieved on: 20 Jan. 2005a.
______. Índice Paulista de Responsabilidade
Social:
consulta.
Available
at:
<http://www.al.sp.gov.br/web/forum/iprs03/index_i
prs.htm>. Retrieved on: 20 Jan. 2005b.
HAIR JR., J. F.; TATHAM, R. L.; ANDERSON, R.
E.; BLACK, W. Multivariate data analysis. 6th ed.
New Jersey: Prentice Hall, 2006.
OSZLAK, O. Estado e Sociedade: novas regras de
jogo? In: FELICÍSSIMO, JR. et al. (Coords.)
Sociedade e Estado: superando fronteiras. São
Paulo: FUNDAP, 1998.
SECRETARIA DO TESOURO NACIONAL
(STN). Estados e municípios. Available at:
<http://www.stn.fazenda.gov.br/estados_municipios
/index.asp>. Retrieved on: 25 Feb. 2007.
134
REGE, São Paulo, v. 17, n. 2, p. 121-134, abr./jun. 2010
Baixar