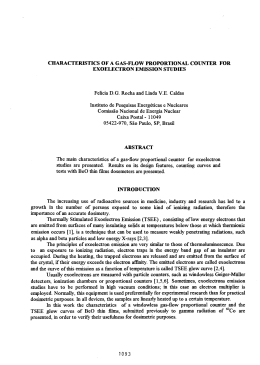
POWER QUALITY INDICES ASSESSMENTS ON THE TRANSMISSION
NETWORK IN THE NORTHEAST OF BRAZIL
José Júlio LINS LEITÃO
CHESF – Federal Power Utility
Recife, Brazil
Iony PATRIOTA DE SIQUEIRA
CHESF – Federal Power Utility
Recife, Brazil
Abstract - The characteristics of the voltage sags
are important in determining how extensive the
impact of the event extension is on various
consumer operations. It is important to
remember that the end user equipment will
have widely varying degrees of sensitivity,
depending mainly upon the magnitude and
duration of the event. The propose of this paper
is to provide information that can be used to
establish the limit of performance indices of the
Transmission System in the Northeast of Brazil,
based on historical data. Example sag data are
shown in several points of connection of the
transmission grid. The survey results provide a
knowledge base for monitoring, designing and
utilizing voltage sags mitigating technologies.
1. INTRODUCTION
There is no doubt about the Brazilian position in
the industrialized world, however it is lacking
conditions that will ensure the competitiveness of
its products, which certainly includes the
availability of electricity of high quality. Power
quality is increasingly becoming an issue to the
final consumer. It is possible to verify the concerns
expressed by the Brazilian National Energy and
Electricity Regulatory Agency – ANEEL – and
other actors controlled by them, i.e. the utilities.
The new Brazilian power system configuration is
divided into the following sectors: generation,
transmission,
distribution
and
energy
commercialization. In this new configuration, it is
imperative that the performance indices (Power
Quality Indices) should be assessed by all sectors
Milde Maria da SILVA LIRA
UFPE – Federal University of Pernambuco
Recife, Brazil
Paulo RIBEIRO
Calvin College
Grand Rapids, Michigan
and agents in a so called "condominium" (shared
responsibility) model.
The drastic economic impact caused by the short
duration voltage variations (VTCD) has been
evidenced in several recent works [1, 2]. The
VTCD is mainly caused by short-circuits in the
transmission lines, which, some times, can impact
great areas of the power system, even if the faulted
area is quickly isolated by the respective
protection scheme.
In the sense of creating the necessary regulatory
instruments, the ANEEL has issued the Resolution
#24 from January 2000 that establishes some
power quality indices that must be observed. This
resolution also delegates to the National Power
System Operator – ONS – the attribution of
establishing the performance standards (limits) to
the Basic Network (above 230kV) that must be
monitored in some control points (point of
common coupling with distribution and generation
companies, special consumers and international
interconnections), as established in the National
Grid Code [3].
In the past few years, particularly CIGRÉ, IEC and
IEEE have proposed a great number of patterns for
describing and measuring the power quality
indices.
CHESF, Federal Power Utility, has a transmission
system with more than 17 thousand kilometers of
transmission lines at 500, 230, 138 and 69 kV
located in the northeast of Brazil; transmitting
energy from generation to the utility power
distribution of each state and to the industrial
consumers connected to the Basic Grid. The
transmissions system of CHESF is monitored by a
net constituted recently for approximately 100
Digital Fault Recorder (DFR) interconnected to a
server, through TCP/IP protocol.
This paper presents the following main
contributions: methodology to analyze the data
collected by monitoring systems installed in points
of connection of the transmission system in the
Northeast of Brazil (using historical data); the use
of the historical data to establish the performance
of the system bus.
The paper’s organization is as follows. The
propagation through the entire CHESF Power
System of voltage sags collected in a specific
power quality monitor in 2004 is shown in section
2. Section 3 presents two cases studies involving
two faults thatoccurred in the transmission and
distribution system. The performance indices in
Mussuré substation are given in section 4, and the
conclusions of this approach are included in
section 5.
Mussuré II, in the state of Paraíba, whose data
have been collected from MRD-04T3 (230kV) and
MRD-04T2 (69kV) sites, located in the primary
and secondary side of a transformer, respectively.
MRD-04T2 registered 90 voltage sags in 2004,
which were divided into 63 voltage sags of
severity 0 (zero); 16 of severity 1; 4 of severity 2
and 7 of severity 3. The pie chart of Fig. 2 shows
the origin of these voltage sags in percentage.
2. PROPAGATION OF THE EVENTS
BETWEEN MRD-230 kV AND MRD-69 kV
FIGURE 2. Origin of the voltage sags registered at
MRD-69kV in 2004
In order to evaluate the severity of the VTCD, the
Electric Studies Division of CHESF defined the
degrees of severity on a scale of 0 to 4 (Fig.1),
characterized by magnitude and duration of the
voltage sag, and sensibility required by the loads
connected to the respective bus. The time
aggregation for the presentation of summary
results, and a one-minute “sliding window” was
used to aggregate events. For events less than 10%
retained voltage, the abbreviations IMT and ITT
mean Momentary and Temporary Voltage
Interruptions, respectively [3].
Table 1 shows the voltage sags (percentage of the
nominal) and their duration monitored on MRD69kV and MRD-230kV sites, whose severities
were above 2. An examination of this table clearly
reveals that if the fault occurs at the distribution
system the magnitude of the voltage sag at the
69kV level is smaller than the one at the 230kV.
However, if the fault occurs at CHESF
(transmission system) the magnitude of the voltage
sag is smaller at the 230kV level then the one at
the 69kV. With the purpose of seeing how these
events extend geographically on the transmission
system of CHESF, we analysed the 14 Industrial
Consumers and the eight main cities of the
Northeast of Brazil.
Severity 0
0,9
Severity 0
0,8
Severity 1
Severity 2
Severity 2
Severity 3
Not
Identified
9%
CHESF
23%
distribution
System
68%
Severity 1
0,7
Severity 1
0,6
TABLE 1.Events with severity above 2 in 2004
Severity 2
0,5
Severity 3
Severity 2
0,4
Date and time
Severity 3
0,3
Severity 3
0,2
Severity 5
0,1
0 1cycle
300ms
Severity 4
2004-set-27 10:37:47 2.00000
51.7
1.90000
55.2
3
Chesf
2004-nov-19 10:52:37 0.80000
57.6
0.70000
62.2
2
Chesf
2004-nov-24 14:28:24 0.43333
68.7
0.40000
59.0
2
Dist.
Severity 6 ITT
2004-jan-04 10:54:36 0.66667
55.6
0.66667
32.9
3
Dist.
1min
2004-mai-19 14:31:05 1.50000
64.7
1.83333
42.8
3
Dist.
2004-jun-21 16:38:53 0.60000
59.2
0.63333
35.2
3
Dist.
2004-jun-30 06:48:34 1.13333
57.9
1.13333
35.1
3
Dist.
2004-dez-10 00:34:15 0.30000
68.5
0.90000
36.5
3
Dist.
2004-dez-25 03:47:27 2.03333
68.4
2.06667
37,1
3
Dist.
Severity 4
Severity 4
IMT
500ms
MRD_04T3
MRD_04T2 (69kV)
(230kV)
Duration V_MIN Duration V_MIN
Severity Origin
(s)
(%)
(s)
(%)
3s
FIGURE 1. Degrees of severity
To analyse the propagation of the events that
occured in the transmission system from 230 kV to
69 kV and vice versa, we will use the records
collected from January to December 2004 in
The results have shown that the faults occured at
the distribution system, in spite of presenting a
voltage sag of severity 3, the sags were seen at the
most by four monitor nodes. On the other hand, the
faults originating at CHESF with a voltage sag of
severity 2 were felt over all the Industrial
Consumers (I.C.) and main cities, such as:
Aracaju, Fortaleza, João Pessoa, Maceió,
Salvador, Natal, Recife and Teresina (this one
more than 1000 Km far from MRD substation).
We can see from what has been shown, that if the
fault occurs at the distribution system the number
of circuits affected is limited. However, if the faut
occurs at the transmission system, the number of
circuits seeing the voltage sag could be very large
and could geographically extend anywhere from a
few square kilometers to hundreds of square
kilometers. This area is called the zone of
influence.
3. CASE STUDIES
In this section, we are going to study two cases of
faults, one localized at transmission system and
another at distribution system. Our aim is to
analyse the severity of the voltage sag overall the
electric power system of CHESF (Fig. 3) and the
zone of influence. The arrows 1 and 2 in the Fig. 3
show the local of the event in case II, and I
respectively.
CASE I:
This event happened on 19/11/04 at 10:52 in the
centre-subsystem of CHESF stemming from an
automatic breaker opening of busbar (500kV)
in the substation LGZ (Luiz Gonzaga). Cause:
explosion of the 75B2-B/LGZ-surge arrester.
Tab. 2 shows the magnitude and duration of the
voltage sag, voltage level of the measured point
and its geographical location at the transmission
system of CHESF.
The monitoring locations were selected in order to
reach all the voltage level and a vast geographical
area of the transmission system of CHESF. It is
worth to mention that the lowest voltage sag was
measured in MLG_04T5, which presented a
magnitude equal to 39.5% of the nominal voltage.
The substation of Milagre is localized in the North
subsystem of CHESF and is fed by a power line 05V1_LGZ-MLG of 500kV- coming from Luiz
Gonzaga's substation where the event occurred.
This is the main reason of such critical voltage sag.
From the eight DFRs at the 500kV system, two of
them didn’t feel the effect of this event: e.g.
PAQ_05C1 and CMD_05T3. The hydroelectric
power station of Paulo Afonso turned its busbar
into a very strong one, and in spite of the line
05C1_PAQ-LGZ connecting both substations, the
DFR monitoring the line PAQ_05C1 didn’t feel
the event that occurred in Luiz Gonzaga. The DFR
in CMD_05T3 measuring the voltage sags in the
autotransformer (600MVA) didn’t see this event,
probably due to one line of this substation being
interconnected with the substation of PAQ (a
power generation station).
TABLE 2 . Measurement of the selected site that
were sensitized to the event of Case I
Site
Name
Voltage
level
(kV)
Subsystem
Cities
or I.C.
52.4
FTZ_04T2
69
NORTH
Fortaleza
54.3
NTD_02J4
69
EAST
Natal
54.4
MTT_04T3
69
SOUTH
Salvador
62.2
MRD_04T2
69
EAST
João Pessoa
63.0
BGI-04T4
69
EAST
Recife
65.5
JDM-04T2
69
SOUTH
Aracaju
0.56667
69.3
RLD_04T3
69
EAST
Maceió
3.03333
70.9
TSA_04T4
69
WEST
Terezina
0.03333
89.1
ENP_04T1
138
SOUTH
-
2.23333
44.4
BNO_03C2
138
CENTER
-
2.73333
52.0
FTZ_04Z4
230
NORTH
I.C.
0.66667
56.5
JCR_04N3
230
SOUTH
I.C.
0.56667
59.5
RLD_04S2
230
EAST
I.C.
2.86667
39.5
MLG_04T5
230
NORTH
-
0.50000
55.5
USB_05T4
500
SOUTHWEST
-
2.03333
77.7
TSD_05C8
500
WEST
-
0.53333
60.9
MSI_05V4
500
EAST
-
0.50000
65.7
UXG_05V6
500
CENTER
-
Duration
(s)
Sag
(%)
2.86667
1.46667
0.76667
0.70000
2.83333
0.60000
From the three sites in the 138kV system, the
critical voltage sag happened in the DFR located in
BNO_03C2 (centre-subsystem of CHESF), which
is close to the event, as shown in Tab. 2. In spite of
the DFR in FNL-04T2 being closer to the
occurrence of the event than the DFR in ENP04T1, it registered a soft voltage sag of 89%, while
the other didn't present any voltage sag on that day
and hour. The probable cause of this scenario is
the attenuated voltage sag in South area of the
system and the hydroelectric generator of 30MW
in this substation.
All the Industrial Consumers (I.C.) and all main
cities of the Northeast felt a voltage sag stemmed
from this event, the magnitude depending on its
proximity to the place of occurrence and on the
short-circuit level of the substation busbar where
such DFRs are located, as shown in Tab. 2.
Fig. 4 shows the rms of the worst voltage sag
waveform in 69, 138, 230 and 500 kV related to
the Case I.
CHESF
CHESF
POWER
SYSTEM
Sistema Elétrico
SÃO LUIS
PARÁ
NORTH
Sobral
FORTALEZA
MARANHÃO
Piripiri
Araras
SE C. Neto
(Eletronorte)
CE
Russas
Teresina
Banabuiu
CEARÁ
TERESINA
SE P. Dutra
(Eletronorte)
Fortaleza
Delmiro
Gouveia
Mossoró
WEST
Açu
R. G. DO
NORTE
Icó
Picos
NATAL
S.do Matos
C.Novos
Boa Esperança
Coremas
Mussuré II2
Mussuré
C. Grande
CE
Milagre
Milagres
Natal
S. Cruz
PARAÍBA
CE
C. Buriti
Bom Nome
Ta ca imb ó
Luiz
Luiz
Gonzaga
Gonzaga
PERNAMBUCO
PIAUÍ
o
Sã
sco
a nci
Fr
Sobradinho
Sobradinho
1
P. Afonso
Juazeiro
MACEIÓ
SERGIPE
Itabaiana
D. Olindina
ARACAJU
Jardim
Itabaianinha
Olindina
Catu
Jacaracanga
Cotegipe
BAHIA
Rio Largo
ALAGOAS
Gov.Mangabeira
GOIÁS
Ribeirão
Messias
Xingó
Cícero
Dantas
Senhor do
Bonfim
Irecê
Bongi
Recife II
Pirapama
Angelim
Penedo
Jaguarari
RECIFE
Mirueira
Bom Nome
io
R
EAS
T
Goianinha
S. João do Piauí
E. Martins
J. PESSOA
Camaçari
Pituaçu
S. A. Jesus
SALVADOR
Barreiras
LT 500kV
Bom J. da Lapa
LT 230kV op. 69kV
LT 230kV
Rio das Contas
LT 138kV
CE
Pedra
Capital
Funil
Subestação
SOUTH
MINAS GERAIS
CE
Usina Hidroelétrica
Compensador Estático
DOEL - Divisão de Estudos da Operação Elétrica
Eunápolis
FIGURE 3. CHESF Power System
RMS Voltages during the sag of CASE I
1,2
1,1
Voltage sag (pu)
1
electric system of CHESF. The measurements of
all DFR in all Industrial Consumers, in the main
cities and in the areas close to the event were
analysed. Tab. 3 presents the magnitude of the
voltage sag in the sites that saw this occurrence.
0,9
0,8
TABLE 3. Measurement of the selected site that
0,7
were sensitized to the event of Case II
Sag
(%)
Site
Name
Voltage
level
(kV)
Subsystem
Cities
or I.C.
0,3
Duratio
n
(s)
0,2
0,03333
90,0
MRR_04T2
69
EAST
-
0
33
67
100
134
167
201
234
268
301
334
368
401
435
468
502
535
569
602
636
669
703
736
769
803
836
870
903
937
970
1004
0,6
0,66667
77,2 GNN_02M2
69
EAST
-
Time (ms)
0,66667
32,9
MRD_04T2
69
EAST
João Pessoa
0,66667
55,6
MRD_04T3
230
EAST
-
0,26667
87,8 PRD_04S1
230
EAST
I.C.
0,23333
88,0
BGI_04C1
230
EAST
I.C.
0,66667
71,9 GNN_04F1
230
EAST
-
0,23333
87,5
230
EAST
-
0,5
0,4
FTZ_04T2 (69kV)
BNO_03C2 (138 kV)
MLG_04T5 (230 kV)
USB_05T4 (500kV)
FIGURE 4. RMS Voltages during the sag
CASE II:
This event happened on 04/01/04 at 10:54 in
the distribution utility stemming from an
automatic breaker opened of the transmission
lines 02J1 and 02J2 in MRD/ João Pessoa.
Cause: vandalism.
The DFR were chosen in order to reach all the
voltage levels and a vast geographical area of the
RCD_04T5
We observed in Tab. 3 that the lowest magnitude
was
registered
in
MRD_04T2,
whose
measurement was collected in the 69kV side of a
transformer (100MVA). This is the site of the
CHESF monitoring system closer to the event that
in the distribution utility. The second lowest
magnitude of the voltage sag was registered in
MRD_04T3, measured on the 230kV side of the
same power transformer. We can also verify that
all the other sensitised measurement sites are
located in the East of the CHESF power system,
which is the same area of the occurrence. Another
interesting observation, is that the monitor in
BGI_04T4 located in the 69kV side of the
100MVA power transformer didn't see any
voltage sag related to case II, although the
monitor located in the transmission line
BGI_04C1 of 230kV has registered a voltage sag
of 88.0%. According to Bollen [4] for measured
voltage sags, the three rms voltages through a
transformer will often be different due to the
characteristic phase angle jump and other
phenomena.
From the 14 Industrial Consumers, only two
located East of the system were sensitised. And
from the eight main cities, only in João Pessoa the
voltage decreased below 90%.
Fig. 5 shows the rms of the worst voltage sag
waveform in 69 and 230 kV related to the Case II.
RMS Voltages during the sag of CASE II
1,1
1
Voltage sag (pu)
0,9
0,8
0,7
0,6
0,5
0,4
0,3
0
33
67
100
134
167
200
234
267
301
335
368
402
435
469
503
536
570
603
637
671
704
738
772
805
839
872
906
940
973
1007
0,2
Time (ms)
MRD_04T2 (69kV)
MRD_04T3 (230kV)
FIGURE 5. RMS Voltages during the sag
We observed from the two studied cases, that
event 1 stemmed from CHESF was more harmful
to the CHESF transmission system than the event
2, whose origin was in the distribution utility.
According to the degree of severity, it is worth to
mention that the voltage sag in MRD-04T2
caused by the event 1 was classified as severity 2,
while the voltage sag caused by the event 2 was
classified as severity 3.
4. PERFORMANCE INDICES
Short duration voltage variations include
variations in the fundamental frequency voltage
that last less than one minute. These variations
are best characterized by plots of the RMS
voltage vs. time but it is often sufficient to
describe them by a voltage magnitude and a
duration that the voltage is outside of specified
thresholds. It is usually not necessary to have
detailed waveform plots since the RMS voltage
magnitude is of primary interest.
The “System Average RMS (Variations)
Frequency Index” or “SARFI” was developed by
EPRI to describe voltage sag performance. It has
been adopted by several U.S. utilities, and also
utilities in the U.K. and Singapore. It is
recommended for the basic grid in Brazil [5].
The SARFI Index is usually expressed as a
function of equipment sensitivity (or minimum
phase magnitude). The SARFIX indicates the
annual number of voltage sags where the retained
voltage (on the minimum phase) is less than x %.
This is equivalent to an event when the voltage is
(1- x) % below the nominal (prefault voltage).
The SARFICBEMA indicates the annual number of
voltage sags where magnitude and duration of the
event is outside the CBEMA equipment
sensitivity tolerance curve.
The index is general enough so that it can be
applied to any sensitivity level. It can also be
applied for a given site, or across an entire
system.
Tables 4 and 5 show the SARFI90, SARFI80,
SARF70, SARFI50 and SARFI10 as function of the
event duration; and SARFICBEMA in MRD_04T2
and MRD_04T3 sites, respectively. Analysing
and comparing the performance indices in MRD04T2 (Tab.4) and MRD-04T3 (Tab.5), we can see
that the frequency of events is higher and more
severe in MRD-04T2. This result was expected,
because the system at high voltage level is
stronger, in the sense of being closer to the
generation and being less sensitive to shortcircuits originated in the equipments connected to
low voltage level.
TABLE 4. Performance indices in MRD-04T2 in
2004
SARFI_Index
0 - 0,2 s
SARFI_90
57
10
23
0
90
SARFI_80
10
3
14
0
27
SARFI_70
3
2
10
0
15
SARFI_50
1
0
8
0
9
SARFI_10
0
0
0
0
0
SARFI_CBEMA =
19
0,2 - 0,5 s 0,5 - 3,0 s 3,0 - 60 s
TOTAL
TABLE 5. Performance indices in MRD-04T3 in
2004
SARFI_Index
0 - 0,2 s
SARFI_90
42
11
23
0
76
SARFI_80
8
4
10
0
22
SARFI_70
3
4
9
0
16
SARFI_50
0
0
0
0
0
SARFI_10
0
0
0
0
0
SARFI_CBEMA =
0,2 - 0,5 s 0,5 - 3,0 s 3,0 - 60 s
TOTAL
17
5. CONCLUSIONS
This paper has shown the voltage sag propagation
through the CHESF Power System. We saw that
if the fault occurs at the lowest level of
distribution voltage, the number of circuits
affected in CHESF power system is limited.
However, if the fault occurs at CHESF
transmission system, the number of circuits
seeing the voltage is large and geographically
extends from a few square kilometres to hundreds
of square kilometres.
Other power quality indices will be reported in
subsequent papers.
6. REFERENCES
1. Leitão J. J., Reis L. B.: Economic Evaluation
of the Power Quality Losses in the Basic Grid.
Proc. of Seminário Brasileiro sobre Qualidade,
da Energia Elétrica, Sergipe, Brazil, 2003.
2. Mcgranaghan, M., Roettger, B.: Economic
Evaluation of Power Quality. IEEE power
Engineering Review, February, p. 8-12, 2002.
3. ONS (National Power System Operatior).
National Grid Code. 2004.
4. Bollen M. H., Styvaktakis E.:Characterization
of Three-Phase Unbalanced Dips (as easy as
one-two-three?) IX ICHQP, Oct.2000.
5. Electrotek
Concepts:
Review
and
Recommendations for the ONS Power Quality
Management System (PQMS). Jun, 2002.
José Julio A Lins Leitão
was born in 1955 in Caruaru, Brazil. He received the
M.Sc. degree in electrical engineering from University
of Itajubá-UNIFEI, MG-Brasil, in 1987. He received
his D.Sc. degree from University of São Paulo-USP,
SP-Brasil, in 2002. Since 1979, he has been working
for San Francisco River Hidroelectric CompanyCHESF, at present in Protection and Automation areas.
His areas of interest include electric power quality,
protection performance and disturbance analysis.
Mailing address:
J Julio Leitão
CHESF/DPA - Edifício COS, sala B316
Rua 15 de março, 50, CEP 50761-901
RECIFE-PE, BRAZIL
phone: (+55)(81)3229.4160
e-mail: [email protected]
Iony Patriota de Siqueira
was born in 1951 in São José do Egito, Brazil. He
received the M.Sc. degree in operations research from
Federal University of Pernambuco in 1999 and the
MBA on Information Systems from Catholic University
of Pernambuco, in 1982. His areas of interest include
reliability, maintenance, artificial intelligence and
system performance. He is a member of Cigré and
IEEE.
Mailing address:
Iony Patriota de Siqueira
Companhia Hidro Elétrica do São Francisco
Department of Protection and Automation
Rua 15 de Março., 50, Bongi, Recife
PE, Brazil
Phone:(+55)(0-81) 32294145
E-mail: [email protected]
Milde Maria da Silva Lira
was born in 1961 in Recife, Brazil. She received the
M.Sc. degree in electrical engineering from Federal
University of Pernambuco in 1999. She received her
D.Sc. degrees from Federal University of Pernambuco
in 2004. His areas of interest include wavelets, artificial
neural networks, fuzzy intelligent system and electric
power quality.
Mailing address:
Milde Lira
Federal University of Pernambuco
Department of Electric Power Engineering
Acadêmico Hélio Ramos Str., s/n Cidade Universitária,
50.740-530 Recife-PE50530
BRAZIL
phone:(+55)(0-81) 2126 8155
e-mail: [email protected]
Paulo F. Ribeiro
was born in 1952 in Recife, Brazil. He received the
Ph.D. degree in electrical engineering from the
University of Manchester, England, in 1985. He
worked for the San Francisco River Hydroelectric
Company-CHESF, in Brazil, and since 1987 he has
worked in the USA as an engineer, researcher,
consultant and university professor. His areas of
interest include electric power quality, power
electronics, energy storage, and power systems
modelling and simulation.
Mailing address:
Paulo F. Ribeiro
Calvin College
Department of Engineering
3201 Burton Street, SE0530
Grand Rapids, Michigan
phone:(+1)(616) 526.6407
e-mail: [email protected]
Baixar