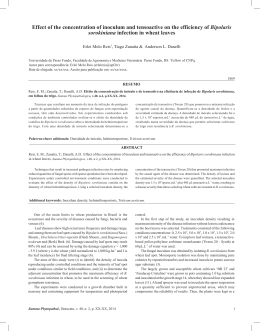
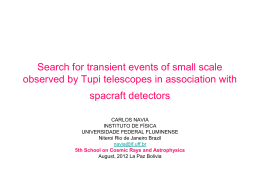
The impact of climate change on wheat yields in India Ridhima Gupta∗ E. Somanathan† Sagnik Dey‡ January 15, 2014 Abstract Regression analysis on data from all major wheat growing districts of India was conducted to examine the effect of temperature, solar radiation (affected by pollution from aerosols), and rainfall on wheat yields in India. Estimates for the model with district fixed effects and year fixed effects indicate that a 1◦ C increase in average daily maximum temperature tends to lower yields by 4 ± 2.7%. Solar radiation in turn had a positive effect on wheat yields. We found a one to one relationship between a percentage increase in solar radiation and a percentage increase in yields. The estimated weather parameter from these regressions were used to assess the impact of recent climate trends and the impact of future climate change on wheat yields. The maximum temperature during the wheat-growing season has increased by 0.7◦ C over the period 1981-2009. Wheat yields in India would have been higher in 2009 by 3± 1.9% if this temperature increase had not occurred. Results of the estimation of the impact of future climate change predict even higher losses ranging from 7± 4.7% for mid-term climate change (2010-2040) and up to 18.3± 10.6% by the end of the century. PRELIMINARY AND INCOMPLETE DRAFT-DO NOT CITE OR QUOTE ∗ Indian Statistical Institute Indian Statistical Institute ‡ Indian Institute of Technology † 1 1 Introduction With current annual production at over 92 million tonnes, India is the world’s second largest producer of wheat and wheat is the second largest crop in India. Thus, impacts on wheat yields in India due to climate change are linked to food security and poverty of a large population. Yet, how climate change will affect wheat yields remains imperfectly understood. In this paper, we therefore focus on estimating the effect of climate change on wheat yields in India. Relationships between wheat yield and daily maximum temperature and daily minimum temperature and solar radiation were evaluated by analysing district-level data covering the period 19812009. Although current agronomic research on wheat has analysed the impact of high temperature on wheat growth, it is largely based on field trials and controlled experiments (Sofield et al., 1977; Wardlaw and Moncur, 1995; Stone and Nicolas, 1998; Rane and Nagarajan, 2004). These studies indicate that high temperatures that prevail towards the end of the growing season (grain filling stage) reduce wheat yield. Such studies do not take into account the adaptive behaviour of farmers. Typically, farmers respond to year to year changes in weather and adjust their practices for example by applying more irrigation in a dry year. Responses have indeed tended to be less severe in the field as the wheat plant was exposed to higher temperatures in glasshouse experiments than those observed in the field (Asseng et al., 2011). A better understanding of this relationship in real world agricultural settings is therefore required to avoid over-estimating the effect of weather on crop yields. Previously Lobell et al. (2011) have used non-experimental data to study the impact of past climate trends on wheat yields, they have analysed aggregated data at the country level. Thus, their estimated parameter of mean temperature is the same over all countries. The estimate on wheat in India may be different from that elsewhere for several reasons. One important one being that Indian wheat production is largely irrigated. Their analysis does not control for solar radiation, an important confounder Lobell et al. (2005). This is the first study of the impact of global warming on Indian wheat using observational data from farms. We analyse district-level data on weather and yields from 168 districts of India. These districts are located in the seven major wheat producing states of the country that contribute more than 90% to the national output and span an agricultural area of more than 200 million hectares. This region is a part of the fertile Indo-Gangetic plains, one of the most intensely farmed and populated 2 areas in the world, where rice and wheat are grown in rotation each year. Our findings indicate that high daily maximum temperatures reduce wheat yield. Although the literature emphasises on the negative effects of high temperatures during grain filling, we found that the impact of high temperature on crop productivity did not vary by the growth phase of the plant. On the contrary, the absence of temperature extremes in the data did not permit us to examine the effect of heat stress on yields. Minimum temperature was not significant in the estimated regressions. Solar radiation had a positive effect on wheat yields. There was a one to one relationship between a percentage increase in solar radiation and a percentage increase in yields. This result was not robust across specifications, we attribute this to the limited variation in solar radiation in the sample and not to the absence of an effect of solar radiation on yields. The estimated weather parameter from these regressions were used to assess the impact of recent climate trends and the impact of future climate change on wheat yields. We found that maximum temperature during the wheat-growing season has increased by 0.7◦ C over the period 1981-2009. Wheat yields in India would have been higher in 2009 by 3% if this temperature increase had not occurred. Climate change predictions were derived from the Reg CM4.3 model for the high emission scenario. The model estimates predict yield losses of 7± 4.7% for mid-term (2010-2040) climate change and yield losses of 18.3± 10.6% by the end of the century. Wheat yield was regressed on district-level weather measures and district fixed effects and year fixed effects. The weather parameters are therefore identified from deviations from district specific variations in yearly weather from the district mean weather. Since variations in weather between years in a district are mostly random, they are uncorrelated with other unobserved determinants of yields thereby avoiding the bias caused by omitted variables. The year fixed effects control for unobserved factors such as technical progress that were common to all districts in a given year. The rest of the paper is organised as follows. The following section describes the data sources and summary statistics. Results of the effects of weather on wheat yields are presented in section 3. Section 4 discusses the impact of past temperature trend on wheat yields. Section 5 contains the predicted impacts of climate change on future yields and section 6 concludes with policy implications. 3 2 Data and Summary Statistics 2.1 Agricultural Data We use district-level data on agricultural outcomes primarily from two sources, the Indian Harvest database from the Centre for Monitoring the Indian Economy (CMIE) and the statistics released by the Directorate of Economics, Ministry of Agriculture (MOA) 1 . The MOA reports district-level area, production and yield and irrigated area for all major crops beginning from the year 1999. Hence prior to 1999 the observations are from the CMIE database. These data are a compilation of the official statistics published by the state governments and the Ministry of Agriculture. Other data sources are the ICRISAT VDSA (Village Dynamics in South Asia) unapportioned Meso database2 and the statistics complied by the Fertilizer Association of India. These data are from the same original sources. Thus missing data from either MOA or the CMIE was replaced by data from these sources. The states of Punjab, Haryana, Uttar Pradesh, Bihar, Rajasthan,Madhya Pradesh, Maharashtra and Gujarat comprise the study area. We exclude districts that were a part of the newly created states of Chattisgarh and Jharkhand. This is because data on the area of the wheat crop that is irrigated was largely missing for these 2 states. Indian district boundaries change periodically as larger districts have been split into smaller ones making it difficult to compare districts over time. To circumvent this, any changes occurring in district boundaries after 1981 have been accounted for. We use the 1981 districts in order to have a balanced panel so that withindistrict variation is preserved. Original district boundaries have been preserved by merging new districts into their ‘parent’ districts. The criterion used for determining the apportioning percent was based on the geographical area of the ‘parent’ district transferred to the new district. 2.2 Weather Data Daily gridded (1◦ × 1◦ ) resolution data on temperature and rainfall was obtained from the Indian Meteorological Department (IMD). To create daily district-level data, we construct the area-weighted average temperature and rainfall of all the grid cells intersecting a 1981 district. 1 2 http://eands.dacnet.nic.in/LUS_1999_2004.htm http://www.icrisat.org/vdsa/vdsa-index.htm 4 To the best of our knowledge, reliable data on surface solar radiation for most of India is not available. Ground based measurements of solar radiation are available from as few as 12 weather stations across the country. The Surface Radiation Budget (SRB) datasets3 too suffers from a wide data gap. To overcome this, we collected daily-level reanalysis data on surface solar radiation from the MERRA database4 . This data is available at the (2/3◦ ×1/2◦ ) resolution. Creation of districtlevel solar radiation data proceeds in the same way as for temperature and rainfall. The daily temperature and solar radiation variables are then averaged over the growing season in each year and the rainfall data is summed up over the growing season in each year. The growing season of wheat varies across the states. It is slightly longer in the Northwest Indo-Gangetic plains (Punjab, Haryana and Western Uttar Pradesh) than in the eastern Indo-Gangetic plains (Eastern Uttar Pradesh, Bihar). Wheat is also planted earlier, by a month or so, in the Northwest IndoGangetic plains. Information on sowing dates and the length of the growing season was obtained from a variety of sources such as the crop calendars published by the Agricultural Meteorological Division of the IMD and data provided by the regional centres of the Indian Agricultural Research Institute. 3 Results Table 1 reports the summary statistics of the key variables of interest. Following the literature our dependent variable is the log of yield of wheat in tonnes per hectare. We specify linear controls for average daily maximum and average daily minimum temperature measured in celsius and total rainfall in centimetres and take the natural log of average solar radiation in hectowatt per meter. Pairwise residual correlations after removing district and year fixed effects and scatterplots of the control variables are shown in Appendix (Figure 2). Log solar radiation’s correlation with maximum temperature was 0.18 and with minimum temperature was -0.255 . Both these variables were positively and moderately correlated with each other and negatively correlated with rainfall. Solar radiation’s correlation with rainfall was smaller in absolute value than its correlation with the temperature variables. The correlation of the share of the wheat crop that is irrigated with the weather variables under the study was small. These correlations suggest that we can uniquely identify the ef3 http://www.gewex.org/srbdata.htm http://disc.sci.gsfc.nasa.gov/mdisc/ 5 These refer to season averages of daily variables. 4 5 fect of maximum temperature, minimum temperature and solar radiation on wheat yields and that a failure to account for solar radiation would bias the estimates on the temperature variables. All the models contain district fixed effects and year fixed effects to control for unobserved factors that were unique to each district or year. The model is of the form log(Yit ) = ci + γt + β1 MaxTit + β2 MinTit + β3 log(SRit ) + β4 Rainit + β5 ShareIrrigatedit + µit where ci is a district fixed effect, γt is a year fixed effect, M axTit and M inTit is the daily maximum and minimum temperature in district i in year t averaged over the growing season, logSRit is the average log solar radiation in district i in year t averaged over the growing season, rainit is the total rainfall in a district-year averaged over the growing season, ShareIrrigatedit is the fraction of the wheat crop that is irrigated and µit is the error term. Error terms may be spatially correlated across districts within a state in a year. This is because time varying unobserved factors such as varietal choice are spatially correlated. Geographic regions may also have similar errors across nearby years. Thus, we adjust the standard errors to allow for both the spatial and time-series dependence 6 following the methodology of Conley (2008) as implemented by Hsiang (2010). Multiple regression estimates for different specifications of the regression model are shown in Table 2. Column 1 of Table 2 shows the results for the full model. Maximum temperature and the log of solar radiation had opposing impacts on yield growth. A 1◦ C increase in maximum temperature tends to lower yields by 4%. By analysing country-level data over the period 1980-2008, Lobell et al. (2011) found that wheat yields in India declined by 9% in response to a 1◦ C increase in maximum temperature. As mentioned before, this estimate is biased because the authors’ do not control for solar radiation. As the data is aggregated at the county level, the authors’ control for country-specific quadratic time trends and country fixed effects. 6 Spatial dependence between two observations vanishes as the distance between two districts reaches a specified cut-off. Similarly, observations across time cease to be dependent as the temporal period between the observations equals a specified cut-off. Throughout the analysis, we fix the distance at 300 Kilometres and the temporal period at 2. 6 The model estimates suggest a one to one relationship between a percentage increase in solar radiation and a percentage increase in yields. It is possible that the lower significance of log solar radiation with year fixed effects is owing to its limited variation over time and not because it does not influence wheat yields. The estimated parameter on maximum temperature in absolute terms was 2 times higher than that of minimum temperature. Minimum temperature was highly insignificant in all specifications. The overall greater importance of maximum temperature is in agreement with the simulation and observational studies on wheat (Rosenzweig and Tubiello, 1996; Dhakhwa and Campbell, 1998; Lobell and Ortiz-Monasterio, 2007; Lobell et al., 2011). Exclusion of solar radiation caused the parameter estimate on maximum temperature and minimum temperature to decrease in absolute terms by 1.26 and 1.82 times (Column 2 of Table 1). The last column of Table 2 reports the estimates for the sub-sample of irrigated wheat. Since unirrigated wheat can respond differently to weather shocks than irrigated wheat, we re-estimate our models for the subsample of irrigated wheat. A district in a given year is defined as irrigated if at least 80% of the wheat area is irrigated. Results were nearly identical for maximum temperature. Solar radiation was no longer significant in this smaller sub-sample. Although rainfall was significant in this subsample its estimated impact was close to zero. Next, we estimate a model controlling for mean temperature instead of maximum and minimum temperature (Table 3). Mean temperature tended to have a negative effect on yield but the impacts were not significant across specifications. Thus, including maximum and minimum temperature separately is more appropriate than including their mean. The estimated impact of mean temperature although is not far removed from those reported by recent simulation studies on wheat yields in India. These studies suggest a 2 to 5% decrease in yield potential of wheat for a mean temperature rise of 0.5◦ C to 1.5◦ C in India (Parry, 2007). So far the yield response to temperature has been restricted to be linear. To allow for a non-linear relationship between temperature and yields, we model maximum temperature using restricted cubic splines (RCS). Stone (1986) has shown that the location of knots in a restricted cubic spline model is not very crucial, the fit is influenced much more by the number of knots. For large sample sizes (Harrell, 2001) recommends using 5 knots and placing them at equally spaced quantiles of the predictor’s marginal distribution. We follow this approach and run the following specification. 7 log(Yit ) = ci + γyeart + β1 RCS(MaxTit ) + β2 MinTit + β3 log(SRit ) + β4 Rainit + β5 ShareIrrigatedit where ci is a district fixed effect and yeart is a year fixed effect. The underlying relationship is indeed almost linear (Figure 1). Robustness checks indicated that the fit was not sensitive to a change in the number or location of knots. Temperatures exceeding a cutoff (about 30◦ C) are found to be harmful for wheat productivity (Rane and Nagarajan, 2004; Jenner, 1991). In order to test whether the temperature response function is different beyond a certain threshold, we model temperature as a piece-wise linear function as in Schlenker and Roberts (2009). The temperature variables therefore have been converted to growing degree days (GDD) and heating degree days (HDD). Growing degree days measure accumulated exposure to heat through out the growing season. They are calculated by integrating the temperature time (measured in days) above a lower threshold and below a upper threshold. Thus, if the baseline threshold is 10◦ C, a day with a temperature below 10◦ C contributes 0 growing degree days. Here we use a lower bound of 5◦ C and a upper bound of 27◦ C. Growing degree days therefore are determined as follows: g(h) = 0 if h ≤ 5 h − 8 if 5 < h < 27 22 if 27 ≤ h Heating degree days (HDD) measure growing degree days above a certain lower threshold but no upper threshold. Agricultural scientists suggest a baseline temperature of 5◦ C for Indian wheat7 . Following Schlenker and Roberts (2009), the upper threshold of 27◦ C was determined by looping over several possible thresholds, estimating the least squares slope for each one and choosing the one with the highest R squared. We estimate three specifications that differ in the way we model temporal heterogeneity. The F test for testing the equality of coefficients on GDD and HDD did not reject the null hypothesis of equality. The absence of too many observations in the extreme right of the temperature distribution may explain this finding. Results are shown in Table 4. 7 Source: Conversations with scientists that specialise in wheat breeding. 8 An important assumption made in all our models is the time separability of the weather effects. Thus, the effect of a very hot day on yields is independent of the timing of its occurrence over the growing season. For checking the validity of this assumption, we implement the approach of Welch et al. (2010). The growing season is hence divided into three sub-seasons i.e. vegetative, reproductive and ripening. We allowed for the weather estimates to vary across each of the three growth phases. But we could not reject the null hypothesis of equality of the effects of the weather variables across the plant’s different growth stages (Table 5). So far the models do not control for fixed effects that vary by state. A countrywide year fixed effect fails to capture unobservables that are specific to each state. However state-by-year fixed effects are too restrictive as they absorb a significant amount of variation in weather. Alternatively, we replicate the analysis controlling for linear and quadratic state-specific trends (Table 6). The estimated impact on maximum temperature although significant decreases in magnitude. Results were nearly identical when the linear state-specific trend was replaced by a quadratic state-specific trend or by including overall trends rather than by state. Solar radiation regained significance in the models with the overall time trends. This again reflects the limited variation in log solar radiation overtime that may lead to its insignificance in models that allow for state-specific trends. Further, these results indicate that time-varying unobservables that are specific to each state are uncorrelated with the weather variables. Year fixed effects impose less structure on the model so that bias is reduced. Hence the estimates with year fixed effects are preferred to the estimates obtained after controlling for time trends. 4 Impact of Temperature trends on Wheat Yields Over the study period, the production weighted maximum temperature in the wheat growing region increased by 0.7◦ C. This section assesses the impact of this increase in maximum temperature on wheat yields. Thus, we attempt to answer the question of how wheat growth would have evolved without this trend. Maximum temperature was de-trended by fitting a linear time trend separately for each district. For each district-year observation, we compute the difference between predicted yields with observed weather and predicted yields with de-trended temperature for the year 2009. To arrive at the national effect, we take a production weighted average of these differences. The results indicate that by the year 2009 wheat yields may have declined by 3± 1.9% relative to what would have been achieved without the trend 9 in maximum temperature over 1981-2009. 5 Climate Change Predictions Climate change predictions are made from the Reg CM4.3 model. This is the latest version of the regional climate model of International centre for Theoretical Physics (ICTP). As the name suggests, regional climate models provide climate simulations over a finer spatial resolution, therefore they are sufficiently accurate for assessing the impact of climate change. Details of the model physics and dynamics are discussed in Giorgi et al. (2012). We obtained monthly model output on both maximum temperature and solar radiation. The gridded data was converted to the district-level data using the approach employed to convert the historical gridded data. We considered the (RCP) 8.5 emission scenario for climate change. This is a high emission scenario. We compute climate change impacts for three time periods, near-future (2040), midfuture (2070) and distant future (i.e. end of the century). One caveat of this analysis is that the district fixed effects and year fixed effects used to control for unobservable factors wipe out a great deal of variation in weather. Hence the predicted impacts for large changes in climate that are expected to occur in the coming decades depend on functional form assumptions. Another consideration is the absence of days with maximum temperature exceeding 33◦ C in the data. If days with temperatures exceeding this bound are expected to occur with climate change then the estimated parameter of the impact of maximum temperature can no longer be applied to infer about the effect of such hot days on wheat yields. Climate change predictions were made as follows. We calculated the production weighted predicted yield per acre for each district-year observation after climate change and at the observed weather. These yield outcomes were summed across all the districts in the sample for each year. We then computed the percentage change in average yield per acre after climate change and at the current climate (i.e. average over the 1981-2009 period). Results are shown in Table 7. The aggregate impact though positive is not significant, with significant impacts of maximum temperature being outweighed by insignificant impacts of log solar radiation. The estimated impacts of maximum temperature predicts yield losses of 7± 4.7% for near-future and mid-future climate change. In the absence of any adaptation, wheat yields are expected to be lower by 18.3± 10.6% by the end of the 10 century. 6 Conclusion In this paper we analysed the impact of climate change on wheat yields in India. First, regression analysis on data from all major wheat growing districts of India was conducted to examine the effect of temperature, solar radiation (affected by pollution from aerosols), and rainfall on wheat yields in India. The estimated weather parameter from these regressions were then used to assess the impact of recent climate trends and the impact of future climate change on wheat yields. Consistent with previous literature we conclude that high day-time temperatures reduce yield whereas high solar radiation increases it. The latter finding was not robust across specifications. The impact of high temperature on crop productivity did not vary by the growth phase of the plant. Further, the absence of temperature extremes in the data did not permit us to examine the effect of heat stress on yields. Minimum temperature was not significant in the estimated regressions. We found that trend in maximum temperature over the period 1981-2009 reduced wheat yields by 3± 1.9%. Results of the estimation of the impact of future climate change predict even higher losses ranging from 7% for medium-term climate change (2010-2040) and up to 18% by the end of the century. Although wheat yields in India have been growing over the period 1961-2008, the rate of increase is only 1.1% per year. In many parts of the country such as Madhya Pradesh and Uttaranchal yields are declining (Ray et al., 2013). This rate of increase is lower than the rate of increase in population of India of 1.35% over the period 2005-20108 . Given that wheat constitutes a major part of the diet in India, yield needs to increase further to meet the rising demand from a growing population. Our results show that the past trend in maximum temperature has already led to a significant decline in wheat production in India and future changes in maximum temperature are predicted to be even more harmful. They signal the importance of accelerating measures to tackle climate change such as the development of heatresistant varieties. Such developments would have a huge pay-off whereas a failure to adapt would lead to significant shortages in wheat supply. 8 Source: United Nations, Department of Economics and Social Affairs,Population Division (2013). World Population Prospects. The 2012 Revision, DVD Edition. 11 Table1: Descriptive Statistics Variable yield ( tonnes per hectare ) log yield maxt (◦ C) mint (◦ C) meant (◦ C) log solar radiation rain (cm) share irrigated Number of Districts Number of Observations Mean 2.19 0.69 26.15 10.88 18.51 0.56 5.47 0.82 168 4866 Std. Dev 0.91 0.44 2.31 1.56 1.84 0.11 6.49 0.25 168 4866 Min 0.23 -1.48 17.44 6.01 12.03 0.16 0 0.01 168 4866 Max 5.73 1.75 32.52 15.37 23.94 0.83 73.04 1 168 4866 Notes: Values were calculated across the period 1981-2009 and the growing season. Standard deviations in parentheses. 12 Table 2: Results of Weather Variables Effect on Wheat Yields Dependent Variable-log of yield of wheat in tonnes per hectare maxt log sr mint rain share irrigated Observations R-squared District Fixed Effects Year Fixed Effects Full Model (1) Solar Radiation excluded (2) Sub-sample of Irrigated wheat (3) -0.04117*** (0.014) 0.82900* (0.463) 0.02034 (0.015) 0.00173 (0.001) 0.30689*** (0.049) -0.03270*** (0.012) -0.04638*** (0.014) 0.65999 (0.472) 0.01611 (0.016) -0.00288** (0.001) 4,866 0.962 Yes Yes 4,866 0.962 Yes Yes 0.01118 (0.015) 0.00115 (0.001) 0.30263*** (0.049) 3,448 0.975 Yes Yes Notes: Standard errors have been corrected for spatial and auto-correlation. Figures in parentheses are standard errors. *** indicates significance at the 1% level, ** indicates significance at the 5% level, * indicates significance at the 10% level 13 Table 3: Results of Weather Variables Effect on Wheat Yields Controlling for Mean Temperature Dependent Variable-log of yield of wheat in tonnes per hectare meant log sr rain share irrigated Observations R-squared District Fixed Effects Full Model (1) Solar Radiation excluded (2) Sub-sample of Irrigated wheat (3) -0.02571 (0.018) 0.36470 (0.442) 0.00222* (0.001) 0.28834*** (0.048) -0.02535 (0.018) 0.00185 (0.001) 0.28889*** (0.048) -0.03582* (0.019) 0.21152 (0.433) -0.00230* (0.001) 4,866 0.962 Yes 4,866 0.962 Yes 3,448 0.975 Yes Notes: Standard errors have been corrected for spatial and auto-correlation. Figures in parentheses are standard errors. *** indicates significance at the 1% level, ** indicates significance at the 5% level, * indicates significance at the 10% level 14 0 .5 fitted log yield 1 1.5 2 Figure 1 : Fitted log yield against maximum temperature 18 20 22 24 26 28 maxt in growing season (in celsius) 30 32 Notes: The shaded region denotes the 95% confidence intervals. The model controls for district and year fixed effects. Standard errors have been clustered by agro-climatic zones. 15 Table 4: Results of Degree Day Variables Effect on Wheat Yields Dependent Variable-log of yield of wheat in tonnes per hectare Linear Trend (1) Quadratic Trend (2) Year Fixed Effects (3) -0.20382 (0.136) -0.91537* (0.483) 0.89776** (0.381) 0.00014 (0.000) 0.00388*** (0.001) -0.11954 (0.125) -0.43751 (0.426) 0.59413* (0.356) 0.00015 (0.000) 0.00288*** (0.001) -0.15870 (0.159) -0.17486 (0.453) 0.36601 (0.438) 0.00023* (0.000) 0.00286*** (0.000) F statistic for testing gdd = hdd Prob > F 1.58 0.21 0.40 0.53 0.00 0.98 Observations R-squared District Fixed Effects 4,866 0.956 Yes 4,866 0.959 Yes 4,866 0.962 Yes gdd hdd log sr rain share irrigated Notes: Growing and Heating degree days are measured in 1000 days. Standard errors have been corrected for spatial and auto-correlation. Figures in parentheses are standard errors. *** indicates significance at the 1% level, ** indicates significance at the 5% level, * indicates significance at the 10% level 16 Table 5: Equality tests of weather coefficients across the three growth stages P values Null Hypothesis w\ linear trend w\ quadratic trend Year Fixed Effects (1) (2) (3) maxt equal for all 3 stages log sr equal for all 3 stages mint equal for all 3 stages rain equal for all 3 stages 0.25 0.64 0.71 0.17 0.98 0.98 0.73 0.52 0.17 0.18 0.19 0.49 Observations 4,866 4,866 4,866 Yes Yes Yes District Fixed Effects 17 Table 6: Results of Weather Variables Effect on Wheat Yields Controlling for State-specific trends Dependent Variable-log of yield of wheat in tonnes per hectare maxt log sr mint rain share irrigated State-specific Linear Trend (1) State-specific Quadratic Trend (2) -0.02552*** (0.009) 0.59911 (0.402) -0.01771 (0.013) 0.00006 (0.001) 0.53589*** (0.057) -0.02140*** (0.008) 0.55135 (0.371) -0.00004 (0.011) 0.00002 (0.001) 0.39299*** (0.053) 4,866 0.958 Yes 4,866 0.961 Yes Observations R-squared District Fixed Effects Notes: Standard errors have been corrected for spatial and auto-correlation. Figures in parentheses are standard errors. *** indicates significance at the 1% level, ** indicates significance at the 5% level, * indicates significance at the 10% level 18 Table 7: Impact of Climate Change on Wheat Yields Percentage change in Yield Near Future- 2040 Maximum Temperature Effect (1) Solar Radiation Effect (2) Total Effect (3) High Emission Scenario -7.41∗∗∗ (2.37) Mid Future- 2070 52.19 (35.70) 40.90 (31.57) High Emission Scenario -7.37∗∗∗ (2.35) Distant Future- 2099 52.54 (35.98) 41.29 (31.85) High Emission Scenario -18.30∗∗∗ (5.48) 52.55 (35.99) 24.64 (26.64) Notes: Predicted impacts of climate change have been calculated as the percentage change in average yield per acre after climate change and at the current climate (i.e. average over the 1981-2009 period. Standard errors have been corrected for spatial and auto-correlation. Figures in parentheses are standard errors. Sample:4866 observations from 168 districts over the period 1981-2009 *** indicates significance at the 1% level, ** indicates significance at the 5% level, * indicates significance at the 10% level 19 7 Appendix Figure 1: Correlations among the variables 0.0 1.0 −20 0 20 40 60 r= 0.32 r= −0.27 r= 0.079 p= <0.01 p= <0.01 p= <0.01 r= −0.25 r= 0.035 r= −0.063 p= <0.01 p= 0.014 p= <0.01 r= −0.29 r= 0.014 p= <0.01 p= 0.33 −1 r= 0.18 p= <0.01 −2 maxt 0 1 −1.0 ● ● ● ●● ● ● ● ● ●● ● ● ● ● ●●● ● ●●● ● ● ● ● ● ●● ● ● ● ● ● ● ● ● ● ● ●● ●● ●● ● ●● ● ● ● ●●●● ● ● ● ●● ● ● ● ● ● ● ● ● ● ● ● ● ● ● ● ● ● ● ● ● ● ● ● ● ●●● ● ● ● ● ● ● ● ● ● ● ● ● ● ● ● ● ● ● ●● ● ● ● ● ● ● ● ● ● ●● ● ● ● ● ● ● ● ● ● ● ● ● ● ● ● ● ● ● ● ● ● ● ● ● ● ● ● ● ● ● ● ● ● ● ● ● ● ● ● ● ● ● ● ●●●● ● ● ● ● ● ● ● ● ● ● ● ● ● ● ● ● ● ● ● ● ● ● ● ● ● ● ● ● ● ● ● ● ● ● ● ● ● ● ● ● ● ● ● ● ● ● ● ● ● ● ● ● ● ● ● ● ● ● ● ● ● ● ● ● ● ● ● ● ● ● ● ● ● ● ● ● ● ● ● ● ● ● ●● ● ●● ● ● ● ●● ● ● ● ● ● ● ● ●● ● ● ● ● ● ● ● ● ● ● ● ● ● ● ● ● ● ● ● ● ● ● ● ● ● ● ● ●● ● ● ● ● ● ● ● ● ● ● ● ● ● ● ● ● ● ● ● ● ● ● ● ● ● ● ● ● ● ● ● ● ● ● ● ● ● ● ● ● ● ● ● ● ● ● ● ● ● ● ● ● ● ● ● ● ● ● ● ● ● ● ● ● ● ● ● ● ● ● ● ● ● ● ● ● ● ● ● ● ●● ● ● ● ● ● ● ●● ● ● ● ● ● ● ● ● ● ● ● ● ● ● ● ● ● ● ● ● ● ● ●● ● ● ● ● ● ●● ● ● ● ● ● ● ● ● ● ● ● ● ● ● ● ● ● ● ● ● ● ● ● ● ● ● ● ● ● ● ● ● ● ● ● ● ● ● ● ● ● ● ● ● ● ● ● ● ● ● ● ● ● ● ● ● ● ● ● ● ● ● ● ● ● ● ● ● ● ● ● ● ● ● ● ● ● ● ● ● ● ● ● ● ● ● ● ● ● ● ● ● ● ● ● ● ● ● ● ● ● ● ● ● ● ● ● ● ● ● ● ● ● ● ● ● ● ● ● ● ● ● ● ● ● ● ● ● ● ● ● ● ● ● ● ● ● ● ● ● ● ● ● ● ● ● ●● ● ● ● ● ● ● ● ● ● ● ● ● ● ● ● ● ● ● ● ● ● ● ● ● ● ● ● ● ● ● ● ● ● ● ● ● ● ● ● ● ● ● ● ● ● ● ● ● ● ● ● ● ● ● ● ● ● ● ● ● ● ● ● ● ● ● ● ● ● ● ● ● ● ● ● ● ● ● ● ● ● ● ● ● ● ● ● ● ●● ● ● ● ● ● ● ● ● ● ● ● ● ● ● ● ● ● ● ● ● ● ● ●● ● ● ● ● ● ● ● ● ● ●● ● ● ● ● ● ● ● ● ● ●● ● ● ● ● ● ● ● ● ● ● ● ● ● ● ● ● ● ● ● ● ● ● ● ● ● ● ●● ● ● ● ● ● ● ● ● ● ● ● ● ● ● ● ● ● ● ● ● ● ● ● ● ● ● ● ● ● ● ● ● ● ● ● ● ● ● ● ● ● ● ● ● ● ● ● ● ● ● ● ● ● ●● ● ● ● ● ● ● ●● ● ● ● ● ● ● ● ● ● ● ● ● ● ● ● ● ● ● ● ● ● ● ● ● ● ● ● ● ● ● ● ●● ● ● ● ● ● ● ● ● ● ● ● ● ● ● ● ● ● ● ● ● ● ● ● ● ● ● ● ● ● ●● ●● ● ● ● ● ● ● ● ● ● ● ● ● ● ● ● ●● ● ● ● ● ● ● ● ● ● ● ● ● ● ● ● ● ● ● ● ● ● ● ● ● ● ● ● ● ● ● ● ● ● ● ● ● ● ● ● ●● ● ● ● ● ● ● ● ● ● ● ● ● ● ● ●● ● ● ● ● ● ● ● ● ● ● ● ● ● ● ● ● ● ● ● ● ● ● ● ● ● ● ● ● ● ● ● ● ● ● ● ● ● ● ● ● ● ● ● ● ● ● ● ● ● ● ● ● ● ● ● ● ● ● ● ● ● ● ● ● ● ● ● ● ● ● ● ● ● ● ● ● ● ● ● ● ● ● ● ● ● ● ● ● ● ● ● ● ● ● ● ● ● ● ● ● ● ● ● ● ● ● ● ● ● ● ● ● ● ● ● ● ● ● ● ● ● ● ● ● ● ● ● ● ● ● ● ● ● ● ● ● ● ● ● ● ● ● ● ● ● ● ● ● ● ● ● ● ●● ● ● ● ● ● ● ●● ● ● ● ● ● ● ● ● ● ● ● ●● ● ● ● ● ● ● ● ● ● ● ●● ● ● ● ● ● ● ● ● ● ● ● ● ● ● ● ● ●● ● ● ● ● ● ● ● ● ● ● ● ● ● ● ● ● ● ● ● ● ● ● ● ● ● ● ● ● ● ● ● ● ● ● ● ● ● ● ● ● ● ● ● ● ● ●● ● ● ● ● ● ● ● ● ● ● ● ● ● ● ● ● ● ● ● ● ● ● ● ● ● ● ● ● ● ● ● ● ● ● ● ● ●● ● ● ● ● ● ● ● ● ● ● ● ● ● ● ● ● ● ● ● ● ● ● ● ● ● ● ● ● ● ● ● ● ● ● ● ● ● ● ● ●● ● ● ● ● ● ● ● ● ● ● ● ● ● ●● ● ● ● ● ● ● ● ● ● ● ● ● ● ● ● ● ● ● ● ● ● ● ● ● ● ● ● ● ●●● ● ● ● ● ●● ● ● ● ● ● ● ● ● ● ● ● ● ● ● ●● ● ● ● ● ● ● ● ● ● ● ● ●● ● ● ● ● ● ● ● ● ● ● ● ●● ● ● ● ● ● ● ● ● ● ● ● ● ● ● ● ● ● ● ● ● ● ● ● ● ● ● ● ● ● ● ● ● ● ● ● ● ● ● ● ● ● ● ● ● ● ●● ● ●● ● ● ● ● ● ● ● ● ● ● ● ● ● ● ● ● ● ● ● ● ● ● ● ● ●● ● ● ● ● ● ● ● ● ● ● ● ● ● ● ●●● ● ● ● ● ● ● ● ● ● ● ● ● ● ● ● ● ● ● ● ● ● ● ● ● ● ● ● ● ● ● ● ● ● ● ● ● ● ● ● ● ● ● ● ● ● ● ● ● ● ● ● ● ● ● ● ● ● ● ● ● ● ● ● ● ●●● ● ● ● ●●●● ●● ●● ● ● ●● ●●● ● ● ● ●● ● ● ● ●● ● ● ● ● ● ●●● ● ● ● ● ● ● ● ● ● ● ● ● ● ● ●● ●● ● ● ● ● ●● ● ● ● ● ● ● ● ● ●●●● ● ● ● ● ●● ●● ●●●●● ● ● ● ● ● ● ● ● ● ● ● ● ●● ●● ● ● ● ● ● ● ● ●●● ● ● ●● ● ●●● ●● ●●● ●●● ● ● ● ● ● ● ●●●● ●● ● ●● ● ● ● ● ● ● ●● ●●●● ● ●● ● ●● ● ● ● ● ●● ● ●● ● ● ● ●● ●● ● ● ● mint ● ● ● ● ● ● ● ● ● ● ●● ●●●● ● ●● ●● ● ● ●●● ● ● ● ● ● ● ● ● ●● ●● ●●● ● ● ● ● ● ● ● ●● ● ● ● ●●● ● ● ● ●● ● ● ● ● ● ● ●● ● ● ● ●● ● ● ● ● ● ● ● ● ● ● ● ● ● ● ● ● ● ● ● ● ● ●● ● ● ● ● ● ● ● ● ● ●● ● ● ● ● ● ● ●●● ● ● ●●● ● ● ● ● ● ● ● ● ● ● ● ● ● ● ● ● ● ● ● ● ● ● ● ● ● ● ● ● ● ● ● ● ● ● ● ● ● ● ● ● ● ● ● ● ● ● ● ● ● ● ● ● ● ● ● ● ● ●● ● ● ● ● ● ● ●● ● ● ● ● ● ● ● ● ● ● ● ● ● ● ● ●● ● ●● ● ● ●● ● ● ● ● ● ● ● ● ● ● ● ●● ● ● ● ● ● ●● ● ● ● ● ● ● ● ● ● ● ●● ● ● ● ● ● ● ● ● ● ● ● ● ● ● ● ● ● ● ● ● ● ● ● ● ● ● ● ● ● ● ● ● ● ● ● ● ● ● ● ● ● ● ●● ● ● ● ●● ● ● ●● ● ● ● ● ● ● ●● ● ● ● ● ● ● ●● ● ● ● ● ● ● ● ● ● ●● ● ● ●● ● ● ● ● ● ● ● ● ● ● ● ● ● ● ● ● ● ● ● ● ● ● ● ●● ● ●● ● ● ● ● ●● ● ● ● ● ● ● ● ● ● ●● ● ● ● ● ● ● ● ● ● ● ● ● ● ● ● ● ● ● ● ● ● ● ● ●● ● ● ● ● ● ● ● ● ● ● ● ● ● ●● ●● ● ● ● ● ● ● ● ● ● ● ● ● ● ● ● ● ● ● ●● ● ●● ● ● ●● ● ● ● ● ● ● ● ● ● ● ● ● ●● ● ● ● ● ● ● ● ● ● ● ● ● ● ● ● ● ● ● ● ● ● ● ● ● ● ● ● ● ● ● ● ● ● ● ● ● ● ● ●● ● ● ● ● ● ●● ● ● ● ● ● ● ● ● ● ● ●● ● ● ● ● ● ● ● ● ● ● ● ● ● ● ● ●●●● ● ● ●● ● ●● ● ● ● ● ● ●● ●●● ●● ● ● ● ● ● ● ● ● ● ● ● ● ● ● ● ● ● ● ● ●● ● ● ● ● ● ● ●● ● ● ● ● ● ● ● ●● ● ● ● ●● ● ● ● ● ● ● ● ● ●● ● ● ● ● ● ● ● ● ● ● ●● ● ● ● ● ●● ● ● ● ● ● ● ● ● ● ● ● ● ● ● ● ● ● ● ● ● ● ● ● ● ● ● ● ●● ● ●● ● ● ● ● ● ● ● ● ● ● ● ● ● ● ● ● ● ● ● ● ● ● ●● ● ● ● ●● ●● ● ● ● ● ●● ● ● ● ● ●● ● ● ● ● ● ● ● ● ● ● ● ● ●● ● ● ● ● ● ●● ● ● ● ● ● ● ● ●● ● ● ● ● ● ● ● ●● ● ● ● ● ● ● ● ● ● ● ● ● ● ●● ● ● ● ●● ● ● ● ● ● ● ● ●● ● ● ● ● ● ● ● ● ● ● ● ● ● ● ● ● ● ● ● ● ● ● ● ● ● ●● ● ● ● ● ● ● ● ●● ●● ● ● ● ● ●● ● ● ● ● ● ● ● ● ● ● ● ● ● ●● ● ● ● ● ● ● ● ● ● ● ● ● ● ● ●● ● ● ● ● ● ● ● ● ● ● ● ● ● ● ● ● ● ● ● ● ● ● ● ● ● ● ● ● ● ● ● ● ● ● ● ● ● ● ● ● ● ● ● ● ● ● ● ● ● ● ● ● ● ● ● ● ● ● ● ● ● ● ● ● ●● ● ●● ● ● ●● ● ● ● ● ● ● ●● ●● ● ● ●● ●● ● ● ● ● ● ●● ● ● ●● ●● ● ● ● ● ● ● ● ● ● ● ● ● ● ● ● ● ● ● ● ●● ● ●● ● ● ● ● ● ● ● ● ● ●● ● ● ● ● ● ● ●● ● ● ● ● ● ● ● ● ● ● ● ●● ● ● ● ● ● ● ● ● ●● ● ● ● ● ● ●● ● ● ● ● ● ● ● ● ●● ● ● ●● ● ● ● ● ●● ● ● ● ● ● ● ● ● ●● ● ● ● ●● ● ● ● ●● ● ● ● ● ● ● ● ● ● ● ● ● ● ● ● ● ● ●● ● ●● ● ● ● ● ● ● ● ● ● ● ● ● ● ● ●● ● ● ●● ● ● ●● ● ●● ●● ● ●● ● ● ● ● ● ● ● ● ● ● ●● ● ● ● ● ● ● ● ● ● ● ● ● ● ● ● ● ● ● ● ● ● ●● ● ● ● ● ● ● ● ● ● ● ● ● ● ● ● ● ● ● ● ● ● ● ● ● ● ● ● ● ● ● ● ● ● ● ● ● ● ● ● ● ● ● ● ● ● ● ● ● ● ● ● ● ● ● ● ● ● ● ● ● ● ● ● ● ● ● ● ● ● ● ● ● ● ● ● ● ● ● ● ●● ● ● ● ● ●● ● ● ● ● ● ● ● ● ● ● ● ● ● ● ●●●● ● ● ● ● ● ● ● ● ● ●● ● ●● ●● ● ●● ● ● ● ● ● ● ● ● ● ● ● ● ● ● ● ● ● ● ● ● ● ● ● ● ● ● ● ● ● ● ● ● ● ●●● ● ● ● ● ●●● ● ● ● ● ● ● ● ● ● ● ● ● ● ● ● ● ● ● ● ●● ●● ● ● ●● ● ●●●●●● ● ●● ● ● ● ● ● ● ● ● ● ● ● ● ● ● ● ● ● ● ●● ● ● ●● ● ● ● ● ● ● ● ● ●● ●●● ● ● ●●● ● ● ● ● ● ● ● ● ● ● ● ● ●● ●●● ● ● ● ● ● ● ● ● ●● ● ● ● ●● ● ●● ●● ●● ●●●●● ●●● ● ● ●● ●● ● ● ●● ● ●● ● ●● ●● ●● ●● ● ● ●●● ● ●● ● ●● ● ● ●● −2 −1 0 1 ● ● ● ● ● ● ● ●● ● ● ●●●● ● ● ● ● ● ●● ●● ● ●● ● ● ● ●● ● ● ●● ● ● ● ● ● ● ● ●● ● ●● ●● ● ● ●●● ●● ● ● ● ● ● ● ● ● ● ● ● ● ●● ● ● ● ● ● ●● ● ● ● ● ● ● ● ● ● ● ● ● ● ● ● ● ● ● ● ● ● ● ● ● ● ● ● ●● ● ● ● ● ●● ● ● ● ● ● ● ● ● ● ● ● ● ●● ● ● ● ●● ●● ● ● ● ● ● ● ● ● ● ● ● ● ● ● ● ● ● ● ● ● ● ● ● ● ●●● ● ● ● ● ● ● ● ● ● ● ● ● ● ● ● ● ● ● ● ● ● ● ● ● ● ● ● ● ● ● ● ● ● ● ● ● ● ● ● ● ● ● ● ● ● ● ● ● ● ● ● ● ● ● ● ● ● ● ● ● ● ● ●● ● ● ● ● ● ● ● ● ● ● ● ● ● ● ● ● ● ● ● ●● ● ● ● ● ● ● ● ● ● ● ● ● ● ● ● ● ● ● ● ● ● ● ● ● ● ● ● ● ● ● ● ● ● ● ● ● ●● ● ●● ● ● ● ● ● ● ● ● ● ● ● ● ● ● ● ● ● ● ● ● ● ● ● ● ● ● ● ●● ● ●● ● ● ● ● ● ● ● ● ● ● ● ● ● ● ● ● ● ● ● ● ● ● ● ● ●● ● ● ●● ● ● ● ● ● ● ● ● ● ● ● ● ●● ● ● ● ● ● ● ● ● ● ● ● ● ● ●● ● ● ● ● ●● ● ● ● ● ● ● ●● ● ● ● ● ● ●● ● ● ● ● ● ● ● ● ●● ● ● ● ● ● ●● ● ● ● ● ● ● ● ● ● ● ● ● ● ●● ● ● ● ●● ● ● ● ● ● ● ● ● ● ● ●● ●● ● ● ● ● ● ● ● ● ● ● ● ● ● ●● ● ● ● ● ●● ● ● ● ● ● ● ● ●● ● ● ● ● ●● ● ● ● ● ● ● ● ● ●● ● ● ●● ● ●● ● ● ● ● ● ● ● ● ● ● ● ● ● ● ●● ● ● ● ● ● ● ● ● ●● ● ● ● ● ● ● ● ● ● ● ● ● ● ● ● ● ● ● ● ● ● ● ● ● ● ● ● ● ● ● ● ● ● ● ● ● ● ●● ● ● ● ●● ● ● ●● ●● ● ● ● ● ● ● ● ●● ● ● ● ● ● ● ● ●● ● ● ● ● ● ● ● ●● ● ● ● ● ● ● ● ● ● ● ● ● ● ●● ● ●● ● ● ● ● ● ● ● ●●● ● ● ● ● ● ● ● ●● ● ● ● ● ●● ● ● ● ● ● ● ●● ● ● ● ● ● ● ● ● ● ● ● ● ● ● ● ● ● ● ● ● ● ● ● ● ● ● ● ● ● ● ● ● ● ● ● ● ● ● ● ● ● ● ● ● ● ● ● ● ● ● ● ● ● ● ● ● ● ● ● ● ● ● ● ● ● ● ● ● ● ● ● ● ● ● ● ● ● ● ● ● ● ●● ● ● ● ● ● ● ● ● ● ● ● ● ● ● ● ● ● ● ● ● ● ● ● ● ● ● ● ● ● ● ● ● ● ● ● ● ● ● ● ● ● ● ● ● ● ● ● ● ● ● ● ●● ● ● ● ● ● ● ● ● ● ● ● ● ● ● ● ● ● ●● ● ● ● ● ● ●● ●● ● ● ●● ● ● ●● ● ● ● ● ● ● ● ● ● ● ●● ● ● ● ● ● ● ● ● ● ● ● ● ● ● ●● ● ● ● ● ● ● ● ● ● ● ● ● ● ● ● ● ●● ● ● ●● ● ● ● ● ● ● ● ● ● ● ● ● ● ● ●●● ●● ● ● ● ● ●● ● ● ● ● ● ● ● ● ● ● ● ● ● ● ●● ● ● ● ●● ●● ●● ● ● ● ● ●● ●● ● ●● ● ● ●●●● ●● ●● ● ●● ● ● ● ● ●● ●● ●● ● ● ●● ● ● ●● ● ● ● ● ● ● ● ● ●● ● ● ● ● ● ●● ● ● ● ● ● ● ● ● ● ● ● ● ●● ● ● ● ●● ● ●●● ● ● ● ● ● ● ● ● ● ● ●● ● ● ● ● ● ● ● ● ● ● ● ● ● ● ● ● ●● ● ● ● ● ● ● ● ● ● ● ● ● ●● ● ● ● ● ● ● ● ● ● ● ● ● ● ● ● ● ● ● ● ● ● ● ● ● ● ● ● ● ● ● ● ● ● ● ● ● ● ● ● ● ● ● ● ● ● ● ● ● ●● ● ● ● ● ● ● ● ● ● ● ● ● ● ● ● ● ●● ● ● ● ● ● ● ● ● ● ● ● ● ● ● ● ● ● ● ● ● ● ● ● ● ● ● ● ● ● ● ● ● ● ● ● ● ● ● ●● ● ● ● ● ● ●● ● ● ● ● ● ● ● ● ● ● ● ● ● ● ● ● ● ● ● ● ● ● ● ● ● ● ● ● ● ● ● ● ● ● ● ● ● ● ●● ● ● ● ● ● ● ● ● ● ● ● ● ● ● ●●● ● ● ● ● ● ● ● ● ● ● ● ● ● ● ● ● ● ● ● ● ● ● ● ● ●● ●● ● ● ● ● ● ● ● ● ● ● ● ● ● ● ● ● ● ● ● ● ● ● ● ● ● ● ● ● ● ● ● ●● ● ● ● ● ● ●● ● ●● ● ● ●● ● ● ● ● ● ● ● ● ● ● ● ● ● ● ● ● ● ● ● ● ● ● ● ● ● ● ● ● ● ●● ● ●● ● ●●● ● ● ● ● ● ● ● ● ● ● ● ● ● ● ● ● ● ● ● ● ● ● ● ● ● ● ● ● ● ● ● ● ● ● ● ● ● ● ● ● ● ●● ● ● ● ● ● ● ● ● ● ● ● ● ● ● ● ● ● ● ● ● ● ● ● ● ● ● ● ● ● ● ● ● ● ● ● ● ● ● ● ● ● ● ● ● ●● ● ● ● ● ● ● ● ● ● ● ● ● ● ● ● ● ●● ● ● ● ● ● ● ● ● ● ● ● ●● ● ●● ● ● ● ● ● ● ● ● ● ● ● ● ● ● ● ● ● ● ● ● ● ● ● ● ● ● ●● ● ● ● ● ● ● ● ● ● ● ● ● ● ● ● ● ● ● ● ●● ● ● ● ● ● ● ● ●● ● ● ● ● ● ● ● ● ● ● ● ● ● ● ● ● ● ● ● ● ● ● ● ● ● ● ● ● ● ●● ● ● ● ● ● ● ● ● ● ● ● ● ● ● ●● ● ● ● ● ● ● ● ● ● ● ● ● ● ● ●● ● ● ● ● ● ● ● ● ● ● ● ● ● ● ● ● ● ● ● ● ● ● ● ● ● ● ● ● ●● ● ● ● ●● ● ● ● ● ● ● ● ● ● ● ● ● ● ● ● ●● ● ● ● ● ● ●● ● ● ● ●● ● ● ● ● ● ● ● ● ● ● ● ● ● ● ● ● ● ● ● ● ●● ● ● ● ● ● ● ● ●● ● ● ● ● ● ● ● ● ● ● ● ● ● ● ● ● ● ● ● ● ● ● ● ● ●● ● ● ●● ● ● ● ● ● ● ● ● ● ● ● ● ● ● ● ● ●● ● ● ●● ● ● ●● ● ● ● ● ● ● ● ● ● ● ● ● ● ● ● ● ● ● ● ● ● ● ●● ● ● ●● ● ● ● ● ● ● ● ● ● ● ● ● ● ● ● ● ● ● ● ● ● ● ●● ● ● ● ● ● ● ● ● ● ● ● ● ● ● ● ● ● ● ● ● ● ● ● ● ● ●● ● ● ● ● ●● ● ● ● ●● ●● ● ● ● ● ● ● ● ● ● ● ● ● ● ● ● ● ● ●● ● ● ●● ● ● ● ● ● ● ● ● ● ● ● ● ●● ● ● ● ● ● ● ● ● ● ● ● ● ● ● ● ● ● ● ● ● ● ● ● ● ● ● ● ● ● ● ● ● ● ● ● ● ●● ● ● ● ● ● ● ● ● ●● ●● ● ● ●● ● ● ● ●● ● ● ● ●● ● ● ● ● ● ● ● ● ● ●● ● ● ● ● ● ● ● ● ● ● ● ● ● ● ● ● ●● ●● ● ● ● ● ● ● ● ● ● ● ● ● ●● ● ● ● ● ● ● ● ● ● ● ● ● ● ●● ● ● ● ● ● ● ● ● ● ● ● ● ●● ● ● ● ● ● ● ● ● ● ● ● ● ● ● ● ● ● ●● ● ● ● ● ● ● ● ●● ● ● ● ●● ●● ● ● ● ● ● ● ●● ● ● ● ● ● ●● ● ● ● ● ● ● ● ● ●● ●● ● ● ● ● ● ● ● ● ●● ● ●● ● ● ● ●● ● ● ● ● ● ● ● ● ● ● ● ● ● ● ●● ●● ● ● ● ● ● ● ● ● ●● ● ●● ● ● ● ● ● ● ●● ● ● ● ● ● ● ● ●● ● ● ● ● ● ● ● ●● ● ● ● ● ● ● ● ● ● ● ● ● ● ● ● ● ● ● ● ● ● ● ● ● ● ● ● ● ●● ● ● ● ● ● ● ●● ● ● ● ●● ● ● ● ● ● ● ● ● ● ● ● ● ● ● ● ● ● ● ● ● ● ● ● ● ● ● ● ● ● ● ● ● ● ● ● ● ● ● ● ● ● ● ● ● ●●● ● ● ● ● ● ● ● ● ●● ● ● ● ● ● ● ● ● ● ● ● ● ● ● ● ● ● ● ● ● ● ● ● ● ● ● ● ● ● ● ● ● ● ● ● ● ● ● ● ● ● ●● ● ● ● ● ●● ●●● ● ●● ● ● ● ● ● ● ● ● ● ● ● ● ● ● ● ● ● ● ● ● ● ●● ● ● ● ● ● ● ● ● ● ● ● ● ● ● ● ● ● ● ● ● ● ● ● ● ● ● ● ● ● ● ● ● ● ●● ● ●● ● ● ● ● ● ● ● ● ● ● ● ● ● ● ● ● ● ● ● ● ● ● ● ● ● ● ● ● ● ● ● ● ● ● ● ● ● ● ● ● ● ● ● ● ● ● ● ● ● ● ● ●●●● ● ● ● ●● ●● ●●● ● ● ● ● ●●● ● ●● ●● ● ● ● ●●● ● ● ● ●● ● ●●● ● ●● ● ● ●● ● ● ● ● ● ●● ● ● ● ●●● ●● ● ● ●●●● ●● ● ● ●● ●● ● ● ● ● ● ● ● ● ●● ● ● ● ● ● ● ●● ● ●● ● ● ● ● ●● ● ● ● ●● ● ● ●● ●● ● ●● ● ● ●● ● ● ●● ●● ● ● ● ● ● ● ● ● ● ● ● ● ● ● ● ● ●● ● ● −0.02 p= 0.34 ●● ●● ● ● ● ●● ●●● ● ● ● ●●● ●●●● ●● ● ●● ● ● ● ● ● ● ●● ● ● ● ● ● ● ●● ● ● ● ● ● ● ● ●● ● ● ● ● ● ●●● ● ● ● ● ● ● ● ● ● ● ● ●●● ● ● ● ● ● ● ● ● ● ● ● ● ● ● ● ● ● ● ● ●● ● ●● ● ● ● ● ● ● ● ● ● ● ● ● ● ● ●● ● ● ● ● ● ● ● ● ● ● ● ● ● ● ● ● ● ● ● ● ● ● ● ● ● ● ● ● ●● ● ● ● ● ● ● ● ● ● ● ● ● ● ● ● ● ● ● ●● ● ● ● ● ● ● ● ● ● ● ● ● ● ● ● ● ● ● ● ● ● ● ● ● ● ● ● ● ● ● ● ● ● ● ● ● ● ● ● ● ● ● ●● ● ●● ● ● ● ● ● ●● ● ● ● ● ● ● ● ● ● ● ● ● ●● ● ● ● ● ● ● ● ● ● ●● ● ● ● ● ● ● ● ● ● ● ● ● ●● ● ● ● ● ● ● ● ● ● ● ● ● ● ●● ● ● ● ● ●● ● ● ● ● ● ●● ● ● ●● ● ● ● ● ● ● ● ● ● ● ● ● ● ● ● ● ● ● ●● ● ● ● ● ● ● ● ● ● ● ● ● ● ● ● ● ● ● ● ● ● ● ● ● ● ● ● ● ● ● ● ● ● ● ● ● ● ● ● ● ●● ● ● ● ● ● ● ● ● ●● ●● ●● ● ● ● ● ● ● ● ● ● ● ● ● ● ● ● ● ● ● ● ● ● ● ● ● ● ● ● ● ● ●● ●●● ●● ● ● ●● ● ● ● ● ●● ● ● ● ● ● ● ● ● ● ● ●● ● ● ● ● ● ●● ● ● ● ● ● ● ● ● ● ● ● ● ● ● ● ● ● ● ● ● ● ●● ● ● ● ● ● ● ● ●● ● ● ● ● ● ● ● ● ● ● ● ● ● ● ● ● ● ●● ● ●● ● ●● ● ● ●● ● ● ● ●● ●● ● ● ● ● ● ● ● ● ● ● ● ● ● ●● ● ● ● ● ● ●● ● ● ●● ● ● ● ● ● ● ● ● ● ● ● ● ●● ● ● ●● ●● ●●● ● ● ● ● ● ● ● ● ● ● ● ● ● ● ● ●● ● ● ● ● ● ● ● ● ● ● ● ● ● ● ● ● ● ● ● ● ● ● ● ● ● ● ● ● ● ● ● ● ●● ● ● ● ● ● ●●● ● ● ● ● ● ● ● ● ● ● ● ● ●● ● ● ● ● ● ● ● ● ●●●● ● ● ● ● ● ● ● ● ● ● ● ● ● ● ● ● ● ● ● ● ● ● ● ● ● ● ● ● ● ● ● ● ● ● ● ● ● ●● ● ●● ● ● ● ● ● ● ● ● ● ● ● ● ● ●● ● ● ● ● ● ●● ● ● ● ● ● ● ● ● ● ● ● ● ● ● ● ● ● ●● ●● ● ● ● ● ● ● ● ● ● ● ● ● ● ● ●●● ●● ● ● ● ●● ● ● ● ● ● ● ● ● ● ● ●● ● ● ● ● ● ● ● ● ● ● ● ● ● ● ● ● ● ● ● ● ● ● ● ● ● ● ● ● ● ● ● ● ● ● ● ● ● ● ● ● ● ● ● ● ● ● ● ● ● ● ● ● ● ● ●● ● ● ● ● ● ● ● ● ● ● ●● ●●● ● ● ● ● ● ● ● ● ● ● ● ● ● ●● ● ● ●● ● ● ● ● ● ● ● ● ● ● ●●● ● ● ● ● ● ● ● ● ●● ● ● ● ● ● ● ● ● ● ● ● ● ● ●● ● ● ● ● ●● ● ● ● ● ● ● ● ● ● ● ● ●● ● ●● ● ● ● ● ●● ●● ● ● ● ● ● ● ● ● ● ● ● ● ● ●● ● ● ●● ● ● ● ●● ● ● ● ● ● ● ● ● ●● ● ● ● ● ●● ● ● ● ● ● ● ●● ● ● ● ● ● ● ● ● ● ● ● ●● ● ● ●● ● ● ● ● ●● ● ●● ● ● ●● ●● ● ● ● ● ● ●● ● ● ● ●● ● ● ● ● ● ● ●● ● ● ● ● ● ● ● ● ● ● ● ● ● ● ● ● ● ● ● ● ●● ●●● ● ● ● ●● ●● ● ● ● ● ● ● ● ● ● ● ● ● ● ● ● ● ● ● ● ● ● ● ● ● ● ● ● ● ● ● ● ● ● ● ● ● ● ● ● ● ● ● ● ● ● ● ● ● ● ●● ● ● ● ● ● ● ● ● ● ● ● ● ● ●● ●●●●● ● ● ● ● ● ● ● ● ● ● ● ● ● ● ● ● ● ● ● ● ● ● ● ● ● ● ● ● ● ● ●● ● ● ● ● ● ● ● ● ● ● ● ● ● ● ● ● ● ● ● ● ● ● ● ● ● ● ●● ● ● ● ● ● ● ● ● ● ● ● ● ● ● ● ● ● ● ● ● ● ● ● ● ● ● ● ● ● ● ● ● ● ● ● ● ● ● ● ● ●●●● ●● ● ● ● ● ● ● ● ● ●● ● ● ● ● ● ●●● ● ● ● ● ● ● ● ●● ● ● ● ● ● ● ●● ● ● ● ● ● ● ● ● ●● ● ● ● ● ● ● ●● ●● ● ● ● ● ● ● ●● ● ● ●● ● ●●●● ● ● ● ● ● ●● ● ●● ●● ● ● ●●● ● ●●●● ● ● ●● ●● ● ●● ● ●● ●● ●●● ● ●●● ●● ● ●●● ● ● ● ● ●●● ● ●●● ● ● −0.08 r= −0.014 rain ● ● ●● 0.04 ●●● ●● ●● ●●● ● ● ● ● ● ●● ●● ●● ●● ● ● ● ● ●● ● ● ● ● ● ● ● ● ●● ● ● ● ● ● ● ● ● ● ● ● ●● ● ● ● ● ● ● ● ● ● ● ●● ● ● ● ● ● ● ● ● ●● ● ● ● ● ● ● ●●● ● ● ●● ●● ● ● ● ● ● ● ● ● ● ● ● ● ● ● ● ●●● ● ● ●● ● ● ● ● ● ● ● ● ●● ● ● ● ● ● ● ●● ● ● ● ● ● ● ● ● ● ● ● ●● ● ●● ● ● ● ● ● ● ●● ● ● ●● ● ● ● ● ● ● ● ●●● ● ● ●● ● ●● ● ● ● ● ●● ● ● ● ● ● ● ● ● ● ● ● ● ●● ● ● ● ● ● ● ●● ● ● ● ● ● ● ● ●●● ● ● ● ●● ●● ● ● ● ● ● ● ● ● ●● ●● ● ● ● ● ● ● ● ● ● ●● ● ● ●● ● ● ●● ● ● ● ● ● ● ● ● ● ● ●● ● ● ● ● ● ● ● ● ● ● ● ● ●● ● ● ● ● ● ● ● ● ● ● ● ●● ● ● ● ● ● ● ● ●● ●● ● ● ● ● ● ●● ● ● ● ● ● ●● ● ● ● ●● ● ● ● ● ● ● ● ● ● ● ● ● ● ● ● ●● ● ●● ●● ● ● ● ●● ●● ● ● ●● ● ● ● ● ● ● ● ● ● ● ● ● ● ● ● ● ●● ● ● ● ● ● ● ● ● ●● ● ●● ● ● ● ● ● ● ●● ● ● ● ●● ● ● ● ● ● ● ● ● ● ● ● ● ● ●● ● ● ● ●● ● ●● ● ● ● ● ● ● ●● ● ● ● ● ●● ● ● ● ●● ●● ● ● ● ● ● ● ● ● ● ● ● ● ● ● ● ●● ● ● ●● ● ●● ●● ●● ● ● ● ●● ● ● ●● ●● ● ● ●● ● ●● ● ●● ● ● ● ● ● ● ● ● ● ● ● ● ●● ● ●● ● ● ● ● ●● ● ● ● ● ●● ● ●● ● ● ● ● ● ● ● ● ● ● ● ● ●● ● ● ● ● ● ● ● ● ●● ● ● ●● ● ● ● ●● ● ●● ● ● ●● ●● ● ● ●● ● ● ●● ● ● ● ● ●● ●● ●● ● ● ● ●● ● ● ● ● ● ●● ● ●● ● ●● ● ● ● ●●● ● ● ●● ● ●● ● ●● ● ●● ● ● ● ● ● ● ● ● ● ● ● ● ●● ● ● ● ● ● ● ● ● ● ● ● ● ● ● ●●● ● ●● ● ● ● ● ● ● ● ● ● ●● ● ●● ● ● ●● ● ● ● ● ● ●● ● ● ●● ● ● ●●● ●● ● ● ● ● ● ● ● ● ● ● ● ● ● ● ● ●● ●● ● ● ● ● ● ● ● ● ●● ● ●● ● ● ● ● ● ● ● ● ● ●● ●●● ● ● ● ● ● ● ● ● ● ●● ● ● ● ● ●● ● ● ● ● ● ● ● ● ●● ● ● ● ● ● ● ● ● ● ● ● ● ● ● ● ● ● ● ● ●● ● ● ● ● ● ● ● ● ● ●● ● ●● ● ● ● ● ● ● ● ● ● ● ● ● ●● ● ● ● ● ● ●● ● ● ● ● ● ● ● ● ● ● ● ● ● ● ● ● ● ● ● ● ● ● ● ● ● ● ● ● ● ● ● ● ● ● ● ● ● ● ● ● ● ● ● ●●● ● ● ● ●● ● ● ● ● ●● ● ● ● ● ● ● ● ● ● ● ● ● ● ● ● ● ● ● ● ● ● ● ● ● ● ● ●● ● ● ● ● ● ● ● ● ● ● ● ● ● ● ●● ● ● ●● ● ● ● ● ● ●● ● ● ● ● ● ● ● ● ● ● ● ● ●● ● ● ●● ●● ●● ●● ● ● ● ● ● ● ● ● ● ●●● ● ● 0.2 ●● ● ● ● ● ●● ● ● ●● ● ● ● ● ● ● ● ●● ● ● ● ● ● ● ● ● ●● ● ● ● ● ● ●●●● ● ● ● ● ●●●● ● ●● ●●●● ● ●● ● ● ● ●● ● ● ● ● ●● ●● ● ●●● ● ● ● ● ● ● ●● ● ● ● ● ● ●● ●● ● ● ● ● ● ● ● ● ● ● ● ● ●● ● ● ● ● ● ●● ● ● ● ● ● ● ● ● ● ● ● ● ● ● ● ● ● ● ● ● ● ● ● ● ● ● ● ● ● ● ● ● ● ● ● ● ● ● ● ● ● ● ● ● ● ● ● ● ● ● ● ● ● ● ● ● ● ● ● ● ● ● ● ● ● ● ● ● ● ● ● ● ● ● ● ● ● ● ● ● ● ● ● ● ● ● ● ● ● ● ● ● ● ● ● ● ● ● ● ● ● ● ● ● ● ● ● ● ● ● ● ● ● ● ● ● ● ● ● ● ● ● ● ● ● ● ● ● ● ● ● ● ● ● ● ● ● ● ● ● ● ● ● ● ● ● ● ● ● ● ● ● ● ● ● ● ● ● ● ● ● ● ● ● ● ● ● ● ● ● ● ● ● ● ● ● ● ● ● ● ● ● ● ● ● ● ● ● ● ● ● ● ● ● ● ● ●● ● ● ● ● ● ● ●● ● ● ● ● ● ● ● ● ● ● ● ● ● ● ● ● ● ●● ● ● ● ● ● ● ● ● ● ● ● ● ● ● ● ● ●● ● ● ● ● ● ● ● ● ● ● ● ●● ● ● ● ●● ● ● ● ● ● ● ● ● ● ● ● ● ● ● ● ● ● ● ● ● ● ● ● ● ● ● ● ● ● ● ● ● ● ● ● ● ● ●● ● ● ● ● ● ● ● ● ● ● ● ● ● ● ● ● ● ● ● ● ● ●● ● ● ● ● ●● ● ● ● ● ● ● ●● ●● ● ● ● ● ● ● ● ● ● ● ● ● ● ● ● ● ● ● ● ● ● ● ● ● ● ● ● ● ● ● ● ● ● ● ● ● ● ● ● ● ● ● ● ● ● ● ● ● ● ● ● ● ● ● ● ● ● ● ● ● ● ● ● ● ● ● ● ● ● ● ● ● ● ● ● ● ● ● ● ● ● ●● ● ● ●● ● ● ● ● ● ● ● ●● ● ● ● ● ● ● ● ● ● ● ● ● ● ● ● ●● ● ● ● ● ● ● ● ● ● ● ● ● ● ● ● ● ● ● ● ● ● ● ● ● ● ● ● ● ● ● ● ● ● ● ● ● ● ● ● ● ● ● ● ●● ● ● ● ● ● ● ● ● ● ● ●● ● ● ● ● ● ● ● ● ● ● ● ●● ● ● ● ● ● ● ● ● ● ● ● ● ● ● ● ● ● ● ●● ● ● ● ● ● ● ● ● ● ● ● ● ● ● ● ● ● ● ● ● ● ● ● ● ● ● ● ● ● ● ● ● ● ● ● ● ● ● ● ● ● ● ● ● ● ● ● ● ● ● ● ● ● ● ● ● ● ● ●● ● ● ● ● ● ●● ●● ● ● ● ● ● ● ● ● ●●●● ● ● ● ● ● ●● ● ● ● ● ● ● ● ● ● ● ●● ● ● ● ● ● ● ● ● ● ● ●●● ● ● ● ● ● ● ● ● ● ● ● ● ● ● ● ● ● ● ● ● ● ● ● ● ● ● ● ● ● ● ● ● ● ● ● ● ● ● ●● ● ● ● ● ● ● ● ● ● ● ●● ● ● ● ● ● ● ● ● ● ● ● ● ● ● ● ● ● ● ● ● ● ● ● ● ● ● ● ● ● ● ● ● ● ● ● ● ● ● ● ● ● ● ● ● ● ●● ● ● ● ● ● ● ● ● ● ● ● ● ● ● ● ● ● ● ● ● ● ● ● ● ● ● ● ● ● ● ● ● ● ● ● ● ● ● ● ● ● ● ● ● ● ● ● ● ● ● ● ● ● ● ●● ● ● ● ● ● ● ● ● ● ● ● ● ● ● ● ● ● ● ● ● ● ● ●● ● ● ● ● ● ● ● ● ● ● ● ● ● ● ● ● ● ● ● ● ● ● ● ● ● ● ● ● ●● ● ● ● ● ● ● ●● ● ● ● ● ● ● ● ● ● ● ● ● ● ● ● ● ● ● ● ● ● ● ● ● ● ● ● ●● ● ● ● ● ● ● ● ● ● ● ● ● ● ● ● ● ● ● ● ● ● ● ● ● ● ● ● ● ● ● ● ● ● ● ● ● ● ● ● ● ● ● ● ● ● ● ● ● ● ● ●● ● ● ● ● ● ● ●●● ●● ● ● ● ● ● ● ● ●● ● ●●● ●●● ● ●● ● ● ● ● ●● ●● ●● ●●●● ●●● ● ●● ● ●● ●● ● ● ● ● ● ● ● ● share.irrigated −0.6 −0.2 0.2 Notes: Correlations were calculated using residual variation in the variables after removing the influence of district fixed effects and year fixed effects. Number of observations = 4,866. P values are listed below the correlation coefficients. 20 −0.2 ● ● ● ●● ● ● ●● ● ●●● ● ●● ●● ● ● ● ● ● ● ●● ●●● ● ● ● ●● ●●● ●● ● ● ●● ● ● ● ●● ● ● ● ● ● ● ● ● ● ● ● ● ● ● ● ● ● ● ● ● ● ● ● ● ● ● ●● ●● ● ● ● ● ● ● ● ● ● ● ● ● ● ● ●● ● ●● ● ● ● ● ● ● ● ● ● ● ● ● ● ● ● ● ● ● ● ● ● ● ● ● ● ● ● ● ● ● ●●● ● ● ● ● ● ● ● ● ● ● ● ● ● ● ● ● ● ● ● ● ● ● ● ● ● ● ● ● ● ● ● ● ● ● ● ● ● ● ● ● ● ● ●● ● ● ● ● ● ● ● ● ● ● ● ● ●●● ● ● ● ● ● ● ● ● ● ● ● ● ● ● ● ● ● ● ● ● ● ● ● ● ●● ● ● ● ● ● ● ● ● ●● ● ● ● ● ●● ● ● ● ● ● ● ●●● ● ● ● ● ● ● ● ● ● ● ● ● ● ● ● ● ● ● ● ● ● ● ● ● ● ● ● ● ● ● ● ● ● ● ● ● ● ● ● ● ● ● ● ● ● ● ● ● ● ● ● ● ● ● ● ● ● ●●● ● ● ● ● ● ● ● ● ● ● ● ● ● ● ● ● ● ● ● ● ●● ● ● ● ● ● ● ● ● ● ● ● ● ● ● ● ● ● ● ● ● ● ● ● ● ● ● ● ● ● ● ● ●● ● ● ●● ● ● ● ●● ● ●● ● ● ● ● ● ●●● ● ● ● ● ● ● ● ● ● ●● ● ● ●● ● ●● ● ● ● ● ● ● ● ● ● ● ● ● ● ● ● ● ● ●● ● ● ● ● ● ● ● ● ● ● ● ● ● ● ● ● ●● ● ● ● ● ● ● ● ● ● ● ● ● ● ● ● ● ● ● ● ● ● ● ● ● ●● ● ●● ● ● ● ● ● ● ● ● ● ● ● ●● ● ● ● ●● ● ● ● ●● ● ● ●● ● ● ● ● ● ● ● ●● ● ● ● ● ● ● ●● ● ● ● ● ● ● ● ● ● ● ● ●● ● ● ●● ● ● ● ● ● ● ● ●●● ● ● ● ● ● ● ● ● ● ● ● ● ● ● ● ● ●● ●● ● ● ● ● ● ● ●● ●● ● ● ● ● ● ● ●● ● ● ● ● ●● ● ● ● ● ● ● ● ● ● ● ● ● ● ● ●● ● ● ● ● ● ● ● ● ● ● ● ● ●● ● ● ● ● ● ● ● ● ● ● ● ● ● ● ● ● ● ● ● ● ● ● ● ● ● ● ● ● ● ● ● ● ● ● ● ● ● ● ● ● ● ● ● ● ● ● ● ● ● ● ● ● ● ● ● ● ●● ● ● ● ● ● ●● ●● ● ● ● ● ● ● ● ● ● ● ● ● ● ● ● ● ● ● ● ● ● ● ● ● ● ● ● ● ●● ● ● ● ● ● ● ● ● ● ● ● ● ● ● ● ● ● ● ● ● ● ● ● ● ● ● ● ● ● ● ● ● ● ● ● ● ● ● ● ● ● ● ● ● ● ● ● ● ● ● ● ● ● ● ● ● ● ● ● ● ● ● ●● ● ● ● ● ● ● ● ● ● ● ● ● ● ● ● ● ● ● ● ● ● ● ● ● ● ● ● ● ● ● ● ● ● ● ● ● ● ● ● ● ● ● ● ● ● ● ● ● ● ● ● ● ● ● ● ● ● ● ● ● ● ● ● ● ● ● ● ● ● ● ● ● ● ● ● ● ● ● ● ● ● ● ● ● ● ● ● ● ● ● ● ● ● ● ● ● ● ● ● ● ● ● ● ● ● ● ● ● ● ● ● ●● ● ● ● ● ● ● ● ● ● ● ● ● ● ●● ● ● ● ● ●● ● ● ● ● ● ● ● ● ● ● ● ● ● ● ●● ● ● ● ●● ●● ● ● ●● ● ●● ● ● ● ● ●● ● ● ● ● ● ● ● ●● ● ● ● ● ● ● ● ● ● ● ● ● ●● ● ●●● ● ● ● ● ●● ● ● −0.6 −20 20 60 ● 0.04 ● ● ● ● ●● ●● ● ● ● ● ● ●● ●●●● ● ● ●● ● ● ● ●● ● ● ● ● ● ● ● ● ● ● ●● ●●● ● ●● ● ● ● ●● ● ● ● ● ● ● ● ●●●● ● ● ● ● ●● ● ● ● ● ● ● ● ● ● ● ● ● ● ● ● ● ● ● ● ● ● ● ● ● ● ● ● ● ● ● ● ● ● ● ● ● ● ● ● ● ● ● ● ● ● ● ● ● ● ● ● ● ● ● ● ● ● ● ● ● ● ● ● ● ● ●● ● ● ● ● ● ● ● ● ● ● ● ● ● ● ● ● ● ● ● ● ● ● ● ● ● ● ● ● ● ● ● ● ● ● ● ● ● ● ● ● ● ● ● ●● ● ● ● ● ● ● ● ● ● ● ● ● ● ● ● ● ● ● ● ● ● ● ● ● ● ● ● ● ● ● ● ● ● ● ● ● ● ● ● ● ● ● ● ● ● ● ● ● ● ● ● ● ● ● ● ● ● ● ● ● ● ● ● ● ● ● ● ● ● ● ● ● ● ● ● ● ● ● ● ● ● ● ● ● ● ● ● ● ● ● ● ● ● ● ● ● ● ● ● ● ● ● ● ● ● ● ● ● ● ● ● ● ● ● ● ● ● ● ● ● ● ● ● ● ● ● ● ● ● ● ● ● ● ● ● ● ● ● ● ● ● ● ●● ● ● ● ● ● ● ● ● ● ● ● ● ● ● ● ● ● ● ● ● ● ● ● ● ● ● ● ● ● ● ● ● ● ●● ●● ● ● ● ● ● ● ● ● ● ● ● ● ● ● ● ● ● ● ● ● ● ● ● ● ● ● ● ● ● ● ● ● ● ● ● ● ● ● ● ● ● ● ● ● ● ● ● ● ● ● ● ● ● ● ● ● ● ● ● ● ● ● ● ● ● ● ● ● ● ● ● ● ● ● ● ● ● ● ● ● ● ● ● ● ● ● ● ● ● ● ● ● ● ● ● ● ● ● ● ● ● ● ● ● ● ● ● ● ● ● ● ● ● ● ● ● ● ● ● ●●● ● ● ● ● ● ● ● ● ● ● ●● ● ● ● ● ● ● ● ● ● ● ● ● ● ● ● ● ● ● ● ● ● ● ● ● ● ● ● ● ●● ● ● ● ● ● ● ● ● ● ● ● ● ● ● ● ● ● ● ● ●● ● ● ● ● ● ● ● ● ● ● ● ● ● ● ● ● ● ● ● ● ●● ● ● ● ● ● ● ● ● ● ● ● ● ● ● ● ● ● ● ● ● ● ● ● ● ● ● ● ● ● ● ● ● ● ● ● ● ● ● ● ● ● ● ● ● ● ● ● ● ● ● ● ● ● ● ●● ● ● ● ● ● ● ● ● ● ● ● ● ● ● ● ● ● ● ● ● ● ● ● ● ● ●● ● ● ● ● ● ●● ● ● ● ● ● ● ● ● ● ● ● ● ● ● ● ● ● ● ● ● ● ● ●● ● ● ● ● ●●●● ● ● ● ●● ● ● ● ● ● ● ●●●●●● ● ● ● ● ● ● ● ●●● ● ● ● ● ● ● ● ● ●● ●● ● ● ● ● ● ● ● ● ● ● ● ● ● ● ● ● ● ● ● ● ● ● ● ● ● ● ● ● ● ● ● ● ● ● ● ● ● ● ● ● ● ● ● ● ● ● ● ● ● ● ● ● ● ● ● ● ● ● ● ●● ● ● ● ● ● ● ● ● ● ● ● ● ● ● ● ● ● ● ● ● ● ● ● ● ● ● ● ● ● ● ● ● ● ● ● ● ● ● ● ● ● ● ● ● ● ●● ● ●● ● ● ● ● ● ● ● ● ● ●● ● ● ● ● ● ● ● ● ● ● ● ● ● ● ● ● ● ● ● ● ● ● ● ● ● ● ● ● ● ● ● ● ● ● ● ● ● ● ● ● ● ● ●● ● ● ● ● ● ● ● ● ● ● ●● ●●● ● ● ● ● ● ●● ● ● ● ● ● ● ● ● ● ● ● ● ● ● ● ● ● ● ● ● ● ● ●●● ● ● ● ● ● ● ● ● ● ● ● ● ● ● ● ● ● ● ● ● ● ● ● ● ● ● ● ●● ● ● ● ● ● ● ● ● ● ●● ● ● ● ● ● ● ● ● ● ● ● ● ● ● ● ● ● ● ● ● ● ● ● ● ● ● ● ● ● ● ● ● ● ● ● ● ● ● ● ● ● ● ● ● ● ● ● ● ● ● ● ● ● ● ● ●● ● ● ● ● ● ● ●● ● ●● ● ● ● ● ● ● ● ● ● ● ● ● ● ● ● ● ● ● ● ● ● ● ● ●● ● ● ● ● ● ● ● ● ● ●● ● ● ● ● ● ● ● ● ● ● ● ● ● ● ● ● ● ● ● ● ● ● ● ● ● ● ● ● ● ● ● ● ● ● ● ● ● ● ● ● ● ● ● ● ● ● ● ● ●● ● ● ● ● ● ● ● ●● ● ● ● ● ● ● ● ● ● ● ● ● ● ● ●● ● ● ● ● ● ● ● ● ● ● ● ● ● ● ● ● ● ● ● ● ● ● ● ● ● ● ● ● ● ● ● ● ● ● ● ● ● ● ● ●● ● ● ● ● ● ●● ● ● ● ● ● ● ● ● ● ● ● ● ● ● ● ● ● ● ● ● ● ● ● ● ● ● ● ● ● ● ● ● ● ● ● ● ● ● ● ● ● ● ● ● ● ● ● ● ● ● ● ● ● ● ● ● ● ● ● ● ● ● ● ● ● ● ●● ● ● ● ● ●● ● ● ● ● ● ● ● ●● ● ● ● ● ● ●●● ● ● ● ● ● ●●●● ● ● ● ● ● ● ● ● ● ● ● ● ● ●●●● ● ●● ● ● ●● ● ● ● ● ●●● ● ●●● ● ● ● ● ● ●● ● ● ● ●● ●● ● ● ● ● ● ●● ● ●● ● ● ●● ● ● ● ● ● ● ● ● ●● ● ● ● ● ●●● ● ● ● ● ● ●● ● ● ●● ● ● ● ●● ● ● ● ●● ● ●● ● ● ● ● ● ● ● ● ● log.sr −0.08 −0.02 −1.0 0.0 1.0 ● ● ● ● ● ● ● ●● ● ● ●●●● ● ●● ● ●● ● ●● ● ●●● ●● ● ●● ● ● ● ● ●● ● ● ● ● ● ● ● ●● ●● ● ● ● ● ●● ● ● ● ●● ● ● ● ● ● ● ● ●● ● ● ●● ●● ● ● ●● ● ● ● ● ● ● ● ● ● ● ●● ● ● ● ● ● ● ● ● ●● ● ●● ●● ● ●●● ● ●● ● ● ● ● ● ● ● ● ●● ● ● ● ● ● ● ● ● ● ● ●● ● ● ●● ● ● ●● ● ● ● ● ● ● ● ● ● ●● ● ● ● ● ● ● ● ●●● ● ● ●●● ● ● ● ●● ● ● ● ● ● ● ● ● ● ● ● ● ● ● ● ● ● ● ● ● ● ● ● ● ● ● ● ● ● ● ● ● ● ● ● ● ● ● ● ● ● ● ● ● ● ● ●● ● ● ● ● ●● ● ● ● ● ● ● ● ● ● ● ● ● ●● ● ● ●● ● ● ● ● ● ● ● ● ● ● ● ● ● ● ● ● ● ● ● ● ● ● ● ● ● ● ●●● ● ● ● ● ● ● ● ● ● ● ● ● ● ● ● ● ● ● ● ● ● ● ● ● ●● ● ● ● ● ● ● ● ● ● ● ● ● ● ● ● ● ● ● ● ● ● ● ● ● ● ● ● ● ● ● ● ● ● ● ● ● ● ● ● ● ● ● ● ● ● ● ● ● ● ● ● ● ● ● ● ● ● ● ● ● ● ● ● ● ● ● ● ● ● ● ● ● ● ● ●● ● ● ● ● ● ● ● ● ● ● ●● ● ● ● ● ● ● ● ● ● ● ● ● ● ● ● ● ● ● ● ● ● ●●● ● ● ● ● ● ● ● ● ● ● ● ● ● ● ● ● ● ● ● ● ● ● ● ● ● ● ● ● ● ● ● ● ● ● ● ● ● ● ● ● ● ● ● ● ● ● ● ● ● ● ● ● ● ● ● ● ●● ● ● ● ● ● ● ● ●● ● ● ●● ● ● ● ● ● ● ● ● ● ● ● ● ● ● ● ● ● ● ● ● ● ● ● ● ● ● ● ● ● ●●● ●● ● ● ● ● ● ● ● ● ● ● ● ● ● ● ● ● ● ● ● ● ● ● ● ● ● ● ● ● ● ● ● ● ● ● ● ● ● ● ● ● ● ● ● ● ● ● ● ● ● ● ● ● ● ● ● ● ● ● ● ● ● ● ● ● ● ● ● ● ● ● ● ● ● ● ● ● ● ● ● ● ● ● ● ● ● ● ● ●● ● ● ● ● ● ● ● ● ● ● ● ● ● ● ● ● ● ● ● ●● ● ●● ● ● ● ● ● ● ● ● ● ● ● ● ● ● ● ● ● ● ● ● ● ● ● ● ● ● ● ● ● ● ● ● ● ● ●● ●● ● ● ● ● ● ●●●● ● ● ● ● ● ● ● ● ● ● ● ● ● ● ● ● ● ● ●● ● ● ● ● ● ● ● ● ● ● ● ● ● ● ● ● ● ● ● ● ● ● ● ● ● ● ● ● ● ● ●●● ● ● ● ● ● ● ● ● ● ● ● ● ● ● ● ● ● ● ● ● ● ● ● ● ● ● ● ● ● ● ● ● ● ● ● ● ● ● ● ● ● ● ● ● ● ● ● ● ●● ● ● ● ● ● ● ● ● ● ● ● ● ● ● ● ● ● ● ● ● ● ● ● ● ● ● ● ●● ● ● ● ●● ● ● ● ● ● ● ● ● ● ●● ● ● ● ● ● ● ● ● ● ● ● ● ● ● ● ●●● ● ● ● ● ● ● ● ● ● ● ● ● ● ● ● ● ● ● ● ● ● ● ● ● ● ● ● ● ● ● ● ● ● ● ● ● ● ● ● ● ● ● ● ● ● ● ● ● ● ● ● ● ● ● ● ● ● ● ● ● ● ● ● ● ● ● ● ● ● ● ● ● ● ● ● ● ● ● ● ● ● ● ● ● ● ● ● ● ● ● ● ● ● ● ● ● ● ● ● ● ● ● ● ● ● ● ● ● ● ● ● ● ● ● ● ● ● ●● ● ● ● ● ● ● ● ● ● ● ● ● ● ● ● ● ● ● ● ● ● ● ● ● ● ● ● ● ● ● ● ● ● ● ● ● ● ● ● ● ● ● ● ● ● ● ● ● ● ●● ● ● ● ● ● ● ● ● ● ● ● ● ● ● ● ● ● ● ● ● ● ● ● ● ● ● ● ● ●● ● ● ● ● ● ● ● ● ● ● ● ● ● ● ● ● ● ● ● ● ● ● ● ● ● ● ● ● ● ● ● ● ● ● ● ● ● ● ● ● ● ● ● ● ● ● ● ● ● ● ● ● ● ● ● ● ● ● ● ● ● ● ● ● ●● ● ● ● ● ● ● ● ● ● ● ● ● ●● ● ● ● ● ● ● ● ● ● ● ● ● ● ● ● ● ● ● ● ● ● ● ● ● ● ● ● ● ● ● ● ●● ● ● ● ● ● ● ● ● ● ● ● ● ● ● ● ● ● ● ● ● ● ● ● ● ● ● ● ● ● ● ● ● ● ● ● ● ● ● ● ● ● ● ● ●● ● ● ● ● ● ● ● ● ● ● ● ● ● ● ● ● ● ● ● ● ● ● ● ● ● ● ● ● ● ● ● ● ● ● ● ● ● ● ● ● ● ● ● ● ● ● ●● ● ● ● ● ● ● ● ● ● ● ● ● ● ● ● ● ● ● ● ● ● ●● ● ● ● ● ● ● ● ● ● ● ● ● ● ● ● ● ● ● ● ● ●● ● ● ● ● ● ● ● ● ● ● ●● ● ●● ● ● ● ● ● ● ● ● ● ● ● ● ● ● ● ● ● ● ● ● ● ● ● ● ● ● ● ● ● ● ● ● ● ● ● ● ● ● ● ● ● ● ● ● ● ●● ● ● ● ● ● ● ● ● ● ● ● ● ● ● ● ● ● ● ● ● ● ● ● ● ● ●● ● ● ● ● ● ● ● ● ● ● ● ● ● ● ● ● ● ● ● ● ● ● ● ● ● ● ● ● ● ● ● ● ● ● ● ● ● ● ● ● ● ● ● ●● ● ● ● ● ● ● ● ● ● ● ● ● ● ● ● ● ● ● ● ● ● ● ● ● ● ● ● ● ● ● ● ● ● ● ● ● ● ● ● ● ● ● ● ● ●● ● ● ● ● ● ● ● ● ● ●● ● ● ● ● ● ● ●●● ● ● ● ● ● ● ●● ● ● ● ● ● ● ● ● ●● ● ● ● ● ● ● ● ● ● ● ● ● ● ● ● ● ● ● ● ● ● ● ● ● ● ● ● ● ● ● ● ● ● ● ● ● ● ● ● ● ● ●●● ● ● ●● ● ● ● ●● ● ● ● ● ● ● ● ● ● ● ● ● ● ● ● ● ● ● ● ● ● ●●●● ● ● ● ● ● ● ● ● ● ●● ● ● ●● ● ● ● ● ● ● ● ● ● ● ● ● ● ● ● ● ● ● ● ● ● ● ● ● ●● ● ● ● ● ● ● ● ● ● ● ● ● ●● ● ● ● ● ● ● ● ● ● ● ● ● ● ● ● ● ● ● ● ● ● ●● ● ● ● ● ● ● ● ● ● ● ●● ● ● ● ● ● ● ● ● ● ● ● ● ● ● ● ● ● ● ● ● ● ● ●● ● ● ● ● ● ● ● ● ● ● ● ● ● ● ● ● ● ● ● ● ● ● ● ● ● ● ● ●● ● ● ● ● ● ●● ● ● ● ● ● ● ● ● ● ● ● ● ●● ● ●● ●● ● ● ●● ●● ● ● ● ●● ●● ● ● ● ● ● ● ●● ● ● ●● ● ● ●● ● ●● ●● ● ● ● ● ● ●●● ● ●●● ● ●● ●● ●●●● ●● ● ● ● ● ● ● ● ●● ● ●● ● References Asseng, S., Foster, I. and TURNER, N. C. (2011). The impact of temperature variability on wheat yields, Global Change Biology 17(2): 997–1012. Conley, T. G. (2008). spatial econometrics, in S. N. Durlauf and L. E. Blume (eds), The New Palgrave Dictionary of Economics, Palgrave Macmillan, Basingstoke. Dhakhwa, G. B. and Campbell, C. L. (1998). Potential effects of differential day-night warming in global climate change on crop production, Climatic Change 40(3-4): 647– 667. Giorgi, F., Coppola, E., Solmon, F., Mariotti, L., Sylla, M., Bi, X., Elguindi, N., Diro, G., Nair, V., Giuliani, G. et al. (2012). Regcm4: model description and preliminary tests over multiple cordex domains, Climate Research 2: 7. Guiteras, R. (2009). The impact of climate change on indian agriculture, Manuscript, Department of Economics, University of Maryland, College Park, Maryland . Harrell, F. E. (2001). Regression modeling strategies: with applications to linear models, logistic regression, and survival analysis, Springer. Hsiang, S. M. (2010). Temperatures and cyclones strongly associated with economic production in the caribbean and central america, Proceedings of the National Academy of Sciences 107(35): 15367–15372. Jenner, C. (1991). Effects of exposure of wheat ears to high temperature on dry matter accumulation and carbohydrate metabolism in the grain of two cultivars. i. immediate responses, Functional Plant Biology 18(2): 165–177. Lobell, D. B. and Ortiz-Monasterio, J. I. (2007). Impacts of day versus night temperatures on spring wheat yields, Agronomy Journal 99(2): 469–477. Lobell, D. B., Ortiz-Monasterio, J. I., Asner, G. P., Matson, P. A., Naylor, R. L. and Falcon, W. P. (2005). Analysis of wheat yield and climatic trends in mexico, Field crops research 94(2): 250–256. Lobell, D. B., Schlenker, W. and Costa-Roberts, J. (2011). Climate trends and global crop production since 1980, Science 333(6042): 616–620. Parry, M. L. (2007). Climate Change 2007: Impacts, Adaptation and Vulnerability: Working Group II Contribution to the Fourth Assessment Report of the IPCC Intergovernmental Panel on Climate Change, Vol. 4, Cambridge University Press. Rane, J. and Nagarajan, S. (2004). High temperature index—for field evaluation of heat tolerance in wheat varieties, Agricultural Systems 79(2): 243–255. 21 Ray, D. K., Mueller, N. D., West, P. C. and Foley, J. A. (2013). Yield trends are insufficient to double global crop production by 2050, PLOS ONE 8(6): e66428. Rosenzweig, C. and Tubiello, F. N. (1996). Effects of changes in minimum and maximum temperature on wheat yields in the central us a simulation study, Agricultural and Forest Meteorology 80(2): 215–230. Schlenker, W. and Roberts, M. J. (2009). Nonlinear temperature effects indicate severe damages to us crop yields under climate change, Proceedings of the National Academy of Sciences 106(37): 15594–15598. Sofield, I., Evans, L., Cook, M. and Wardlaw, I. (1977). Factors influencing the rate and duration of grain filling in wheat, Australian Journal of Plant Physiology 4. Stone, C. J. (1986). [generalized additive models]: Comment, Statistical Science 1(3): 312– 314. Stone, P. and Nicolas, M. (1998). Comparison of sudden heat stress with gradual exposure to high temperature during grain filling in two wheat varieties differing in heat tolerance. i. grain growth, Functional Plant Biology 22(6): 935–944. Wardlaw, I. and Moncur, L. (1995). The response of wheat to high temperature following anthesis. i: The rate and duration of kernel filling, Australian journal of plant physiology 22(3): 391–397. Welch, J. R., Vincent, J. R., Auffhammer, M., Moya, P. F., Dobermann, A. and Dawe, D. (2010). Rice yields in tropical/subtropical asia exhibit large but opposing sensitivities to minimum and maximum temperatures, Proceedings of the National Academy of Sciences 107(33): 14562–14567. 22
Baixar