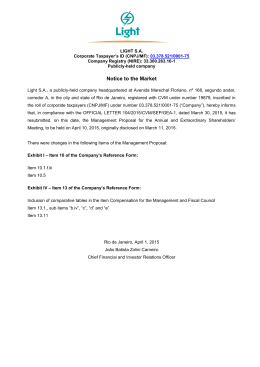
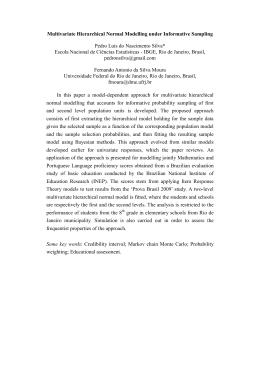
Delivering Long-Term Shareholder
Value
9 October 2014, Perth
2
Cautionary statement
This presentation has been prepared by Rio Tinto plc and Rio Tinto Limited (“Rio Tinto”) and consisting of the slides for a
presentation concerning Rio Tinto. By reviewing/attending this presentation you agree to be bound by the following conditions.
Forward-looking statements
This document contains certain forward-looking statements with respect to the financial condition, results of operations and
business of the Rio Tinto Group. These statements are forward-looking statements within the meaning of Section 27A of the US
Securities Act of 1933, and Section 21E of the US Securities Exchange Act of 1934. The words “intend”, “aim”, “project”,
“anticipate”, “estimate”, “plan”, “believes”, “expects”, “may”, “should”, “will”, “target”, “set to” or similar expressions, commonly
identify such forward-looking statements.
Examples of forward-looking statements include those regarding estimated ore reserves, anticipated production or construction
dates, costs, outputs and productive lives of assets or similar factors. Forward-looking statements involve known and unknown
risks, uncertainties, assumptions and other factors set forth in this presentation that are beyond the Rio Tinto Group’s control.
For example, future ore reserves will be based in part on market prices that may vary significantly from current levels. These may
materially affect the timing and feasibility of particular developments. Other factors include the ability to produce and transport
products profitably, demand for our products, changes to the assumptions regarding the recoverable value of our tangible and
intangible assets, the effect of foreign currency exchange rates on market prices and operating costs, and activities by
governmental authorities, such as changes in taxation or regulation, and political uncertainty.
In light of these risks, uncertainties and assumptions, actual results could be materially different from projected future results
expressed or implied by these forward-looking statements which speak only as to the date of this presentation. Except as required
by applicable regulations or by law, the Rio Tinto Group does not undertake any obligation to publicly update or revise any forwardlooking statements, whether as a result of new information or future events. The Group cannot guarantee that its forward-looking
statements will not differ materially from actual results.
©2014, Rio Tinto, All Rights Reserved
3
Competent Persons Consent Statements
Mineral Resources and Ore Reserves
Mineral Resources and Ore Reserves presented in this document are sourced from Rio Tinto Annual Reports from 2001
through to 2013.
Exploration Targets
The information in this report that relates to the Pilbara Exploration Targets is prepared by Mr Bruce Sommerville who is
a Fellow of the Australian Institute of Mining and Metallurgy. Mr Sommerville is a full-time employee of Rio Tinto Iron Ore
and has experience which is relevant to the style of mineralisation and type of deposits under consideration and to the
activity which they have undertaken to qualify as a Competent Person as defined in the 2012 Edition of the ‘Australasian
Code for Reporting of Exploration Results, Minerals Resources and Ore Reserves’. Mr Sommerville consents to the
inclusion in the report of the matters based on their information in the form and context in which it appears.
©2014, Rio Tinto, All Rights Reserved
4
Extending our competitive advantage
World-class assets, seamless
supply chain, unencumbered
optionality
Product blend &
specialist marketing
capture full value
Driving industry-leading margins
supported by automation,
innovation and technology
Continued proven delivery of
world-class projects
Rio Tinto is maximising sustainable shareholder value
©2014, Rio Tinto, All Rights Reserved
5
Brownfields mine development – one of many
examples of value maximisation
• Maximising value is part of our DNA
• The 360Mt/a expansion is not
tonnage but value-driven
• Chase outcomes that offer greatest
value, for example protection of
premium Pilbara Blend products
West Angelas Stacker 3
• ~40Mt/a of brownfield mine projects
approved and in implementation
• Average mine production capital
intensity less than $15/t
Yandicoogina overland conveyor
©2014, Rio Tinto, All Rights Reserved
6
Long-term iron ore fundamentals remain robust
China’s crude steel production forecast (Mt/a)
• China is forecast to reach ~1Bt
of crude steel production by
around 2030
1,200
1,000
800
600
• Driven by exports of
manufactured goods and
replacement demand
400
200
0
2010
2015
2020
2025
2030
Total iron ore demand projections (Mt/a)
3,500
3,000
2,500
• Other contestable iron ore
markets likely to develop over
the coming decades including
India, the Middle East and the
ASEAN countries
2,000
1,500
1,000
500
0
2010
China JKT
• Iron ore demand growth will be
driven by emerging economies
which have more than 80% of
the world’s population
2015
EU27
India
2020
ASEAN
Source: Rio Tinto
2025
Middle East
2030
Other
©2014, Rio Tinto, All Rights Reserved
7
Uniquely positioned to capture value
enhancing growth
•
Industry supply response to date commensurate with attractive fundamentals
•
Fourth quartile tonnes are now being displaced
•
Rio Tinto’s resource, cost and market position drive sustainable long-term value from
production growth
•
Pilbara expansion delivers compelling incremental and absolute value
2020 Industry cost curve
2010 Industry cost curve
RTIO Pilbara
$/wmt CFR
200
150
150
100
100
50
50
0
RTIO Pilbara
$/wmt CFR
200
2
0
0
500
1000
1500
2000
Mt/a
0
500
1000
1500
Cumula
Source: Rio Tinto, Wood Mackenzie
Note: Includes shipping and sustaining capital expenditure and is adjusted for inflation and FX.
2020 cost curve based on 2014 real data
2000 Mtpa
Mt/a
©2014, Rio Tinto, All Rights Reserved
8
Industry-leading cash costs and margins
RTIO- Pilbara cash unit cost / EBITDA
margin
(US$ per tonne)
•
Our low cost advantage has been sustained
over many years
•
•
H1 2014 cash unit cost of US$20.40/t
(11% lower than H1 2013)
•
Maintain consistent and attractive
margins (66% in H1 2014)
An embedded culture of cost discipline
•
•
A ‘cash generation office’ active since
the 2008, drives cost and productivity
focus
•
Over 200 individually tracked cost
reduction and productivity improvement
projects
Sustainable position as the most
profitable producer in the Pilbara
©2014, Rio Tinto, All Rights Reserved
9
Pilbara longevity through leading resources and
reserves
Exploration Targets
2
Pilbara resources, reserves and production1
• Billion tonnes (Dry)
• Million tonnes (Dry)
50
20000
300.0
18000
40
30
20
250.0
16000
10
0
14000
2007
200.0
12000
2008
2009
2010
2011
Exploration Target (±50%)
2013
Resource Development Drilling
150.0
8000
100.0
6000
4000
50.0
2000
0
-
Proven
Probable
Measured
Indicated
Inferred
Production
• Metres
800,000
700,000
600,000
500,000
400,000
300,000
200,000
100,000
0
2002
2003
2004
2005
2006
2007
2008
2009
2010
2011
2012
2013
2014
2015
2016
2017
2018
2019
10000
Actual Drill (m)
1
Mineral Resource and Ore Reserves are reported in dry metric tonnes, and are
reported on a 100% basis, Mineral Resources are reported exclusive of Ore Reserves.
Details of the Mineral Resources and Ore Reserves from 2001 to 2013 are found in the
Rio Tinto Annual Reports
Planned Drill (m)
2
Exploration Targets. Rio Tinto Iron Ore has extensive ground holding within the
Pilbara which has been broadly assessed by various exploration methods including
mapping, geophysical sensing and drill hole sampling. There has been insufficient
exploration and analysis to estimate a Mineral Resource and that the potential quantity
and quality is conceptual in nature and it is uncertain if further exploration will result in
the estimation of a Mineral Resource. Grades range from 50% Fe to 62% Fe.
©2014, Rio Tinto, All Rights Reserved
10
360Mt/a infrastructure on time and budget
• 75% complete
• All 360Mt/a marine and wharf works
complete
• Port B shiploader, stacker and
reclaimer commissioned early
Cape Lambert car dumpers 5, 6 & 7
• First ore through car dumper 7
ahead of schedule
• All rail works complete, including
AutoHaul® wayside works
• First autonomous AutoHaul® journey
complete
Cape Lambert 360Mt/a shiploader first ore
©2014, Rio Tinto, All Rights Reserved
11
Operations Centre integral to capturing
innovation benefits
• Value derived from real-time
optimisation of production,
maintenance and logistics:
− Revised car dumper timing and
additional consist provide extra
~4Mt over 2014 and 2015
− OC optimises the system to
ensure no lost tonnes from
major conveyor belt rip
Control room, Operations Centre
Automation
and autonomy
• Change in mindset and culture to
ensure continued innovation
Big data
and
analysis
Mine of the
Future™
• Rio Tinto continues leading-edge
advantage with key partners
Smart people,
smart
operations
©2014, Rio Tinto, All Rights Reserved
12
Iron ore supply and pricing
•
Iron ore prices have declined throughout 2014 due to increased supply
•
Market mechanisms are playing out with ~ 125Mt of high cost global iron ore
supply likely to exit the market in 2014
•
Crude steel production continues to run at healthy levels
•
We continue to witness consistently high demand for Rio Tinto iron ore products
across varied market conditions
Iron ore spot and forward prices
($/dmt, CFR China)
Annualised global crude steel production
(Mt)
1,000
190
China
Spot Historical
170
Forward (SGX)
Japan+Korea+Taiwan
N.America
800
Rest of World
150
EU
600
EU (15)
130
400
110
200
90
70
Oct-10
Jun-11
Feb-12
Source: Platts, SGX
Oct-12
Jun-13
Feb-14
Oct-14
Jun-15
0
2003
2004
2006
2008
2009
2011
2013
Source: WSA, RTIO Analysis, Mysteel
©2014, Rio Tinto, All Rights Reserved
13
Long-term fundamentals for Chinese iron ore
demand remain strong
China’s crude steel production forecasts
(Mt/a)
1,200
1,000
•
Iron ore demand growth is inextricably
linked to the development pathway of
emerging economies where more than
80% of the world’s population resides
•
China’s growth story is set to continue
albeit at more modest rates than
witnessed over the past decade
•
As China continues to develop, less
steel will be required for domestic stock
accumulation - particularly in buildings
and infrastructure - with more steel
required for stock upgrading and exports
of manufactured goods
•
China is forecast to reach ~1Bt of crude
steel production by around 2030
For exported goods
Replacement domestic demand
New domestic demand
800
600
400
200
0
2010
2015
2020
2025
2030
Source: Rio Tinto
©2014, Rio Tinto, All Rights Reserved
14
Pilbara Blend products are the basis of our
expansions
Product
Strengths
H1 2014 %
Pilbara Blend
Fines
• Consistent quality
• ~45%
(61.5% Fe, 8.5% H2O)
Pilbara Blend
Lump
• The most marketed iron ore product globally
• Base load sinter blend in Asian markets
• Avoids the costs of sintering which will increase • ~25%
with increasing emissions legislation
(62.5% Fe, 4% H2O)
HIY Fines
(58.5% Fe, 9% H2O)
• Ideal chemical composition for the Asian sinter • ~20%
blends, with low alumina and phosphorus
• Coarse sizing aids sinter granulation
©2014, Rio Tinto, All Rights Reserved
15
The integration of marketing and operations
maximises portfolio value
H1 2014 products by market
%
• Product offering and customer
segmentation drives our mine
development and production planning
100%
90%
80%
• RTIO Technical Marketing works with
customers, researchers and
universities to maximise the value-inuse of our products
70%
60%
50%
40%
• Pilbara Blends are the most marketed
and commercially liquid ores in the
market
30%
20%
10%
0%
China
PBF
Japan
PBL
RRF
Korea, Taiwan
RRL
HIY
Atlantic
Conc.
Other
Pellets
• Reported spot transactions highlight
that Pilbara Blend Fines consistently
achieve a premium over the Platts
62% Fe index
©2014, Rio Tinto, All Rights Reserved
16
Marketing strategies which maximise value
2014 Pilbara offtake agreements by pricing
mechanisms
Spot
15%
• Rio Tinto’s customer portfolio is
focused on long term contracts with
large mills that have substantial
offtake capability
Q Actual
5%
Monthly
55%
Q Lagged
25%
• Rio Tinto has built a reputation for
consistent quality and supply which
supports our marketing strategy
• Of our 2014 volume:
• ~85% will be sold under term
contracts
• ~15% uncontracted for sale into the
spot market, in support of liquid and
transparent indices
©2014, Rio Tinto, All Rights Reserved
17
Strong relationships enable supply chain
optimisation
Pilbara shipments to Japan and China (Mt)
1 billionth tonne shipped to China
•
Since 1966 Rio Tinto has shipped over
3Bt to Japan and China
•
Continuing partnerships with Japan,
including the Robe River joint venture,
remain central to our business
•
The Channar Joint Venture was
established in 1987 and has delivered
over 200Mt to China
•
The Bao-HI Joint Venture was
established in 2002 and has delivered
over 130Mt to China
•
Partnerships allow Rio Tinto to improve
sales processes and lower transaction
and administration costs
200
150
100
1 billionth tonne shipped to Japan
50
1966
1968
1970
1972
1974
1976
1978
1980
1982
1984
1986
1988
1990
1992
1994
1996
1998
2000
2002
2004
2006
2008
2010
2012
0
Shipments on a 100% basis and includes all Pilbara operations
controlled by Rio Tinto.
©2014, Rio Tinto, All Rights Reserved
18
Take-aways
• Iron ore market fundamentals remain robust
• Rio Tinto’s resource, integrated logistics and marketing drives sustainable longterm value
• Rio Tinto will protect margins by remaining the world’s lowest cost major producer
• Commitment to technology and innovation is key to Rio Tinto’s competitive edge
• Pilbara Blend delivers sustained premiums and creates additional value
• Pilbara 360Mt/a delivers compelling and resilient project economics
©2014, Rio Tinto, All Rights Reserved
Operations Centre
Investor visit
9 October 2014
20
A strategically important project
•
Concept originated through RTIO’s Industry Leadership Programme.
•
Business context: growth, volatility, complexity - needed a more responsive
organisation.
•
Decision made to establish an integrated planning function and an Operations
Centre.
OB1
OB2
Control
Room
©2014, Rio Tinto, All Rights Reserved
21
Operations Centre
Optimising System Plans and Performance
Mines
Plants
Rail
Ports
Utilities
Centralised Control Room
Operational
Whole of System Visibility
Excellence
Improved access to
information
OPERATIONS
CENTRE
BENEFITS
System Performance
Better, smarter, faster
Collaboration
decision making
Operations Support
Rapid Replication
Integrated Planning and Scheduling
Mining
Processing
Quality
Logistics
Asset Mgt
Whole of Business Planning
©2014, Rio Tinto, All Rights Reserved
22
There are 4 key managerial functions, all with strong
linkages to Site Operations
Dynamic Scheduling
• Better, smarter faster
decisions
• Focus on tonnes and
quality
• Optimising the whole
value chain
Controllers
• Local people
leadership and
training
• Driving controller
improvement &
standardisation
Production Systems
Next Generation
• Day to day systems
support
• Business process
redesign
• System improvement
projects
• Interface
standardisation
• Capital program
management
• Delivery Plan coordination
• Control Room team
dynamic/culture
• Business Improvement
co-ordination
Site Operations
• Continue to make operational decisions
• Retain accountability for health and safety
• Site knowledge and expertise
©2014, Rio Tinto, All Rights Reserved
Control Room layout
Rail
Ports & Dynamic
Scheduling
Mining & Plants
24
Control, Monitor and Optimise (Pit to Port)
The Control team has three main functions to ensure safe tonnes are delivered to our
customers on time, at the right cost
• Monitor production rates and control set points
• Minimise performance loss by active communication and coordination during system
outages
• Collaborate across functions and sites to provide better, faster and smarter decisions
to optimise system performance
Control
Monitor
Optimise
©2014, Rio Tinto, All Rights Reserved
25
The Control Room has evolved over time
• Roles moved to Perth from the Pilbara
Control Room
Stabilised
Multi skill &
optimise
New
Technology
• Dynamic Constraint Utilisation, Controller Role consolidation, Brockman 4 TLO, Asset Health,
Rail Maintenance Alignment, Business Resilience, SCADA Standardisation
• Multi-skilling of Pit & Plant roles, Control System automation, Loco GPS, Electronic Train
graphing, Advanced collaborative environments, Remote Assist (MATE), Wireless Mesh
• Autonomous Drilling, Autonomous Trucks, Autonomous Trains
Automation
• Next Gen, Transformation of people and processes, Big Data, Automation
Future
©2014, Rio Tinto, All Rights Reserved
26
Operations Centre summary
• The nerve centre of the Pilbara integrated network, seamlessly bringing it all together
• Full end to end visibility means the entire system is optimised
• Comprehensive insight into system bottlenecks, improvement efforts and reduction and
avoidance of costs
• Enormous future potential
This is just the beginning…
©2014, Rio Tinto, All Rights Reserved
Download