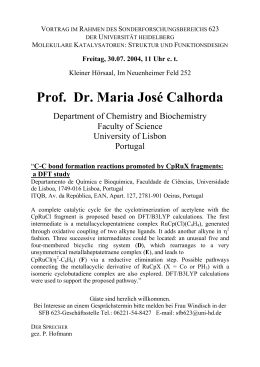
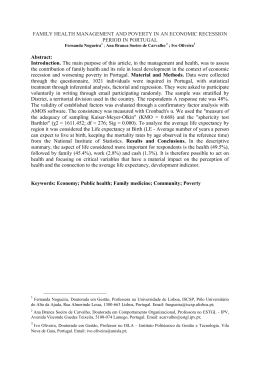
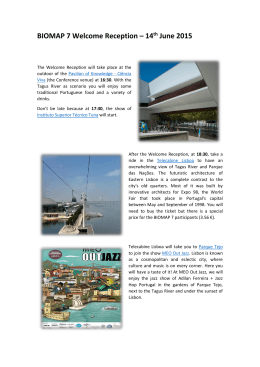
Natural Hazards 31: 587–601, 2004.
© 2004 Kluwer Academic Publishers. Printed in the Netherlands.
587
Some Morphological Aspects and Hydrological
Characterization of the Tagus Floods in the
Santarém Region, Portugal
T. M. AZEVÊDO1, E. NUNES1 and C. RAMOS2
1 Centro de Geologia, Faculdade de Ciências, Universidade de Lisboa, Ed. C2, 5◦ Piso, Campo
Grande, 1749-016 Lisboa, Portugal (E-mail: [email protected]/[email protected]); 2 Centro
de Estudos Geográficos, Alameda da Universidade, Faculdade de Letras, 1600-214 Lisboa,
Portugal (E-mail: [email protected])
(Received 1 July 2000; accepted 18 November 2002)
Abstract. In Portugal, few studies have been made of the historical floods of the River Tagus (the
longest in the Iberian Peninsula). This fact led to the study of the Lower Tagus (Santarém region)
using written historical documents, cartographic documents and hydrological data, consisting mainly
of water level records. With the support of the historical documents and the analysis of all the maps,
it was possible to verify that human intervention has been fundamental in the morphological changes
of the Tagus’ channel. The river changed from a braided to a single channel with alternate bars.
From the hydrological data, return periods for the floods were determined, using the Pearson Type
3 distribution. The selection of the most important floods, from 1855 to 1998, enabled us to build a
“flood hazard scale” for this region.
Key words: Tagus river, historical floods, flood hazard
1. Introduction
The Tagus has been studied by different organisations, governmental (LNEC –
National Laboratory of Civil Engineering and INAG – National Water Institute)
and private (HP – Portuguese Hydrotechniques), regarding its hydrological aspects.
However, due to the 1755 earthquake, which destroyed almost the entire city
of Lisbon and to the great fire, which destroyed Lisbon’s National Archive in
1919, records are few. To remedy this, all the available types of documents, from
historical ones to newspapers, were collected and examined. Their study has led to
a better knowledge of the Tagus’ behaviour – past and present.
The Tagus is the longest river in the Iberian Peninsula (1,110 km) and drains an
area of 80,630 km2 , of which 57,770 km2 are in Spain and 24,860 km2 in Portugal
(Figure 1). The Tagus basin produces 17,670 hm3 of water, 5,476 hm3 in Portugal.
From the border down to the Zêzere river confluence (Figure 2), it runs deeply
between high slopes in pre-Cambrian, Cambrian and Palaeozoic units. However,
south of Tancos (Figure 2), the Tagus changes direction and spreads out strongly
588
T. M. AZEVÊDO ET AL.
Figure 1. Localization of the Tagus’ river hydrographic basin in the Iberian Peninsula.
leading to sediment deposition in an alluvial plain 2 to 10 km wide, which is underlain by soft Cenozoic formations and bounded by Pleistocene terrace sediments.
This area, 50 to 100 km North of Lisbon, with approximately 500,000 inhabitants,
is classified as an agro-industrial area and it is this area that is most affected by
floods. The alluvial plain is where the best Portuguese agriculture soils are: vineyards, fresh fruits and some vegetables are grown. Besides agriculture, cattle, some
horses and pigs are also bred. During the biggest floods, some villages can only be
reached by boat for several weeks at a time and most roads and railway-lines are
cut.
Floods of the Tagus result mainly from long heavy rainfall periods related to the
Westerly Zonal Circulation in the North Atlantic. The sub-polar low-pressures and
frontal systems, usually occurring at the latitude of the British Isles are, at times of
flooding, shifted to lower latitudes (between 40◦ and 50◦ N).
The hundreds of reservoirs located in the Tagus basin, influencing the occurrence of floods in the Santarém area (Figure 2), have the total storage capacity
of 95% of the streamflow produced by the basin (Daveau, 1995). The Alcântara
hydroelectric dam in Spain, near to the frontier with Portugal, with a capacity
of 3,333 hm3 , is particularly critical in this context, in part reflecting the lack of
adequate management. This is a delicate problem as the Tagus is an International
Basin (Spain and Portugal). The biggest flood of the XXth century (1979 flood)
is an example of how this management was inadequate, as both peak floods, from
the Alcântara dam in Spain and Castelo do Bode dam in Portugal, met at practically the same time in the Santarém area. Only recently, the two governments
have agreed on the adequate management of the dams as well as the coordinated
CHARACTERIZATION OF THE TAGUS FLOODS
589
Figure 2. Dams and hydrometric stations along the River Tagus in Portugal; the Tagus’
floodplain in the Santarém region is also represented by a dotted line (adapt. Daveau et al.,
1978).
management of water resources, in both countries (“Convention on the Cooperation for the Water Protection and Sustainable Usage of the Portuguese–Spanish
Hydrographic Basins”, signed in 1998). Nowadays, this problem has been mostly
surpassed because no discharges are made in Spain without prior communication
to Portugal.
For the present study three sources of information were used: written historical documents, old and recent maps and hydrological data, with the purpose of
understanding the dynamics of the Tagus that leads to its morphological changes.
2. Analysis of Written Historical Documents
An intense bibliographic study on the Tagus and its floods was done in various archives, such as: National Historical Archives of Torre do Tombo, National
Portuguese Library, churches, municipal archives, history books and newspapers.
The research of the historical record shows that the channel of the Tagus has
been displaced, modified, and reduced in its width by anthropogenic activity, since
the Neolithic, as evidenced in many manuscripts, both in Spain and in Portugal.
All the works were associated with the needs of man, sometimes to prevent flood
catastrophes but mostly to try to make the river navigable and to enlarge the agricultural lands of the owners. Amongst other examples, the latter was done, at times,
by drying the area occupied by marshes, thus reducing it (Serrão, 1977; Mattoso
1993; Custódio, 1993).
590
T. M. AZEVÊDO ET AL.
Major channels of the river were displaced artificially during the reigns of several kings. The most notorious occurred during the reign of D. João III (XVIth
century), where a 10 km long channel was moved 1 km northwards from Tancos to
Chamusca (Figure 3), in order to stop the silting up of Crown territory by the sands.
This measure intended, on the one hand, to stop the destruction of the agricultural
lands by the fluvial erosion during floods and, on the other hand, the deposition of
sterile sands harmful to agricultural soils (crevasse splay deposits), causing great
economic loss (Antologia Nacional da Torre do Tombo, 1750; Dias, 1984; Azevêdo
and Nunes, 2000b; Azevêdo, 2001).
River changes also occurred as Portuguese and Spanish kings tried to make
the river navigable. In the XVIth century, during the Spanish occupation, navigation was made possible from Lisbon to Toledo (in Spain), after much hard work,
including the need for blasting, to destroy all the obstacles in the way.
More recently, in XIXth century, Brigadier Guerra changed definitively the
typology of the river by accomplishing great engineering works, such as the construction of dikes, ditches and small-size dams, in order to weaken the flood flow
energy.
During all this time, deforestation in the Tagus basin has lead to continuous
silting up of the riverbed and to the development of the thick sand bodies found
throughout the river. The impact of the dams from the middle of the XXth century
onwards led to a reduction of the source area supplying the sediment, located
downstream from the Alcântara dam, near the Spanish – Portuguese border, and
in Portugal, downstream from Castelo do Bode dam (on the right margin of Tagus)
and the Montargil and Maranhão dams (on the left margin) (Figure 2). This continuous silting in the lower Tagus, due mainly to anthropogenic activity, diminished
in the second half of the XXth century (Quintela et al., 1982). This decrease of
sediment input is owing to three main reasons: (a) reduction of the source area
(as stated above); (b) reduction of the frequency of the floods, mainly the autumn
ones because of the dams retention capacity, which is bigger after the dry summer
period; (c) the extraction of fluvial sands of the minor river bed, mainly during the
last two decades of the XXth century, which is nowadays about 2,000,000 m3 /year
(Ministério do Ambiente/Instituto Nacional da Água, 2000), mostly downstream
of Santarém.
3. Cartographic Analysis
Besides all the historical information taken from a variety of archives to fill the
gap of missing hydrological data, a detailed cartographic analysis was made, by
comparing all the available topographic and geological maps of the area that exist
since 1792 to the present, ranging from scales 1/20,000 to 1/200,000 (Nunes et al.,
2000; Nunes, 2001). The maps were compared two by two in the same scale. River
course, channel morphology, width variations and bar migration were studied and
compared over time.
CHARACTERIZATION OF THE TAGUS FLOODS
591
Figure 3. Changes of the Tagus channel, north of Santarém during the XIIIth century (adapt.
Dias, 1984).
This study, together with all the available historic references, make it clear that
the Tagus was originally a braided river of low sinuosity, with multiple channels
separated by large bars. As the Tagus had frequent flood episodes, the river either
returned to its former channel or followed a completely different one, with lateral
migration occurring across its large alluvial plain.
592
T. M. AZEVÊDO ET AL.
Figure 4. Morphological changes of the River Tagus during the last centuries, in the Santarém
region.
This braided character was still visible during the XVIIIth century (Figure 4).
However, the river has mainly been losing these characteristics since the second
half of the XIXth century, at the time of Guerra’s regularization works (Guerra,
1861). This slow evolution in the morphology of the river results mainly from
anthropic causes, primarily: (1) the artificial “gluing” of the extensive bars (called
“mouchoẽs”), which can reach up to 1 km2 , to the marginal lands. This normal
practice of the owners to enlarge their agricultural lands was the origin of the
“acrescidos” (growth of lands by bounding them to the bars). This practice was
officially restricted only at the end of the XIXth century. In this way, secondary
channels were progressively filled; (2) Guerra’s regularization works, which included the construction of dykes, small dams, opening of artificial ditches, removal
of sands and straightening of the river channel; (3) the dam’s impact, from the 50’s
on, on the sediments’ supply.
Before the influence of the dams and the intense extraction of fluvial sands
(during the natural river regime) it was possible to verify that the migration of the
sand bars (Figure 5) was in the order of 0.5 m/decade.
Nowadays, the lower Tagus can be considered a low sinuosity (s = 1.08) single
channel river with alternate bars. When flooding occurs, its flow always returns to
the only channel.
CHARACTERIZATION OF THE TAGUS FLOODS
593
Figure 5. Bar migration, between 1900 and 1970, in the Santarém region.
4. Hydrological Analysis
The non-existence of long continuous series of data, mainly flood discharge values,
as well as gauging stations operating in non-simultaneous periods has made the
task of developing the study of the Tagus’ historic and present floods, burdensome.
Hydrological heights are used because the existing discharge values for the
Ponte de Santarém hydrometric station are unreliable, mainly due to the morphological characteristics of the region and of the riverbed itself. As this region is
characterized by a very wide alluvial plain (2–10 km in width), it is often difficult to calibrate the heights with the effective discharges, even though the river’s
discharge-rating curve for this gauging station is known. This implies that it is not
easy to quantify precisely the discharges. Because we intend to zone and determine
the probability of flooding in each section, the use of heights, which are more
reliable, is used.
Many probability distribution models have been proposed and used for the prediction of flood discharges, however, there is no unanimity as to the model to be
utilised. In Portugal, and for the particular case of the Lower Tagus Basin (LTB),
the Pearson Type 3 distribution is the one that is most applicable to the prediction
of floods. The Gumbel Type 1 extreme value distribution (perhaps the most used
statistical method in Portugal) must not be applied as a flood prediction model
as its adjustment is rejected by an excessive high number of maximum annual
594
T. M. AZEVÊDO ET AL.
instantaneous discharge series (Henriques, 1985). Then again, we must bear in
mind, as explained before, that the use of maximum annual heights instead of discharges is due to the morphological characteristics of the LTB and to the intricacy
of calibrating the heights with the effective discharges, as it is difficult to quantify
with precision these discharges.
In our study, a non-parametric Mann-Kendall test was applied to the data in
order to detect the possible existence of some obliterated trend (Hensel and Hirsch,
1992). This is one of the most frequently applied statistical tests in hydrology, to
detect the presence of trends. The advantages of using a non-parametric test in
this case are: it is a robust test, not influenced by the presence of anomalous and
erroneous values, it can be applied on data of limited accuracy, and it is resistant to
the presence of gaps in the data. It can also be adapted to the seasonal behaviour of
hydrological variables, as in the present case.
The available data for the Santarém region, collected over a discontinuous
period of 150 years (from 1850 to 2000) in several archives (National Water Institute, National Civil Engineering Laboratory), enabled us to calculate the return
period of hydrological heights through a series of 71 consecutive years (1922–
1991), using the Pearson Type 3 distribution (Figure 6a, Table I). When using the
Gumbel Distribution, we verified that it is not suitable for the Portuguese case, as
Henriques (1985) already specified (Figure 6b).
Knowing that the big floods of the Tagus submerge almost all the alluvial plain
when the waters surpass the height of 7 m (Almeida D’Eça, in Sobrinho, 1980), we
can verify from Table I that these have a very small return period (2.5 years).
For the biggest flood of the XXth century (1979; H = 8.89 m), a return period of
approximately 210 years (Figure 6a) was determined. It occurred after 15 days of
rainfall and flooded an area of 871 km2 . On the other hand, by plotting on the same
graph the height of the biggest flood that occurred in the XIXth century (1876, H =
8.28 m; Figure 6a), it shows that its return period is approximately 18 years. Other
authors (LNEC – National Civil Engineering Laboratory, 1980), using the PearsonFoster III Law (empirical method), found a return period of 222 years for the 1979
flood. It must be emphasized that the 1876 flood (well before the building of dams
in the Tagus Basin) happened under natural conditions, the waters reaching greater
heights in Vila Velha do Ródão (upstream where the river is deeply incised; Figure
2) than in Santarëm owing to the morphology of the region. The 1979 flood resulted
from continuous non-coordinated discharges from both the Alcântara (Spain) and
Castelo do Bode (Portugal) dams.
The application of the Mann-Kendall test (Z = −0.213) shows that there is
no significative trend in the evolution of the annual maximum hydrological height
values, before and after the construction of the reservoirs/dams, as the critical value
of 1.96 for a level of significance of 5% is not exceeded. Thus, the artificialization
of the river’s regime does not seem to have interfered with the annual flood peaks
and the flooded area.
CHARACTERIZATION OF THE TAGUS FLOODS
595
Figure 6. Tagus River flood return periods in the Santarém region, using (A) Pearson Type 3
distribution and (B) Gumbel distribution.
596
T. M. AZEVÊDO ET AL.
Table I. Pearson type 3 distribution – duration frequency
characteristics
P3 value
(parameter value)
M (rank)
Probability
Recurrence
interval
8.78
8.68
8.56
8.51
8.40
8.33
8.09
7.75
7.46
7.18
6.90
6.59
6.23
5.76
5.05
4.40
4.20
3.78
3.59
3.01
2.44
1
2
3
4
5
6
7
8
9
10
11
12
13
14
15
16
17
18
19
20
21
0.005
0.010
0.020
0.025
0.040
0.050
0.100
0.200
0.300
0.400
0.500
0.600
0.700
0.800
0.900
0.950
0.960
0.975
0.980
0.990
0.995
200
100
50
40
25
20
10
5
3.33
2.50
2.00
1.67
1.43
1.25
1.11
1.05
1.04
1.03
1.02
1.01
1.00
5. Definition of a Flood Hazard Degree Scale
Based on the study of written historical records and available hydrological data, the
most important floods and direct consequences were compiled, ranging in period,
from 1855 to 1998 (Nunes et al., 1999, 2000; Azevêdo and Nunes, 2000a). The aim
of this work was to try defining a flood hazard degree scale for the Lower Tagus
Basin.
The construction of the flood hazard scale took into account six parameters,
corresponding to human, agricultural and life supporting impacts, classified from
the least (1) to the most hazardous (6). The least hazardous correspond to events
that are common during the floods and which the population is used to; the latter
are exceptional events. These parameters were pondered, by multiplying by two,
from the lowest (2) to the highest (12). The values obtained (from 2 to 42) were
grouped into four classes according to a dispersion diagram, as the following:
CHARACTERIZATION OF THE TAGUS FLOODS
Classes
Hazard degree
<12
12–24
25–39
>40
Low
Medium
High
Very High
597
I
II
III
IV
The low hazard degree (I) contemplates only submersion of roads and railway lines as well as losses of the agricultural production. When there are human
casualties, the hazard degrees range from high (III) to very high (IV), the latter
comprising all the six parameters (Table II). This Table shows that 42% of the
Tagus big floods lead to the loss of human lives and only about 1/5 correspond to
a very high hazard degree (IV). All floods in the Lower Tagus are progressive and
not of the flash flood type, therefore not so dangerous.
6. Conclusions
The analysis of written and cartographic records allowed us to study the behaviour
of the Tagus River from 1784 until 1992. Comparing the variations of its channels,
namely its course, width and bar migration it was verified that the initial braided
character of the river disappeared over time presenting nowadays a single channel
with alternate bars. This fact is due to human intervention in the river channel,
especially to the “acrescidos” (filling up of the secondary channels in order to
enlarge the agricultural lands) and to the regularization works in the XIXth century
(removal of sands and straightening of the river channel).
On the other hand, the available hydrological data (maximum annual heights)
from 1922 to 1991, allowed us to calculate the return periods for the Santarém
region. From these calculations, it was verified that floods over 7 m high (that
cover almost all of the floodplain) have a very small return period (2.5 years) and
that the biggest flood of the XXth century (8.89 m) attained a return period of 210
years. These 71 years comprise two distinct phases of the river’s regime: the natural
(before the 50’s) and the post dam construction. However, as the Mann–Kendall
test shows, there is no significant trend in the evolution of the annual maximum
hydrological height values.
Finally, the selection of the most important floods between 1855 and 1998,
permitted to build a flood hazard scale, which shows that the majority (58%) do
not cause human casualties, but agricultural and life supporting systems’ losses. As
the progression of the floods is well known and usually slow, in this region, there
is time to evacuate the most endangered places and take into action the protection
measures.
02-1855
10-1855
01-1856
12-1876
02-1881
02-1895
02-1900
02-1904
10-1907
11-1907
12-1909
12-1910
02-1912
04-1916
04-1924
09-1932
02-1936
01-1940
01-1941
02-1941
03-1947
03-1959
Month/Year
X
X
X
X
X
X
X
X
X
X
X
X
X
X
X
X
X
X
X
X
X
X
X
X
X
X
X
X
X
X
X
X
X
X
X
X
X
X
X
X
X
X
X
X
X
X
X
X
X
X
X
X
X
X
X
X
X
X
X
X
X
X
Life supporting impacts
Communication Delivery incapacity
means blocked3 of supplies4
2
10
X
X
X
X
X
Agricultural impacts
Lost cattle Lost
agriculture2
8
4
X
X
X
X
Human impacts
Deaths Dislodged
people1
12
8
Table II. Flood hazard degrees in the Santarém Region (Lower Tagus Basin)
24
20
22
24
12
2
2
6
6
6
34
2
42
6
6
4
30
30
34
34
34
6
II
II
II
II
II
I
I
I
I
I
IV
I
IV
I
I
I
III
IV
III
III
III
I
Flood hazard scale
Weighted Hazard
value
degree
598
T. M. AZEVÊDO ET AL.
X
X
X
X
X
X
X
X
X
X
X
X
X
X
X
X
X
X
X
X
X
X
X
X
X
Agricultural impacts
Lost cattle Lost
agriculture2
X
Human impacts
Deaths Dislodged
people1
X
X
X
X
X
X
X
X
X
X
X
X
X
X
X
Life supporting impacts
Communication Delivery incapacity
means blocked3 of supplies4
1 People left homeless due to the flooding (partial or total destruction) of their houses.
2 Partial or total destruction of agriculture.
3 Main roads and railway lines flooded, and destruction (partial or total) of protection dykes.
4 Supplies (food, water and sources of energy) unable to be delivered to isolated villages and towns.
11-1967
03-1978
02-1979
03-1979
01-1982
11-1983
12-1989
12-1995
11-1997
Month/Year
Table II. Continued
42
6
42
30
4
30
42
22
42
IV
I
IV
III
I
III
IV
II
IV
Flood hazard scale
Weighted Hazard
value
degree
CHARACTERIZATION OF THE TAGUS FLOODS
599
600
T. M. AZEVÊDO ET AL.
Acknowledgements
This work is part of the Praxis XXI Project, “An interdisciplinary approach to flood
risk evaluation – hydrology, geomorphology and sedimentology of the Douro,
Tagus and Sado Basins (IDAFRE)”. The aim of this project is to understand better the different behaviours of the three rivers under flood conditions, in order to
develop modelling programs and a data bank. We would like to thank Prof. Costa
Almeida for his help with the Mann–Kendall tests.
References
Antologia Nacional da Torre do Tombo: 1750, Conventos de Tomar, Ord. Cristo, Maço n◦ 30, doc.
N◦ 2 (vermelho).
Azevêdo, T. M. and Nunes, E.: 2000a, The Tagus’ river historical data as a colmatation of the
hydrological registration gap (Santarém, Portugal), European Geophysical Society, Geophysical
Research Abstracts, Volume 2, CD-Rom ed. Nice, France.
Azevêdo, T. M. and Nunes, E. V.: 2000b, The 1550 change of the Tagus river channel, Abstracts, VI
Reunión Nacional de Geomorfología, Geomorfología para el Tercer Milenio y Sociedad, Madrid,
Spain, p. 36.
Azevêdo, T. M.: 2001, A utilização dos dados históricos no estudo das cheias do Tejo. Estudos do
Quaternário, 4, APEQ, Porto, pp. 69–77.
Custódio, J.: 1993, Alpiarça, o lugar, a freguesia e o concelho no distrito de Santarém, PDM de
Alpiarça, Lisboa, p. 272.
Daveau, S., Almeida, G., Feio, M., Rebelo, F., Silva, R. F. M., and Sobrinho, A.S.: 1978, Os temporais
de Fevereiro/Março de 1978, Finisterra XIII(26), 236–260.
Daveau, S.: 1995, Portugal Geográfico, Ed. João Sá da Costa, Lisboa.
Dias, J. J. A.: 1984, Uma grande obra de engenharia em meados do século XVI: A mudança do
curso do rio Tejo, Nova História, Sec. XVI, N◦ 1, A. H. de Oliveira Marques (dir.), Ed. Estampa,
Lisboa, pp. 66–82.
Guerra, M. J. J: 1861, Estudos chorographicos, physicos e hydrographicos da Bacia do Rio Tejo
comprehendida no Reino de Portugal, Imp. Nacional, Lisboa, p. 110.
Gumbel, E. J.: 1941a, The return period of flood flows, Ann. Math. Statis XII, 163–190.
Gumbel, E. J.: 1941b, Probability interpretation of the observed return period of floods, Trans. AGU.,
Part III, 836–850.
Gumbel, E. J.: 1945, Floods estimated by probability methods, Engr. News-Record 97.
Henriques, A. G.: 1981, Análise da Distribuição de Frequências de Caudais Instantâneos Máximos Anuais. Aplicação à Previsão de Caudais de Cheia, Tese para Especialista de Laboratório
Nacional de Engenharia Civil, Lisboa.
Henriques, A. G.: 1985, Cálculo de caudais de cheia em cursos de água em Portugal com base em
séries de caudais instantâneos máximos anuais, Rec. Hídricos 6(2), Lisboa, pp. 59–68.
Hensel, D. R and Hirsch, R. M.: 1992, Statistical Methods in Water Research, Elsevier Science, New
York, p. 522.
Laboratório Nacional de Engenharia Civil: 1990, As cheias em Portugal – Caracterização das zonas
de risco, 1◦ Relatório: An lise Preliminar, L.N.E.C., Lisboa, p. 79.
Laboratório Nacional de Engenharia Civil: 1992, As cheias em Portugal – Caracterização das zonas
de risco, 4◦ Relatório: Bacia Hidrográfica do Rio Tejo, L.N.E.C., Lisboa, p. 53.
Ministério do Ambiente/Instituto Nacional da Agua: 1998. Convention on the Cooperation for the
Water Protection and Sustainable Usage of the Portuguese–Spanish Hydrographic Basins.
Ministério do Ambiente/Instituto Nacional da Agua: 2000, Plan of the Hydrographic Basins of the
Portuguese-Spanish Rivers. Synth. Vol. I – Characterization and Diagnostics.
CHARACTERIZATION OF THE TAGUS FLOODS
601
Mattoso, J.:1993, História de Portugal – Antes de Portugal, Vol. 1, Ed. Estampa, Lisboa, p. 567.
Nunes, E. V., Azevêdo, T. M., and Ramos, C.: 1999, Preliminary Studies of the River Tagus
Floods in the Santarém Area (Ribatejo, Portugal), Abstracts, The Second International Paleoflood
Conference, Prescott, Arizona, USA, p. 33.
Nunes, E. V.: 2000, Azevêdo, T. M., and Ramos, C.: 2000, Channel variation and bar migration of the lower Tagus river over the last three centuries, Abstracts, VI Reunión Nacional de
Geomorfología, Geomorfología para el Tercer Milenio y Sociedad, Madrid, Spain, p. 44.
Nunes, E.: 2001, Estudo Multidiscilpinar da Variabilidade Temporal e Espacial do Tejo na Regiao de
Santarém, MSc Thesis (unpubl.), Fac. Cienc. Univ. Lisboa, Lisbon.
Quintela, A. C. et al.: 1982, Avaliação da evolução do transporte sólido no Rio Tejo e sua influência
no leito. Simpósio sobre a bacia hidrográfica portuguesa do Rio Tejo, A.P.R.H., vol. I, Lisboa, p.
20.
Serrâo, J. V.: 1977, História de Portugal – Estado, Pátria e Nação (1080–1415), Vol. I, Ed. Verbo,
Lisboa, p. 445.
Sobrinho, A. S.: 1980, As inundações e o ordenamento do território em Portugal, II Col. Ibérico de
Geografia, Lisboa.
Baixar