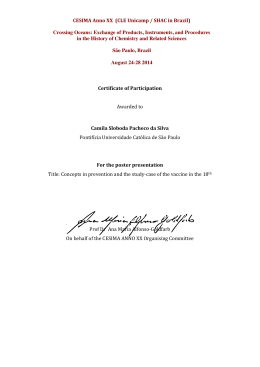
ORIGINAL ARTICLE
DOI: 10.1590/1516-3180.2014.00122601
Air pollutants and hospitalization due to pneumonia
among children. An ecological time series study
Poluentes atmosféricos e internações por pneumonia em crianças. Estudo
ecológico de série temporal
Tassia Soldi TuanI, Taís Siqueira VenâncioI, Luiz Fernando Costa NascimentoII
Department of Medicine, Universidade de Taubaté (Unitau), Taubaté, São Paulo, Brazil
Medical Student. Department of Medicine,
Universidade de Taubaté (Unitau), Taubaté, São
Paulo, Brazil.
I
MD, PhD. Assistant Professor, Department of
Medicine, Universidade de Taubaté (Unitau),
Taubaté, São Paulo, Brazil.
II
KEY WORDS:
Air pollutants.
Pneumonia.
Child health.
Ozone.
Carbon monoxide.
PALAVRAS-CHAVE:
Poluentes do ar.
Pneumonia.
Saúde da criança.
Ozônio.
Monóxido de carbono.
ABSTRACT
CONTEXT AND OBJECTIVE: Exposure to air pollutants is one of the factors responsible for hospitalizations
due to pneumonia among children. This has considerable financial cost, along with social cost. A study to
identify the role of this exposure in relation to hospital admissions due to pneumonia among children up
to 10 years of age was conducted.
DESIGN AND SETTING: Ecological time series study using data from São José dos Campos, Brazil.
METHODS: Daily data on hospitalizations due to pneumonia and on the pollutants CO, O3, PM10 and SO2,
temperature and humidity in São José dos Campos, in 2012, were analyzed. A generalized additive model
of Poisson’s regression was used. Relative risks for hospitalizations due to pneumonia, according to lags of
0-5 days, were estimated. The population-attributable fraction, number of avoidable hospitalizations and
cost savings from avoidable hospitalizations were calculated.
RESULTS: There were 539 admissions. Exposure to CO and O3 was seen to be associated with hospitalizations, with risks of 1.10 and 1.15 on the third day after exposure to increased CO concentration of 200 ppb
and ozone concentration of 20 μg/m3. Exposure to the pollutants of particulate matter and sulfur dioxide
were not shown to be associated with hospitalizations. Decreases in CO and ozone concentrations could
lead to 49 fewer hospitalizations and cost reductions of R$ 39,000.00.
CONCLUSION: Exposure to certain air pollutants produces harmful effects on children’s health, even in
a medium-sized city. Public policies to reduce emissions of these pollutants need to be implemented.
RESUMO
CONTEXTO E OBJETIVOS: A exposição a poluentes do ar é um dos fatores responsáveis pelas internações
por pneumonias em crianças. Esse desfecho tem custo financeiro considerável, além do custo social. Estudo para identificar o papel dessa exposição nas internações em crianças com até 10 anos de idade foi
desenvolvido.
TIPO DE ESTUDO E LOCAL: Estudo ecológico de séries temporais com dados de São José dos Campos, Brasil.
MÉTODOS: Dados diários de internações por pneumonia, dos poluentes CO, O3, PM10, SO2 além de temperatura e umidade de São José dos Campos, em 2012, foram analisados. Utilizou-se modelo aditivo generalizado da regressão de Poisson e foram estimados os riscos relativos para internações por pneumonia
segundo defasagens de 0 a 5 dias. Foram calculadas a fração atribuível populacional, as internações evitáveis e a economia nos custos das internações evitáveis.
RESULTADOS: Foram 539 internações. Exposição ao CO e O3 se mostraram associadas às internações, com
riscos de 1,10 e 1,15 no terceiro dia após a exposição decorrentes de aumento nas concentrações do CO
em 200 ppb e nas concentrações de ozônio em 20 µg/m3. Exposições aos poluentes material particulado
e dióxido de enxofre não se mostraram associados às internações. Diminuição nas concentrações de CO e
O3 poderiam reduzir em 49 internações e de R$ 39 mil nos custos.
CONCLUSÃO: Mesmo em uma cidade de médio porte, exposição a determinados poluentes do ar causa
efeito danoso à saúde da criança, sendo necessária a implantação de políticas públicas para redução da
emissão desses poluentes.
408
Sao Paulo Med J. 2015; 133(5):408-13
Air pollutants and hospitalization due to pneumonia among children. An ecological time series study | ORIGINAL ARTICLE
INTRODUCTION
Among children, pneumonia is a multifactorial disease for which
the risk factors include poor nutritional status, lack of breastfeeding, low parental education, low birth weight, low maternal age,
low weight gain during pregnancy, presence of smokers in the
environment, parity and overcrowding in the home.1
In Brazil, in 2012, there were approximately 300,000 hospitalizations due to respiratory diseases, of which around 50,000
were in the state of São Paulo. Respiratory diseases also generate
expense for the National Health System, considering that in 2012,
in Brazil, spending on hospital admissions due to pneumonia in
this age group was close to R$ 200 million (1 US $ ≈ R$ 2.20), of
which R$ 40 million related to the state of São Paulo. Data from
2010 showed that, of the 55,000 deaths due to pneumonia, 18,000
were in the state of São Paulo, and 2% were among children up
to 10 years of age.2 Exposure to air pollutants was highlighted,
regardless of which of the factors mentioned above were present.
Air pollutants can be primary, i.e. those emitted directly by
emission sources, or secondary, like ozone, which are formed
through chemical processes between primary pollutants and natural compounds in the atmosphere. They consist of a heterogeneous
mixture of substances, including carbon monoxide (CO), ozone
(O3), sulfur oxides (SOx), nitrogen oxides (NOx), organic compounds (hydrocarbons, alcohols, aldehydes, ketones, organic acids
and halogen compounds) and particulate matter (PM). PM composition depends on the pollution source and on environmental
factors such as meteorological conditions, industrial activity and
vehicle traffic density. The inhalable particles may be fine (PM2.5;
< 2.5 µm), which may reach the pulmonary alveoli, or coarse
(PM10; 2.5-10 µm), which are retained in the upper airways.3-11
Studies conducted in major centers such as São Paulo,6
Rome,12 Taipei13 and Rio de Janeiro8 and in some medium-sized
Brazilian cities, such as São José Campos,3,5 Piracicaba14 and
Cubatão,7 have identified an association between hospital admissions due to respiratory diseases and exposure to air pollutants,
such as coarse and fine particulate matter (PM10 and PM2.5),
ozone (O3), sulfur dioxide (SO2) and carbon monoxide (CO).
OBJECTIVE
This study aimed to estimate the association between exposure to
air pollutants and hospital admissions due to pneumonia among
children up to 10 years of age in the city of São José dos Campos,
state of São Paulo.
METHODS
This was an ecological time series study using data on hospitalizations due to pneumonia (International Classification of Diseases,
ICD, 10th revision, sections J12.0 to J18.9) in the public health
system (six hospitals), from children of both sexes up to 10 years
of age, living in São José dos Campos. The study was carried
out between January 1, 2012, and December 31, 2012. Hospital
admission data were obtained from the DATASUS system.2
The environmental agency of the state of São Paulo
(CETESB),15 a government department that has a measuring station in São José dos Campos, provided the concentration values
for particulate matter (PM10), sulfur dioxide (SO2) and ozone
(O3), quantified in µg/m3, and carbon monoxide (CO) measured
in ppb, along with minimum temperature and relative air humidity data. PM10, SO2 and CO were analyzed using mean daily
values and O3 was analyzed using eight-hour values, and the
maximum value was applied.
São José dos Campos is a city in southeastern Brazil located
between the cities of São Paulo and Rio de Janeiro, in the middle
region of the Paraíba valley, 84 km east of the state capital, and
has a population of about 650,000 inhabitants. Its geographical
location is at latitude 23°11’ S and longitude 45°53’ W. The city
has a vehicle fleet of approximately 360,000 and is crossed by the
Dutra highway, the country’s main highway, with a flow of about
130,000 vehicles per day, among which heavy vehicles (buses and
trucks) form the majority. It is an important economic center
with companies focusing on technology, education and research.
Poisson’s regression was used to estimate relative risks of
exposure to pollutants for the outcome of hospitalization because
this is an event count. A database containing daily hospital
admission data together with all the pollution and climatic variables was constructed. This took into account lags from zero to
five days, because the effects of exposure to pollutants can be seen
not only on the same day, but also on later days. Moreover, there
is no consensus regarding the size of this window. Therefore, a
generalized additive Poisson’s regression (GAM) model was chosen. Models containing the four pollutants simultaneously and
adjusted for minimum temperature, relative humidity, seasonality and day of the week were analyzed.
The results were expressed as relative risk values. The increase
in relative risk (RR-INC) was calculated using the formula RR-INC
(%) = (exp(coef * INC) - 1) * 100, where increased concentrations
(INC) of CO at 200 ppb, 10 µg/m3 for PM10, 5 µg/m3 for SO2 and
20 µg/m3 for O3 were assigned in the eventuality of a significant
association between exposure to a particular pollutant and hospitalization. The resultant population-attributable fraction provided
numbers of hospitalizations attributed to increases in pollutant
concentrations. The financial costs that would be avoided through
reductions in hospital admissions were calculated using the mean
hospital costs provided by the DATASUS website.
RESULTS
Five hundred and thirty-nine children were hospitalized during
the study period. This comprised a mean of 1.47 hospitalizations
Sao Paulo Med J. 2015; 133(5):408-13
409
ORIGINAL ARTICLE | Tuan TS, Venâncio TS, Nascimento LFC
per day (standard deviation, SD = 1.57), with a minimum of zero
and maximum of 11 admissions. The mean concentrations of the
pollutants (µg/m3), standard deviations and minimum and maximum are shown in Table 1.
The behavior of ozone over the period did not show any clear
seasonality. The 140 µg/m3 standard value was exceeded on four days
and the air quality was considered to be only moderate on another
four days. CO, PM10 and SO2 demonstrated seasonal patterns with
peak concentrations in the cold months (data not shown).
Table 2 presents the correlation matrix for the study variables
(environmental pollutants, climate variables and number of hospitalizations). We observed significant correlations between the
pollutants, except between CO and O3.
Table 3 presents Poisson’s regression coefficients and standard errors for the pollutants studied on all the lag days analyzed
(up to five days after the exposure). The effects on hospitalizations
Table 1. Descriptive analysis showing means, standard
deviations (SD), minimum and maximum values (Min-Max)
and 5%, 50% and 95% percentiles (P 5%, P 50% and P 95%) of
the study variables. São José dos Campos (SP), Brazil, 2012
Variables
PM10 (µg/m3)
O3 (µg/m3)
CO (ppb)
SO2 (µg/m3)
Humidity (%)
Temperature (°C)
Mean (SD)
23.0 (10.8)
94.4 (33.8)
940 (470)
3.1 (2.4)
56.9 (16.3)
15.2 (4.3)
Min-Max
6-81
30-213
300-3400
0.0-19.0
28.0-99.0
0.0-21.9
P 5%
10
45
400
1
33
9.5
P 50% P 95%
20
45
93
154
800
2000
3
6
54
92
16.3
20.4
Table 2. Pearson´s correlation matrix between atmospheric
variables. São José dos Campos (SP), Brazil, 2012
PM10
PM10
SO2
CO
O3
Temperature
Relative air
humidity
SO2
CO
O3
Temperature
1
0.19*
1
0.54* 0.13†
1
0.22* 0.27* -0.09
1
-0.24* -0.06 -0.37* 0.30*
1
-0.50* -0.20* -0.02 -0.50*
0.11†
Relative air
humidity
were not immediate: they were observed on lag day 3 and lag day
4 for CO and between lag days 2 and 5 for O3.
The relative risks and 95% confidence intervals (CI) were
calculated from the values supplied by the generalized additive
model. The relative risks for CO were RR = 1.08 (95% CI: 1.02
to 1.14) for lag day 3 and RR = 1.10 (95% CI: 1.04 to 1.16) for
lag day 4; and for ozone, RR = 1.005 (CI: 1.003 to 1.007) on lag
day 2, RR = 1.007 (CI: 1.005 to 1.009) on lag day 3 and RR =
1.004 (CI: 1.002 to 1.006) on lag day 4. Figure 1 (a) and (b)
show the relative risks regarding ozone and carbon monoxide,
for increases of 20 µg/m3 in ozone concentration and 200 ppb in
1.40
A
1.20
1.00
0.80
Lag 0
Lag 1
Lag 2
Lag 3
Lag 4
Lag 5
Lag 1
Lag 2
Lag 3
Lag 4
Lag 5
1.20
B
1.10
1.00
0.90
Lag 0
*Lag: number of days elapsed between the exposure and
hospital admission.
1
*P-value < 0.01; †P-value < 0.05.
Figure 1. Relative risks and 95% confidence intervals for
increases in (A) ozone concentration (20 μg/m3) and (B) carbon
monoxide concentration (200 ppb), on lag days* 0 to 5.
São José dos Campos (SP), Brazil, 2012.
Table 3. Regression coefficients and standard errors (se) for the pollutants of particulate matter (PM10), sulfur dioxide (SO2), carbon
monoxide (CO) and ozone (O3) on all the lag days analyzed. São José dos Campos (SP), Brazil, 2012
Lag day
0
1
2
3
4
5
PM10 (se)
0.00609 (0.00666)
-0.00197 (0.00648)
-0.00302 (0.00653)
-0.00853 (0.00687)
-0.00040 (0.00639)
-0.00213 (0.00611)
*P-value < 0.05; se = standard error.
410
Sao Paulo Med J. 2015; 133(5):408-13
SO2 (se)
0.00007 (0.02362)
-0.01472 (0.02233)
-0.03368 (0.02465)
-0.03829 (0.02612)
-0.05297 (0.02690)*
-0.00452 (0.02366)
CO (se)
-0.00003 (0.00014)
0.00014 (0.00014)
0.00021 (0.00014)
0.00048 (0.00013)*
0.00037 (0.00014)*
0.00021 (0.00015)
O3 (se)
-0.00064 (0.00231)
0.00339 (0.00230)
0.00618 (0.00238)*
0.00715 (0.00219)*
0.00543 (0.00210)*
0.00522 (0.00223)*
Air pollutants and hospitalization due to pneumonia among children. An ecological time series study | ORIGINAL ARTICLE
carbon monoxide concentration. A decrease of 20 μg/m3 in ozone
concentration implies a decrease of up to 15 percentage points
(95% CI: 5.5 to 24.6) in the relative risk of hospitalization due
to pneumonia. A decrease of 200 ppb in the CO concentration
implies a decrease of up to 10 percentage points. The number
of hospital admissions would reduce by 49 patients, with a
reduction in costs of around R$ 39,000.00, given that the average
cost of hospitalization is R$ 800.00.
DISCUSSION
This study identified the importance of exposure to CO and O3
in the genesis of hospitalizations due to pneumonia among children in São José dos Campos, state of São Paulo. The effects were
evident on the third and fourth days after exposure to CO and on
the second to fifth days after exposure to ozone.
This study identified a lower number of hospitalizations
(539 reports) than a previous study on other pollutants,3 which
identified 1300 cases in the same city, using data from 2000 and
2001. The present study also identified decreases of around 50% in
PM10 and SO2 concentrations, compared with the previous study.3
These findings relating to CO in the city of São José dos
Campos coincide with the results from a study conducted in São
Paulo by Gouveia et al.6 among patients aged up to five years,
even though the age group analyzed in our study was up to ten
years. Their mean CO concentration was 3.24 ppm in São Paulo,
i.e. 3.5 times higher than that found in our study (0.94 ppm),
thus indicating that even at concentrations 70% lower, the harmful effects of exposure to CO are still present.
Similarly, exposure to mean CO concentrations of the order
of 1.26 ppm showed an association with increased chance of hospitalization due to pneumonia (up to 27% higher) in a study
carried out in Taiwan.13 In that study, despite the lack of a biologically plausible explanation for the association between CO
exposure and admissions due to pneumonia, the authors believed
that this might be explained by the fact that CO is a good indicator of air pollution (incomplete combustion), particularly associated with pollution due to vehicle emissions.13
Our findings also agree with the results of Fusco et al.,12 in
which CO was the only pollutant associated with all the types of
respiratory diseases studied, such as asthma, chronic obstructive
pulmonary disease (COPD) and pneumonia.
Exposure to ozone was identified as a risk factor in 2012, unlike
in the data from 2000-2001. Thus, there is a possible dose-response
effect, since the mean ozone concentration in 2000-2001 was
approximately 65 μg/m3 and, in 2012, it was 94.4 µg/m3, i.e. 50%
higher. On the other hand, our results coincide with those found
in Cubatão, state of São Paulo, where the effect occurred on the
same day as the exposure, with similar ozone concentrations.7 In a
study conducted in São Paulo in which the ozone concentrations
were found to be nearly 70 μg/m3, Gouveia et al.6 also observed
that ozone exposure played a role in hospitalizations due to respiratory diseases among children, relating both to pneumonia and to
asthma. Fusco et al. also found that ozone exposure played a role
in hospital admissions due to total respiratory disease and due to
pneumonia among children aged 0-14 years. On lag day 1, the risk
was between 5% and 8% higher, given that there was an increase
in ozone concentration of 23 µg/m3.12 Chiu et al. found that ozone
exposure played a role in hospital admissions due to pneumonia in
Taipei, both on warm and on cold days.13
This increase in ozone concentrations may be associated with
possible increased concentrations of NOx released by fuel-burning, mainly due to the vehicular fleet. In this, NOx is transformed
into NO2. The vehicular fleet increased from around 180,000 vehicles in 2000 (135,000 cars) to around 330,000 in 2011 (232,000
cars) (http://www.denatran.gov.br/frota.htm), which may explain
the increase in NOx concentrations with a consequent increase
in ozone concentrations. This pollutant (NO2) was not analyzed
in the present study because data on this in São José dos Campos
were not yet available from CETESB. On the other hand, data were
available from Sorocaba, state of São Paulo, another medium-sized
city like São José dos Campos, where NO2 emissions were correlated with hospitalizations due to pneumonia.16
This study did not identify any association between exposure to PM10 and admissions. However, in a study carried out
10 years ago, exposure to this pollutant was important,3 since it
showed associations three and four day after exposure and hospitalization. In the study of 10 years ago, the mean concentration was approximately 40 μg/m3, i.e. almost double the level of
23 μg/m3 found in 2012. The reduction in the mean concentration of PM10 over this 12-year period may have been due to policies implemented for reducing pollution, through using more
suitable catalysts in cars so as to decrease exhaust emissions,
renewal of the vehicular fleet, installation of filters in factory
chimneys and strict monitoring of emissions of pollutants. This
reduction in PM10 concentration may have resulted in a reduced
number of hospitalizations due to pneumonia, thereby suggesting that there has been dose-response effect.
In a study carried out in Cubatão, state of São Paulo,7 PM10
exposure was correlated with subsequent hospitalization due
to pneumonia. The mean PM10 concentration in Cubatão
was 63.8 μg/m3, i.e. three times higher than the PM10 concentration in our study. In another study, on children in the city
of Rio de Janeiro, with mean PM10 concentration of nearly
85 μg/m3, the mean peak expiratory flow was impaired.8 Our
findings also do not agree with those of the study by Samoli
et al.,9 in which an association with exposure to PM10 was found,
with an average concentration of 43 μg/m3, but the outcome was
hospitalization due to asthma. The fine fraction (PM2.5), which
Sao Paulo Med J. 2015; 133(5):408-13
411
ORIGINAL ARTICLE | Tuan TS, Venâncio TS, Nascimento LFC
accounted for nearly 60% of the quantity of PM10, was correlated
with hospitalizations due to bronchiolitis in a study carried in
California.11A study conducted in Central Europe, which found
much higher concentrations than those recommended by the
World Health Organization (WHO), reaching up to 400 μg/m3,
showed that the respiratory health of children living in the urban
area of Tirana was impaired due to asthma and pneumonia.17
Our results reinforce the results found in Piracicaba, state of
Sâo Paulo, in which it was observed that straw-burning increases
the risk of hospitalization among children due to respiratory
problems, by 25%, especially during the dry months of the year,
in which three times as much particulate matter (PM10) as in the
other months is generated.18
There was also no association between exposure to sulfur dioxide and hospitalizations due to pneumonia, possibly
because diesel with lower sulfur content has come into use.
The sulfur content has decreased from 500 ppm to 50 and 10
ppm in the new diesel formulations S-50 and S-10, respectively. The decrease in the concentrations was from 6.2 µg/m3
(in 2000-2001) to 3.1 µg/m3 (in 2012).
Importantly, the present study used records of hospitalizations within the public health system. Thus, the results are
limited to the portion of the population that uses this service.
However, this portion has come to represent about 90% of all
hospital admissions.19 On the other hand, the present results do
not represent admissions through health plans or health insurance, or cases of pneumonia that were treated as outpatients.
Moreover, although the data provided by DATASUS are
purely financial and not strictly appropriate for epidemiological studies, they have nevertheless been widely used in ecological studies.20
It is also worth noting that since this was an ecological study
that did not have individual information on exposure and disease,
we cannot say whether a given hospitalized individual was exposed
to the pollutant. Moreover, comorbidities were not assessed.
The frequencies of certain complaints may have been underestimated and errors in coding the diagnoses may have occurred,
given the technological profile of the service network. Nowadays,
diagnoses are confirmed later on during hospitalization, with
the aim of reducing the diagnostic errors at the time of hospital admission. It is also noteworthy that the daily measurements
of exposure were considered to be homogeneous throughout the
city and that individuals were similarly exposed.
In the case of ozone, the magnitude of the RR was small,
but the impact of air pollution on the population’s health is
believed to be substantial, taking into account the considerable
number of individuals exposed. Estimation of the risk to the
population’s health regarding air pollution is the first step in
planning and implementing actions aimed towards achieving a
412
Sao Paulo Med J. 2015; 133(5):408-13
healthier environment. Production of a technical database is critical to formulation of public policies and decisions that promote
socioeconomic development and also take environmental and
quality-of-life issues into account.6
CONCLUSION
The data presented in this study showed that pollutants such as
carbon monoxide and ozone have a role in the genesis of hospital
admissions due to pneumonia among children. Therefore, implementation of policies for improving public transportation might
significantly reduce the risk of hospitalizations due to pneumonia among children.
REFERENCES
1. Nascimento LFC, Marcitelli R, Agostinho FS, Gimenes CS. Análise
hierarquizada dos fatores de risco para pneumonia em crianças
[Hierarchical approach to determining risk factors for pneumonia in
children]. J Bras Pneumol. 2004;30(5):445-51.
2. Brasil. Ministério da Saúde. Informações de Saúde (TABNET). Available
from: http://www2.datasus.gov.br/DATASUS/index.php?area=02
Accessed in 2015 (Jul 2).
3. Nascimento LF, Pereira LA, Braga AL, Módolo MC, Carvalho JA.
Efeitos da poluição atmosférica na saúde infantil em São José dos
Campos, SP [Effects of air pollution on children’s health in a city in
Southeastern Brazil]. Rev Saude Publica. 2006;40(1):77-82.
4. Arbex MA, Santos Ude P, Martins LC, et al. A poluição do ar e o sistema
respiratório [Air pollution and the respiratory system]. J Bras Pneumol.
2012;38(5):643-55. 5. Amâncio CT, Nascimento LF. Asma e poluentes ambientais: um
estudo de séries temporais [Asthma and ambient pollutants: a time
series study]. Rev Assoc Med Bras (1992). 2012;58(3):302-7.
6. Gouveia N, de Freitas CU, Martins LC, Marcilio IO. Hospitalizações por
causas respiratórias e cardiovasculares associadas à contaminação
atmosférica no Munícipio de São Paulo, Brasil [Respiratory and
cardiovascular hospitalizations associated with air pollution in the
city of São Paulo, Brazil]. Cad Saude Publica. 2006;22(12):2669-77.
7. Jasinski R, Pereira LA, Braga AL. Poluição atmosférica e internações
hospitalares por doenças respiratórias em crianças e adolescentes
em Cubatão, São Paulo, Brasil, entre 1997 e 2004 [Air pollution and
pediatric hospital admissions due to respiratory diseases in Cubatão,
São Paulo State, Brazil, from 1997 to 2004]. Cad Saude Publica.
2011;27(11):2242-52.
8. Castro HA, Cunha MF, Mendonça GA, et al. Efeitos da poluição do ar
na função respiratória de escolares, Rio de Janeiro, RJ [Effect of air
pollution on lung function in schoolchildren in Rio de Janeiro, Brazil].
Rev Saude Publica. 2009;43(1):26-34.
9. Samoli E, Nastos PT, Paliatsos AG, Katsouyanni K, Priftis KN. Acute
effects of air pollution on pediatric asthma exacerbation: evidence of
association and effect modification. Environ Res. 2011;111(3):418-24.
Air pollutants and hospitalization due to pneumonia among children. An ecological time series study | ORIGINAL ARTICLE
10. Nascimento LF. Air pollution and cardiovascular hospital admissions
Date of first submission: October 23, 2014
in a medium-sized city in São Paulo State, Brazil. Braz J Med Biol Res.
Last received: January 26, 2015
2011;44(7):720-4.
Accepted: January 26, 2015
11. Karr C, Lumley T, Schreuder A, et al. Effects of subchronic and chronic
exposure to ambient air pollutants on infant bronchiolitis. Am J
Address for correspondence:
Epidemiol. 2007;165(5):553-60.
Luiz Fernando Nascimento
12. Fusco D, Forastiere F, Michelozzi P, et al. Air pollution and hospital
Av. Tiradentes, 500
admissions for respiratory conditions in Rome, Italy. Eur Respir J.
Bom Conselho — Taubaté (SP) — Brazil
2001;17(6):1143-50.
CEP 12030-180
13. Chiu HF, Cheng MH, Yang CY. Air pollution and hospital admissions
for pneumonia in a subtropical city: Taipei, Taiwan. Inhal Toxicol.
Tel. (+55 12) 3621-8796
E-mail: [email protected]
2009;21(1):32-7.
14. Cesar AC, Nascimento LF, Carvalho Jr JA. Associação entre exposição
ao material particulado e internações por doenças respiratórias em
crianças [Association between exposure to particulate matter and
hospital admissions for respiratory disease in children]. Rev Saude
Publica. 2013;47(6):1209-12.
15. São Paulo. Companhia Ambiental do Estado de São Paulo (CETESB).
Monóxido de carbono. Available from: http://www.cetesb.sp.gov.br/
userfiles/file/laboratorios/fit/monoxido_de_carbono.pdf. Accessed
in 2015 (Mar 17).
16. Negrisoli J, Nascimento LFC. Poluentes atmosféricos e internações
por pneumonia em crianças [Atmospheric pollutants and hospital
admissions due to pneumonia in children]. Rev Paul Pediatr.
2013;31(4):501-6.
17. Tabaku A, Bejtja G, Bala S, Toci E, Resuli J. Effects of air pollution on children’s
pulmonary health. Atmospheric Environment. 2011;45(40):7540-5.
18. Cançado JE, Saldiva PH, Pereira LA, et al. The impact of sugar caneburning emissions on the respiratory system of children and the
elderly. Environ Health Perspect. 2006;114(5):725-9.
19.Nascimento LF, Francisco JB. Particulate matter and hospital
admission due to arterial hypertension in a medium-sized Brazilian
city. Cad Saude Publica. 2013;29(8):1565-71.
20. Veras CM, Martins MS. A confiabilidade dos dados nos formulários
de Autorização de Internação Hospitalar (AIH), Rio de Janeiro, Brasil
[Reliability of data from Authorization Forms for Hospital Admittance,
Rio de Janeiro, Brazil]. Cad Saude Publica. 1994;10(3):339-55.
Acknowledgement: Tássia S. Tuan thanks the National Council for
Scientific and Technological Development (Conselho Nacional de
Desenvolvimento Científico e Tecnológico, CNPq) for the scientific
initiation scholarship
Sources of funding: None
Conflict of interest: None
Sao Paulo Med J. 2015; 133(5):408-13
413
Download
pdf