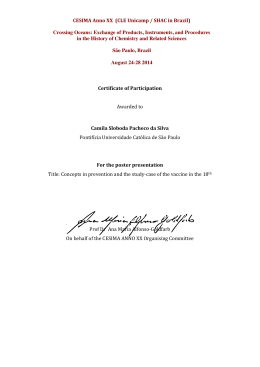
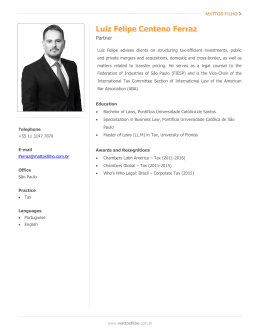
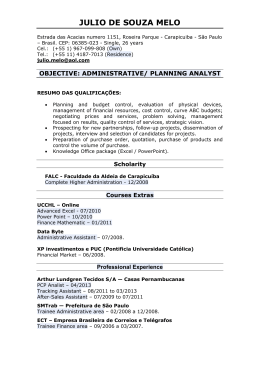
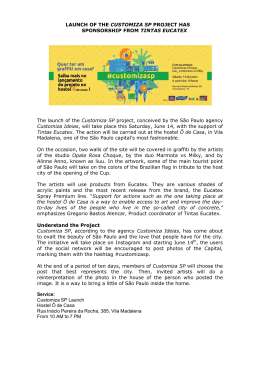
2010 Symposium CIB W062 - Sydney Australia Impact of installation of water saving technologies at the International Airport of São Paulo in Brazil M. S. O. Ilha (1), L. H. Oliveira (2), W. C. Sousa Júnior (3), O. M. Gonçalves (4), M. A. S. Campos (5) (1) Department of Architecture and Construction, School of Civil Engineering, Architecture and Urban Design, University of Campinas, Campinas, SP, Brazil, e-mail: [email protected] (2) Department of Construction Engineering of Escola Politécnica, Brazil, P.O. Box 61548, University of São Paulo, São Paulo, Brazil, e-mail: [email protected] (3) Department of Hydraulics, Instituto Tecnológico de Aeronáutica, São José dos Campos, SP, Brazil, e-mail: [email protected] (4) Department of Construction Engineering of Escola Politécnica, Brazil, P.O. Box 61548, University of São Paulo, São Paulo, Brazil, e-mail: [email protected] (5) Department of Architecture and Construction, School of Civil Engineering, Architecture and Urban Design, University of |Campinas, SP, Brazil, e-mail: [email protected] Abstract The International Airport of São Paulo - AISP, in Guarulhos annually takes care of 17 million passengers and with forecast of amplification for 29 million. It has about 200 sanitary, beyond the frozen water central and of the sector of food. Since 2008 it has been developed a research project called HIDROAER that aims to promote the efficient water use with new water saving. Four steps were developed based on adjustments in the sanitary fixtures and installation of different types of water saving technologies. The greatest impact was achieved with the adjustments made in the sanitary appliances, which indicates the importance of such activities on water conservation programs. This article presents the final results of this survey and the recommendations for the development of water conservation programs in bathrooms in similar airports and other public plants Keywords Water conservation; airport; HIDROAER; water consumption pattern. 2010 Symposium CIB W062 - Sydney Australia 1. Introduction The International Airport of São Paulo (AISP) is the object of study of the HIDROAER Project - Efficient water use at airports, which has been developed by the Instituto Tecnológico de Aeronáutica (ITA) in partnership with the University of São Paulo and the University of Campinas and financed by the FINEP - Financiadora de Estudos e Projetos e Conselho Nacional de Desenvolvimento Científico e Tecnológico (CNPq). The objectives of the HIDROAER Project are to specify saving water technologies as well as the implement of non-potable water systems for the reduction of water consumption, from a diagnosis of the water use at the AISP, carried out in 2006 by AISP. The International Airport of São Paulo (AISP) is located in the city of Guarulhos, about 20 kilometers from the city of São Paulo, in an area of 14000 km2. The Brazilian Airports (INFRAERO) has managed it since 1985, when it started operating. The INFRAERO is responsible for the administration of 67 Airports and 81 Air Navigation Support Units throughout Brazil. Aware of its environmental responsibilities, INFRAERO maintains an Environmental Policy compatible with the planning, construction and operations of its activities in accordance to national and international regulations and laws. INFRAERO’s environmental management system is supported by the Environmental Programs developed by the Superintendence of Environment and Energy, the environmental units of the Regional Superintendence and airports, one of them being the Water Resources Program [1]. The AISP can attend about 17 million passengers per year with two air terminals. However, it takes care of about 12 million of users annually and the construction of the third terminal of passengers is been prepared. After this, the AISP will increase its capacity for 29 million passengers per year. It is important to mention that it is one of the main modes of logistics of air cargo, with the largest cargo terminal in South America [2]. In accordance to the Report of the Action Plan [2], the water supply in the AISP is carried out by underground water through wells provided with water meters, which allow the management of the volume of water consumption. The collected water is conveyed to a treatment plant and later distributed to three reservoirs with 199 m3 of capacity each. From these reservoirs the water is conveyed by gravity to the airport. The drainage system conveys the effluents from the AISP to two biological treatment plants. After the treatment the water is conveyed to lagoons and to a stream. The aim of this work is to present the final results of this survey, which was developed at the restroom 93 of the international terminal of passengers, one of them for men and another for women. There are also small restrooms for children and for people with special needs in this restroom 93. 2010 Symposium CIB W062 - Sydney Australia For the study and specification of the water saving technologies to be replaced in restroom 93 of the AISP, which was chosen as a pilot, located in the superior level of the Terminal of Passengers and the international section. Restroom 93 is composed of two restrooms for adults, one for women and the other for men, two small restrooms for children, one for boys and the other for girls. In addition, two special needs restrooms, one male and another female. Figure 1 shows the plant of the studied environments and Table 1 shows the sanitary appliances of the restroom 93. Drink Fontains Lavatories MENS' RESTROOM Urinals BOYS' RESTROOM HANDICAPPED MENS' RESTROOM HANDICAPPED LADIES' RESTROOM GIRLS' RESTROOM Water Closets LADIES' RESTROOM Figure 1 - Plant of Restroom 93 monitored at the International Airport of São Paulo Table 1 – Original situation of the sanitary appliances - restroom 93 - AISP ROOM Ladies’ restroom SANITARY APPLIANCE 6 valve operated water closets(1) (6 l/f) 6 wash basins with electronic faucets 4 valve operated water closets(1) (6 l/f) Men’s restroom 6 wash basins with electronic faucets 5 urinals with electronic valves 1 valve operated water closet (1) (6 l/f) Girls’ restroom 1 wash basin with metering faucet 1 faucet for cleaning 1 valve operated water closet(1) (6 l/f) Boys’ restroom 1 wash basin with metering faucet 1 faucet for cleaning Handicapped ladies’ restroom 1 valve operated water closet(1) (6 l/f) 1 wash basin with metering faucet Handicapped men’s restroom (1) 1 valve operated water closet(1) (6 l/f) 1 wash basin with metering faucet The duration of flush depends on the user, i.e. the volume is variable. 2010 Symposium CIB W062 - Sydney Australia 2. Methodology Initially, 13 water meters (H) were installed. However, after the first series of the water consumption monitoring it was detected a great difference between the total volume measured by the H1 and the sum of the all others. Furthermore, there were problems in the data acquisition system of water meter H13. Thus, the water consumptions measured by the water meters H1 e H13 were not considered. Table 2 shows the water meters used in this survey. Table 2 – Water meters installed in restroom 93 of the AISP Water meter H2 H3 H4 H5 H6 Type and Metrological class Volumetric, class D Volumetric, class D Volumetric, class D Volumetric, class D Volumetric, class C H7 Multi jet, class B H8 H9 H10 H11 H12 Volumetric, class D Volumetric, class D Volumetric, class D Volumetric, class D Multi jet, class B Appliances monitored 5 urinals (electronic) - men’s restroom 5 wash basins with electronic faucets - men’s restroom 1 wash basin with electronic faucet - men’s restroom 1 water faucet for cleaning - men’s restroom 1 wash basin with metering faucet + 1 faucet for cleaning (boys’ restroom) 6 valve operated water closets - 4 in the men’s restroom, 1 in the boys’ restroom and 1 in the special needs restroom (male) 2 drinking fountains - outside hall 1 faucet for cleaning - ladies’ restroom 1 wash basin with electronic faucet - ladies’ restroom 5 wash basins with electronic faucet - ladies’ restroom 8 valve operated water closets(- 6 in the ladies’ restroom, 1 in the girls’ restroom and 1 in the special needs restroom (female) The localization of the water meters was chosen considering the branches that feed just one type of sanitary appliance and also considering the specific difficulties to install them. All water meters were instrumented for remote metering, with pulse transmitters. Water consumption data were recorded and stored in 1-minute intervals. These data were collected weekly. Afterwards, all data were aggregated into periods of 1-hour and 1-day. 2.1 Steps of the research Four steps of monitoring, depending on the water saving technologies were set, as presented in Table 3. Each step of measurement was planned to have 15 days, however, problems in the data acquisition system resulted in different periods of monitoring the water consumption. 2010 Symposium CIB W062 - Sydney Australia Table 3 - Steps and respective water save technologies implemented - restroom 93 AISP Period Step Activity 1 08/12/2009 - 09/01/2009 2 09/04/2009 - 09/18/2009 3 A: 10/28/2009 – 11/09/2009 B: 11/18/2009 – 11/23/2009 C: 02/01/2010 – 02/08/2010 4 A: 02/23/2010 – 03/08/2010 B: 03/10/2010 – 03/15/2010 C: 03/17/2010 – 03/22/2010 D: 03/23/2010 – 03/29/2010 E: 04/07/2010 – 04/12/2010 F: 04/14/2010 – 04/19/2010 Installation of water meters and instrumentation. Original situation of the sanitary appliance (see table 1) Measurement 1: data collect and data analysis Adjustments in the sanitary appliances: flow rates, duration of discharges, volumes Measurement 2: data collect and data analysis Installation of: dual flush valves in the water closets - ladies and men’s restrooms; metering faucets with a special kit for time reducing in the wash basins - ladies and men’s restrooms; electronic faucets in the wash basins – special needs ladies´ and men’s restrooms; and in the boys and girls’ restrooms Measurement 3: data collect and data analysis Installation of: metering faucets in the wash basins - all restrooms electronic valves in the water closets – all restrooms electronic valves with fuzzy logic system in the urinals – men’s restroom Measurement 4: data collect and data analysis The number of passengers per international flight of the companies installed in the influence area of the Restroom 93 was provided by INFRAERO. The average total number of passengers per day in the influence area of the Restroom 93 was estimated in 3468 in 2009 (variation coefficient - CV=16%) in 2009 and 3615 (CV=13%) in 2010. Fridays, Saturdays and Sundays presented the biggest flight load, as expected. It was planned to measure the numbers of uses of each sanitary appliance by using a presence sensor in the entrance of each restroom of the Sanitary 93 and an electronic device in each sanitary appliance. However, these data acquisition systems did not provide reliable results. Thus, it was considered just the number of the passengers for the determination of the consumption indicator (IC). It should be noted, however, that not all passengers entering the restroom in this area, with or without the use of the sanitary appliance. 3. Results and discussion About 84% of the water consumption, on average, has been occurred in the WC in all steps of the investigation, as it is illustrated in the Figure 2. Approximately 51% of the total consumption of the WC was in the feminine restrooms. 2010 Symposium CIB W062 - Sydney Australia 0,25% 1,88% 4,05% 1,32% 0,18% 0,01% 4,11% 3,38% 1,31% 0,00% 0,15% 0,12% 23,78% 46,39% 41,23% 61,31% 0,64% 0,02% 0,22% 3,65% H2 H3 H4 0,58% H5 H6 0,44% 0,04% H7 H8 H9 4,93% H10 H11 H12 H13 H2 H3 H4 Step 1 – Original situation 3,36% 0,45% 6,37% H5 H6 H7 H8 H9 H10 H11 H12 H13 Step 2 – After adjustments 0,24% 0,47% 2,64% 4,75% 0,01% 0,4 3,46% 0,48% 6,77% 0,36% 0,01% 0,00% 0,27% 0,34% 0, 38,51% 30,06% 53,19% 28,42% 53,03% 48,18% 0,94% 0,81% 4,47% H2 H3 H4 H5 H6 H7 H8 H9 H10 0,76% 0,53% H11 H12 0,03% 3,58% 0,01% 1,03% 0,14% H13 H2 H3 H4 0,64% H5 H6 H7 5,15% H8 H9 H10 H11 H12 H2 H3 H4 H5 H6 H7 H8 H9 H10 H11 H12 H13 Step 3 – After the installation of water saving technologies in the wash basins and WC 2,18% 0,43% 0,13% 0,00% 0,21% 9,79% 28,20% 51,43% 0,65% 0,00% 5,86% H2 H3 H4 H5 H6 H7 H8 H9 1,12% H10 H11 H12 H2 -5 urinals - men’s restroom H3 - 5 wash basins’ faucets - men’s restroom H4 - 1 wash basin - men’s restroom H5 - 1 faucet for cleaning - men’s restroom H6 -1 faucet for cleaning - men’s restroom H7 – 6 water closets - 4 in the men’s restroom, 1 in the boys’ restroom and 1 in the handicapped men’s restroom H8 - 2 drinking fountains - outside hall H9 - 1 faucet for cleaning - ladies’ restroom H10 - 1 wash basin - ladies’ restroom H11 - 5 wash basins - ladies’ restroom H12 – 8 water closets: 6 in the ladies’ restroom, 1 in the girls’ restroom and 1 in the handicapped ladies’ restroom H13 – 1 wash basin and 1 faucet for cleaning H13 Step 4 - after the installation of water saving technologies in the wash basins, WC and urinals Figure 2 - Distribution of the water consumption - restroom 93 - AISP It is also noted that the second sanitary appliance more used was the wash basin. Its water consumption was about 13% in al steps of the investigation. Figure 3 shows the water consumption distribution just for the toilets. 2010 Symposium CIB W062 - Sydney Australia 100% 90% Média : 85% 80% Porcentagem de consumo 70% 60% 50% 40% 30% 20% 10% 0% 4/9 5/9 6/9 7/9 8/9 Data H7 Step 1 – original situation Step 2 – after adjustments 100% 100% 90% 100% Média : 87 % 90% 90% Média : 81% 80% 80% 70% 70% 70% 60% 50% 40% Porcentagem de consumo 80% Porcentagem de consumo Porcentagem de consumo Média : 84% 60% 50% 40% 60% 50% 40% 30% 30% 30% 20% 20% 20% 10% 10% 0% 0% 28/10 29/10 30/10 31/10 1/11 2/11 3/11 4/11 5/11 6/11 7/11 8/11 9/11 10% 0% 18/11 19/11 20/11 21/11 Data H7 H12 22/11 23/11 1/2 2/2 3/2 4/2 Data H12 H7 5/2 6/2 7/2 8/2 Data H12 H7 H12 Step 3 – after the installation of water saving technologies in the wash basins and WC 100% 90% Média : 79 % 80% Porcentagem de consumo 70% 60% 50% 40% 30% 20% 10% 0% 7/4 8/4 9/4 10/4 11/4 12/4 Data H7 H12 Step 4 - after the installation of water saving technologies in the wash basins, WC and urinals H7 – 6 water closets - 4 in the men’s restroom, 1 in the boys’ restroom and 1 in the handicapped men’s restroom H12 – 8 water closets: 6 in the ladies’ restroom, 1 in the girls’ restroom and 1 in the handicapped ladies’ restroom Figure 3 - Distribution of the water consumption of the toilets - restroom 93 -AISP As observed in Figure 3, approximately 56% of the total consumption of the toilets was in the feminine restrooms. This percentage ranged from 24% to 88%. The distribution of the water consumption indicator (L/passenger.day) in all steps of the investigation is shown in Figure 4. First of all, despite being the most representative variable of the water consumption of this type of building, the number of passengers may not be the most appropriate in this specific case, since not all passengers use the restroom before boarding and if they do it, they do not necessarily use the restroom 93. 2010 Symposium CIB W062 - Sydney Australia Figure 4 - Distribution of the water consumption indicator –restroom 93 The initial value of IC was high, ranging from 8.1 to 18.4 L/passager.day in step 1 (S1), with an average of 11.9 L/passenger.day. From step 2 (S2), with the flow rates and duration adjustments, the IC ranged between 7.5 and 7.8 L/passager.day, with an average of 7.7 L/passager.day. In the step 3 (S3 - phases A, B and C), the IC was respectively 7.3, 9.1 and 7.1 L/passager.day. This variantion can be due to diffent users using the restroom in different periods. 2010 Symposium CIB W062 - Sydney Australia The IC reached 7 L/passager.day in the step 4. It can be noted the original situation of the sanitary appliances of the restroom 93 (step 1) already contemplated water saving technologies. The greatest impact of the water consumption was verified in the step 2. This fact shows the importance of a maintenance program of the technologies in order to conserve the reductions in water consumption obtained with the technologies actions. 4. Final considerations The main objective of this study is to evaluate water saving components that represent major water consumption decrease for other restrooms of the airport. This paper presented a survey of the water consumption pattern of one of the international terminal of passengers in the International Airport of São Paulo, Brazil. This restroom is composed of six restrooms, including installation for children and for people with special needs. The results obtained indicate that the WCs represent 84% of the total water consumption of the restroom 93, on average. Approximately 56% of toilets consumption is due to the feminine toilets. The greatest decrease of the water consumption was due to the adjustments made in the water saving technologies already installed in the sanitary 93 originally. It indicates the importance of the periodic maintenance for perpetuating water savings. Acknowledgements The authors thank the Financiadora de Estudos e Projetos - FINEP (Research and Projects Financing – Brazilian Innovation Agency, Ministry of Science and Technology) and Conselho Nacional de Desenvolvimento Científico e Tecnológico – CNPq (The National Council for Scientific and Technological Development, Ministry of Science and Techonology) for the financial support. 5. References [1] [2] INFRAERO – Empresa Brasileira de Infra-Estrutura Aeroportuária. Relatório Ambiental 2005/2006. Brasília 2006. Disponível em: http://www.infraero.gov.br. Acesso em 21 jun. 2009. AEROPORTO INTERNACIONAL DE SÃO PAULO. Relatório do Plano de Gestão de Recursos Hídricos. Vitalux Efifiência Energética Ltda, 2006. Contrato 0053St/2005/0057. 2010 Symposium CIB W062 - Sydney Australia 7. Presentation of Authors Marina Ilha is a Head of Department of Architecture and Construction, School of Civil Engineering, Architecture and Urban Design, Universidade Estadual de Campinas, where she is the Head of the Building Services Research Group. Lúcia Helena de Oliveira is a professor at Department of Construction Engineering of Escola Politécnica of University of São Paulo, Brazil, where she teaches and conducts researches on building services. Wilson Sousa Júnior is a professor at Department of Hydraulics, Instituto Tecnológico de Aeronáutica, where he teaches and conducts researches on Environmental Engineering, with emphasis in integrated water resources planning and economics. Orestes Gonçalves is a professor at Department of Construction Engineering of Escola Politécnica of University of São Paulo, Brazil, where he is the Head of the Building Services Research Group. Marcus André is a PhD student at School of Civil Engineering, Architecture and Urban Design, Universidade Estadual de Campinas, Brazil.
Baixar