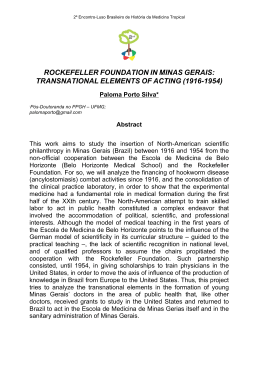
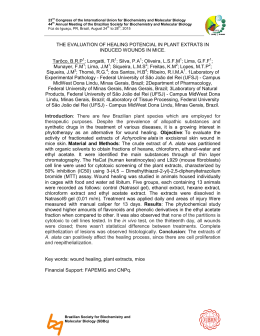
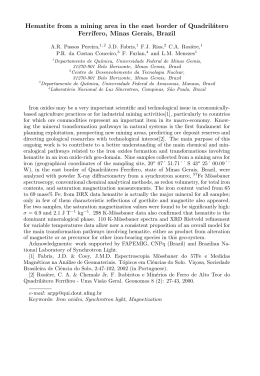
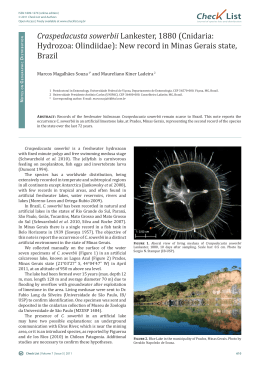
Molecular Phylogenetics and Evolution 57 (2010) 585–597
Contents lists available at ScienceDirect
Molecular Phylogenetics and Evolution
journal homepage: www.elsevier.com/locate/ympev
Biogeographic history of the species complex Basileuterus culicivorus
(Aves, Parulidae) in the Neotropics
Sibelle Torres Vilaça *, Fabrício Rodrigues Santos
Departamento de Biologia Geral, Instituto de Ciências Biológicas, Universidade Federal de Minas Gerais, Brazil
a r t i c l e
i n f o
Article history:
Received 23 December 2009
Revised 27 April 2010
Accepted 21 July 2010
Available online 24 July 2010
Keywords:
Basileuterus culicivorus
Basileuterus hypoleucus
Systematic
Historical biogeography
Population genetics
a b s t r a c t
The taxonomic status of Basileuterus culicivorus complex has been under debate for a long time. There are
uncertainties about the relationships among recognized species (B. culicivorus and B. hypoleucus), and
whether B. culicivorus can be considered as a single species. In order to elucidate the phylogenetic relationships among these species and their biogeographic history we used a broad geographic sampling
from Mexico to Argentina of B. culicivorus and B. hypoleucus. Using a mitochondrial gene, a nuclear intron
and microsatellites we identified highly structured groups according to their spatial distribution. The
known subspecies of B. culicivorus formed monophyletic groups, except two ones from Brazil and
Paraguay. Basileuterus hypoleucus sequences did not form a monophyletic clade, being more related to
B. culicivorus from Brazil and Paraguay. The divergence time analysis indicated that the deep separation
of the basal lineages of B. culicivorus occurred in Late Pliocene. Contrasting with the other geographically
structured populations from Central and South America, the clade of birds from Brazil, Paraguay and
Argentina showed a remarkably high population growth starting in the mid-Pleistocene, according to
the most plausible evolutionary scenario expected for parulid birds of a range expansion directed
southwards.
Ó 2010 Elsevier Inc. All rights reserved.
1. Introduction
The genus Basileuterus consists of 24 species inhabiting mainly
South America (Curson et al., 1994). The group occurs mostly in
forests and woodland undergrowth (Ridgely and Tudor, 1989).
The Golden-crowned Warbler, Basileuterus culicivorus, has a broad
and discontinuous distribution from North Mexico to Argentina
and Brazil, and it is often associated with heterogeneous flocks acting as a nuclear species (Maldonado-Coelho and Marini, 2004). It is
considered a common species (Curson et al., 1994), and in some
forests can be the most abundant bird species (Sick, 2001). It is divided in thirteen subspecies that can be grouped into three allopatric groups (‘‘culicivorus”, ‘‘cabanisi” and ‘‘auricapillus”), which
were previously considered as three separate species (Curson
et al., 1994; Ridgely and Tudor, 1989). The White-bellied Warbler,
B. hypoleucus, occurs in the interior of Brazil and Paraguay, and
resembles the Golden-crowned Warbler except for its underparts
that are typically white, instead of yellow.
Species delimitation between B. culicivorus and B. hypoleucus is
still not well defined, and sometimes they are both referred as part
of the B. culicivorus complex, whose species division have been
often questioned by renowned ornithologists (Pinto, 1944; Ridgely
* Corresponding author at: Departamento de Biologia Geral, Instituto de Ciências
Biológicas, Universidade Federal de Minas Gerais, Av Antonio Carlos 6627, C.P. 486,
31270-010 Belo Horizonte, MG, Brazil.
E-mail address: [email protected] (S.T. Vilaça).
1055-7903/$ - see front matter Ó 2010 Elsevier Inc. All rights reserved.
doi:10.1016/j.ympev.2010.07.010
and Tudor, 1989; Sick, 2001). Presently, the American Ornithologists’ Union (AOU) (Emsen et al., 2008) and the Brazilian Ornithological Records Committee (CBRO, 2009) consider the taxa
B. culicivorus and B. hypoleucus as two separate species. Sick
(2001) considers the Golden-crowned Warbler and the White-bellied Warbler as a single species (B. culicivorus) with two subspecies
(B. c. culicivorus and B. c. hypoleucus). Silva (1992) after an extensive
study on the taxonomy and behavior of these two species, concluded that B. hypoleucus could be a geographic race of B. culicivorus. The AOU mention that B. culicivorus and B. hypoleucus are
almost certainly allospecies (allopatric populations) (Emsen et al.,
2008), which could have diverged recently from a common ancestral population. Several authors (Melo-Junior et al., 2001; Robbins
et al., 1999) have used morphological characters to indicate a probable hybridization between sympatric populations of B. culicivorus
and B. hypoleucus. Silva (1992) documented an extensive interbreeding in southeastern Brazil, detecting several mixed-species
pairs and varying degrees of hybridization, with individuals bearing flanks with different grades of yellow and white parts, and
showing that both species responded in play-back records of each
other’s song. Robbins et al. (1999) recognized also a similar situation for both taxa in Paraguay.
Although a major part of the Parulidae diversity is present in
North America, some species have radiated into South America.
The genetic studies with three Parulidae genera occurring in the
Neotropics, Parula (Lovette and Bermingham, 2001), Phaeothlypis
586
S.T. Vilaça, F.R. Santos / Molecular Phylogenetics and Evolution 57 (2010) 585–597
(Lovette, 2004), and Myioborus (Pérez-Emán, 2005) have indicated
basal lineages in the northern distribution of these taxa. This hypothesis was also presented by Ericson et al. (2003), who suggested that
the primary radiation of Oscines took place in North America.
Studies of historical biogeography indicated that the Late Pliocene and Early Pleistocene was an important period for avian differentiation in North America (Pérez-Emán, 2005). However,
Lovette (2004) studied six populations of the Phaeothlypis complex,
a genus positioned within Basileuterus according to the wood warbler phylogeny (Lovette and Bermingham, 2002), evidenced that
the lineages were separated in a period considerably earlier than
the Pleistocene/Pliocene boundary. This is an indication that the
genus Basileuterus originated long before the Pleistocene/Pliocene
boundary, since the Phaeothlypis group is nested within the more
ancient Basileuterus radiation.
In this study, our main goal is to study populations of Basileuterus culicivorus and B. hypoleucus using nuclear and mitochondrial
markers and a broad geographic sampling to address the following
questions: (i) do genetic data support the current taxonomic classification?; (ii) how much gene flow is there between B. culicivorus
and B. hypoleucus?; (iii) can we reconstruct the likely scenarios
for the origin and expansion of these parulid species found in South
America?; (iv) which historical pattern recovered from data can explain the current distribution and divergence among populations?
We have used mtDNA and nuclear sequence data to investigate
the deep phylogeny, phylogeography and population structuration
history of the Basileuterus culicivorus complex, and microsatellites
to provide some extra information concerning population differentiation and gene flow.
2. Methods
2.1. Sample collection
A total of seven subspecies of B. culicivorus was investigated,
covering most of the entire range of the species (Fig. 1) and the
three allopatric groups (Table 1). Among the seven subspecies,
were included: B. c. basherii, B. c. flavescens, B. c. culicivorus, B. c.
occultus, B. c. olivascens, B. c. azarae and B. c. auricapillus. Each subspecies was identified either in field or according to its defined distribution (Curson et al., 1994; Restall et al., 2005). The subspecies
basherii, flavescens and culicivorus are classified within the ‘‘culicivorus” group; occultus is the only subspecies representing the allopatric group ‘‘cabanisi”, which is restricted to Venezuela and
Colombia; and the subspecies olivascens, azarae and auricapillus
are within the ‘‘auricapillus” group. The species B. hypoleucus was
also sampled from most of its range (Table 1 and Fig. 1).
Tissue and DNA samples are deposited at the DNA bank of our
University (BD-LBEM/UFMG) (www.icb.ufmg.br/lbem/ddb). Some
tissues were borrowed from collections of the Museu Paraense
Emilio Goeldi (MPEG), Laboratório de Genética e Evolução Molecular de Aves (LGEMA) from Universidade de São Paulo (USP), University of Kansas Natural History Museum (KUNHM), Field Museum of
Natural History (FMNH), and American Museum of Natural History
(AMNH). Twenty-six museum skins from the Ornithological Collection, Department of Zoology, from Universidade Federal de Minas
Gerais were included only in the microsatellite analysis. In total,
58 out 150 DNA samples are also deposited as specimen vouchers
in the Ornithological collections (Table 1).
Fig. 1. Distribution map of the species Basileuterus culicivorus (light gray) and B. hypoleucus (dark gray) with samples used in this study. The dotted lines shows probable
genetic breaks of each clade showed in the phylogenetic tree.
587
S.T. Vilaça, F.R. Santos / Molecular Phylogenetics and Evolution 57 (2010) 585–597
Table 1
Basileuterus samples used in this study.
Species
Basileuterus
Basileuterus
Basileuterus
Basileuterus
Basileuterus
Basileuterus
Basileuterus
Basileuterus
Basileuterus
Basileuterus
Basileuterus
Basileuterus
Basileuterus
Basileuterus
Basileuterus
Basileuterus
Basileuterus
Basileuterus
Basileuterus
Basileuterus
Basileuterus
Basileuterus
Basileuterus
Basileuterus
Basileuterus
Basileuterus
Basileuterus
Basileuterus
Basileuterus
Basileuterus
Basileuterus
Basileuterus
Basileuterus
Basileuterus
Basileuterus
Basileuterus
Basileuterus
Basileuterus
Basileuterus
Basileuterus
Basileuterus
Basileuterus
Basileuterus
Basileuterus
Basileuterus
Basileuterus
Basileuterus
Basileuterus
Basileuterus
Basileuterus
Basileuterus
Basileuterus
Basileuterus
Basileuterus
Basileuterus
Basileuterus
Basileuterus
Basileuterus
Basileuterus
Basileuterus
Basileuterus
Basileuterus
Basileuterus
Basileuterus
Basileuterus
Basileuterus
Basileuterus
Basileuterus
Basileuterus
Basileuterus
Basileuterus
Basileuterus
culicivorus
culicivorus
culicivorus
culicivorus
culicivorus
culicivorus
culicivorus
culicivorus
culicivorus
hypoleucus
hypoleucus
hypoleucus
hypoleucus
culicivorus
culicivorus
hypoleucus
hypoleucus
culicivorus
culicivorus
culicivorus
culicivorus
culicivorus
culicivorus
culicivorus
culicivorus
hypoleucus
hypoleucus
hypoleucus
hypoleucus
culicivorus
hypoleucus
hypoleucus
hypoleucus
hypoleucus
hypoleucus
hypoleucus
hypoleucus
hypoleucus
hypoleucus
culicivorus
culicivorus x hypoleucus
culicivorus*
culicivorus*
culicivorus*
culicivorus
culicivorus
culicivorus*
culicivorus*
culicivorus*
culicivorus
culicivorus*
culicivorus*
culicivorus*
culicivorus*
culicivorus*
hypoleucus
culicivorus
culicivorus
culicivorus
culicivorus
culicivorus
hypoleucus
hypoleucus
hypoleucus
hypoleucus
hypoleucus
hypoleucus
hypoleucus
culicivorus
culicivorus
hypoleucus
hypoleucus
Subspeciesà
Catalogue number
Locality
Cyt-b
BF5
olivascens
olivascens
basherii
basherii
basherii
basherii
olivascens
olivascens
azarae
AMNH GFB 2876
AMNH GFB 2877
AMNH PEP 1241
AMNH PEP 1254
AMNH PEP 1255
AMNH PEP 1279
AMNH PRS 797
AMNH PRS 805
AMNH PRS 1098
DZ0270
DZ2896
DZ3161
DZ3163
DZ3584
DZ3595
DZ3704
DZ3775
DZ3825
DZ3861
DZ3862
DZ3871
DZ4071
DZ4266
DZ4347
DZ4352
DZ4369
DZ4453
DZ4821
DZ4861
DZ4919
DZ4949
DZ4979
DZ4980
DZ4981
DZ5016
DZ5200
DZ5215
DZ5225
DZ5311
DZ5641
DZ5642
FMNH 343400
FMNH 343401
FMNH 343404
FMNH 393946
FMNH 393947
FMNH 393948
FMNH 393949
FMNH 395479
FMNH 395798
FMNH 427306
FMNH 427307
FMNH 427308
FMNH 427309
FMNH 434208
KU 100
KU 1918
KU 3269
KU 3390
KU 359
KU 360
KU 395
KU 396
KU 397
KU 398
KU 407
KU 410
KU 51
KU 5924
KU 5932
KU 65
LBEM B0272
Venezuela: Bolivar, Cerro Guanay
Venezuela: Bolivar, Cerro Guanay
Mexico: Molango
Mexico: Molango
Mexico: Molango
Mexico: Molango
Venezuela: Bolivar, Cerro Guanay
Venezuela: Bolivar, Cerro Guanay
Argentina: Buenos Aires
Brazil: Uberlândia, Minas Gerais
Brazil: Contagem, Minas Gerais
Brazil: Belo Horizonte, Minas Gerais
Brazil: Itumirim, Minas Gerais
Brazil: Leme do Prado, Minas Gerais
Brazil: Francisco Sá, Minas Gerais
Brazil: São Gonçalo do Rio Abaixo, Minas Gerais
Brazil: Perdões, Minas Gerais
Brazil: Grão Mogol, Minas Gerais
Brazil: José Goncalves de Minas, Minas Gerais
Brazil: José Gonçalves de Minas, Minas Gerais
Brazil: Turmalina, Minas Gerais
Brazil: Leme do Prado, Minas Gerais
Brazil: Mariana, Minas Gerais
Brazil: Mariana, Minas Gerais
Brazil: Mariana, Minas Gerais
Brazil: Perdões, Minas Gerais
Brazil: Nova Lima, Minas Gerais
Brazil: Santa Bárbara, Minas Gerais
Brazil: Congonhas, Minas Gerais
Brazil: Divino, Minas Gerais
Brazil: Brazilândia de Minas, Minas Gerais
Brazil: Chapada dos Guimarães, Mato Grosso
Brazil: Chapada dos Guimarães, Mato Grosso
Brazil: Chapada dos Guimarães, Mato Grosso
Brazil: Felixlândia, Minas Gerais
Brazil: Catas Altas, Minas Gerais
Brazil: Congonhas, Minas Gerais
Brazil: Congonhas, Minas Gerais
Brazil: Gonçalves, Minas Gerais
Brazil: Gonçalves, Minas Gerais
Brazil: Gonçalves, Minas Gerais
Mexico: Puerto los Mazos, Sierra de Manantlan
Mexico: Puerto los Mazos, Sierra de Manantlan
Mexico: El Bastonal, Sierra de Santa Martha
Mexico: Sierra de Santa Martha
Mexico: Sierra de Santa Martha
Mexico: Puerto los Mazos, Sierra de Manantlan
Mexico: Puerto los Mazos, Sierra de Manantlan
Brazil: Boraceia, São Paulo
Mexico
Brazil: Mata do Estado, Pernambuco
Brazil: Taquaritinga do Norte, Pernambuco
Brazil: Taquaritinga do Norte, Pernambuco
Brazil: Ibateguara, Alagoas
El Salvador: San Pedro Puxtla
Paraguay: Concepcion, San Luis NP
Mexico: Campeche, Calakmul
Paraguay: Misiones, Estancia Santa Ana
Paraguay: Paraguay Neembucu, Cerrito
Paraguay: Caazapa, San Rafael NP
Paraguay: Caazapa, San Rafael NP
Paraguay: Concepcion, San Luis NP
Paraguay: Caazapa, San Rafael NP
Paraguay: Concepcion, San Luis NP
Paraguay: Caazapa, San Rafael NP
Paraguay: Concepcion, San Luis NP
Paraguay: Concepcion, San Luis NP
Paraguay: Concepcion, San Luis NP
El Salvador: Ahuachapan, Canton Concepcion
El Salvador: Ahuachapan, Canton Concepcion
Paraguay: Concepcion, San Luis NP
Brazil:Nova Lima, Mata da Piedade, Minas Gerais
GU189067
GU189068
GU189069
GU189070
GU189071
GU189072
GU189073
GU189074
GU189075
GU189189,
GU189189,
GU189237,
GU189230,
GU189236,
GU189237,
GU189189,
GU189182,
azarae
azarae
azarae
azarae
azarae
azarae
azarae
azarae
azarae
azarae
azarae
azarae
flavescens
flavescens
culicivorus
culicivorus
culicivorus
flavescens
flavescens
azarae
flavescens
auricapillus
auricapillus
auricapillus
auricapillus
culicivorus
culicivorus
azarae
azarae
azarae
azarae
culicivorus
culicivorus
GU189076
GU189077
GU189078
GU189079
GU189080
GU189081
GU189082
GU189083
GU189084
GU189085
GU189086
GU189087
GU189088
GU189089
GU189090
GU189091
GU189092
GU189093
GU189094
GU189095
GU189096
GU189097
GU189098
GU189099
GU189100
GU189101
GU189102
GU189103
GU189104
GU189105
GU189106
GU189107
GU189108
GU189110
GU189109
GU189111
GU189210
GU189196
GU189238
GU189235
GU189237
GU189238
GU189189
GU189182
GU189191, GU189215
GU189207, GU189210
GU189196, GU189198
GU189182, GU189217
GU189182, GU189196
GU189182, GU189186
GU189191,GU189193
GU189191, GU189204
GU189233, GU189234
GU189233, GU189236
GU189191, GU189203
GU189193,
GU189189,
GU189192,
GU189191,
GU189182,
GU189211,
GU189206,
GU189191,
GU189191,
GU189231,
GU189210,
GU189196,
GU189223,
GU189210,
GU189210,
GU189189,
GU189182,
GU189182,
GU189182,
GU189189,
GU189195,
GU189193,
GU189191,
GU189196,
GU189196,
GU189193
GU189224
GU189204
GU189202
GU189189
GU189213
GU189210
GU189201
GU189191
GU189232
GU189217
GU189210
GU189223
GU189210
GU189217
GU189210
GU189196
GU189224
GU189196
GU189211
GU189210
GU189200
GU189193
GU189210
GU189210
(continued on next page)
588
S.T. Vilaça, F.R. Santos / Molecular Phylogenetics and Evolution 57 (2010) 585–597
Table 1 (continued)
Subspeciesà
Species
Basileuterus
Basileuterus
Basileuterus
Basileuterus
Basileuterus
Basileuterus
Basileuterus
Basileuterus
Basileuterus
Basileuterus
Basileuterus
Basileuterus
Basileuterus
Basileuterus
Basileuterus
Basileuterus
Basileuterus
Basileuterus
Basileuterus
Basileuterus
Basileuterus
Basileuterus
Basileuterus
Basileuterus
Basileuterus
Basileuterus
Basileuterus
Basileuterus
Basileuterus
Basileuterus
Basileuterus
Basileuterus
Basileuterus
Basileuterus
Basileuterus
Basileuterus
Basileuterus
Basileuterus
Basileuterus
Basileuterus
Basileuterus
Basileuterus
Basileuterus
Basileuterus
Basileuterus
Basileuterus
Basileuterus
Basileuterus
Basileuterus
Basileuterus
Basileuterus
Basileuterus
Basileuterus
Basileuterus
Basileuterus
Basileuterus
Basileuterus
Basileuterus
Basileuterus
Basileuterus
Basileuterus
Basileuterus
Basileuterus
Basileuterus
Basileuterus
Basileuterus
Basileuterus
Basileuterus
Basileuterus
Basileuterus
Basileuterus
Basileuterus
Basileuterus
hypoleucus
hypoleucus
hypoleucus
hypoleucus
hypoleucus
hypoleucus
hypoleucus
hypoleucus
culicivorus
hypoleucus
hypoleucus
hypoleucus
hypoleucus
hypoleucus
hypoleucus
hypoleucus
hypoleucus
hypoleucus
hypoleucus
hypoleucus
culicivorus
culicivorus
culicivorus
culicivorus
culicivorus
culicivorus
culicivorus
culicivorus
culicivorus
culicivorus
culicivorus
culicivorus
culicivorus
culicivorus
culicivorus
culicivorus
culicivorus
culicivorus
culicivorus
culicivorus
culicivorus
culicivorus
culicivorus
culicivorus
culicivorus
culicivorus
culicivorus
culicivorus
culicivorus
culicivorus
culicivorus
culicivorus
culicivorus
culicivorus
culicivorus
culicivorus
culicivorus
culicivorus
culicivorus
culicivorus
culicivorus
culicivorus
culicivorus
culicivorus
culicivorus
hypoleucus
culicivorus
culicivorus
culicivorus
culicivorus
culicivorus
culicivorus
culicivorus
azarae
azarae
azarae
azarae
azarae
azarae
azarae
azarae
azarae
azarae
azarae
azarae
azarae
azarae
azarae
azarae
azarae
azarae
azarae
azarae
azarae
azarae
azarae
azarae
azarae
azarae
azarae
azarae
azarae
azarae
azarae
azarae
azarae
azarae
azarae
azarae
azarae
occultus
occultus
azarae
azarae
azarae
azarae
azarae
azarae
azarae
azarae
azarae
azarae
azarae
azarae
azarae
azarae
azarae
Catalogue number
Locality
Cyt-b
BF5
LBEM B0273
LBEM B0274
LBEM B0275
LBEM B0276
LBEM B0277
LBEM B0278
LBEM B0279
LBEM B0280
LBEM B0502
LBEM B1473
LBEM B1476
LBEM B1487
LBEM B1491
LBEM B1610
LBEM B1613
LBEM B1624
LBEM B1628
LBEM B1717
LBEM B1728
LBEM B2057
LBEM B2106
LBEM B2144
LBEM B2145
LBEM B2146
LBEM B2147
LBEM B2148
LBEM B2149
LBEM B2150
LBEM B2195
LBEM B2214
LBEM B2242
LBEM B2243
LBEM B2244
LBEM B2260
LBEM B2263
LBEM B2272
LBEM B2293
LBEM B2492
LBEM B2543
LBEM B2544
LBEM B2547
LBEM B2640
LBEM B2673
LBEM B2674
LBEM B2675
LBEM B2686
LBEM B2711
LBEM B2712
LBEM B2713
LBEM B2748
LBEM B2920
LBEM B2921
LBEM B2922
LBEM B3124
LBEM B3125
LBEM B3127
LBEM B3589
LBEM B3590
LGEMA 10287
LGEMA 10288
LGEMA 1122
LGEMA 11423
LGEMA 11442
LGEMA 1158
LGEMA 1159
LGEMA 1242
LGEMA 1246
LGEMA 1248
LGEMA 1272
LGEMA 1430
LGEMA 1439
LGEMA 1441
LGEMA 1765
Brazil: Nova Lima, Mata da Piedade, Minas Gerais
Brazil: Nova Lima, Mata dos Primos, Minas Gerais
Brazil: Nova Lima, Mata dos Primos, Minas Gerais
Brazil: Nova Lima, Mata dos Primos, Minas Gerais
Brazil: Nova Lima, Mata dos Primos, Minas Gerais
Brazil: Nova Lima, Mata do Jambreiro, Minas Gerais
Brazil: Nova Lima, Mata do Jambreiro, Minas Gerais
Brazil: Nova Lima, Mata do Jambreiro, Minas Gerais
Brazil: Jaboticatubas, Minas Gerais
Brazil: Felixlândia, Minas Gerais
Brazil: Brazilândia de Minas, Minas Gerais
Brazil: Brazilândia de Minas, Minas Gerais
Brazil: Felixlândia, Minas Gerais
Brazil: Felixlândia, Minas Gerais
Brazil: Felixlândia, Minas Gerais
Brazil: Brazilândia, Minas Gerais
Brazil: Felixlândia, Minas Gerais
Brazil: Brazilândia de Minas, Minas Gerais
Brazil: Brazilândia de Minas, Minas Gerais
Brazil: Brazilândia de Minas, Minas Gerais
Brazil: Bocaiúva, Minas Gerais
Brazil: Turmalina, Minas Gerais
Brazil: Turmalina, Minas Gerais
Brazil: Turmalina, Minas Gerais
Brazil: Leme do Prado, Minas Gerais
Brazil: Leme do Prado, Minas Gerais
Brazil: José Gonçalves de Minas, Minas Gerais
Brazil: José Gonçalves de Minas, Minas Gerais
Brazil: Bocaiúva, Minas Gerais
Brazil: Bocaiúva, Minas Gerais
Brazil: Bocaiúva, Minas Gerais
Brazil: Bocaiúva, Minas Gerais
Brazil: Bocaiúva, Minas Gerais
Brazil: Bocaiúva, Minas Gerais
Brazil: Bocaiúva, Minas Gerais
Brazil: Bocaiúva, Minas Gerais
Brazil: Bocaiúva, Minas Gerais
Brazil: Turmalina, Minas Gerais
Brazil: Água Doce do Norte, Espírito Santo
Brazil: Alfredo Chaves, Espírito Santo
Brazil: Alto Rio Novo, Espírito Santo
Brazil: José Gonçalves de Minas, Minas Gerais
Brazil: Conceição do Castelo, Espírito Santo
Brazil: Domingos Martins, Minas Gerais
Brazil: Água Doce do Norte, Espírito Santo
Brazil: Turmalina, Minas Gerais
Brazil: Turmalina, Minas Gerais
Brazil: José Gonçalves de Minas, Minas Gerais
Brazil: José Gonçalves de Minas, Minas Gerais
Brazil: Domingos Martins, Minas Gerais
Brazil: Turmalina, Minas Gerais
Brazil: Turmalina, Minas Gerais
Brazil: Turmalina, Minas Gerais
Brazil: Viçosa, Minas Gerais
Brazil: Viçosa, Minas Gerais
Brazil: Viçosa, Minas Gerais
Colombia: Neira
Colombia: Yotoco
Brazil: Cordeiro, Rio de Janeiro
Brazil: Cantagalo, Rio de Janeiro
Brazil: Juquitiba, São Paulo
Brazil: Ortigueira, Paraná
Brazil: Ortigueira, Paraná
Brazil: Juquitiba, São Paulo
Brazil: Juquitiba, São Paulo
Brazil: Buri, São Paulo
Brazil: Buri, São Paulo
Brazil: Buri, São Paulo
Brazil: Pinhalão, Paraná
Brazil: Morro Grande, São Paulo
Brazil: Morro Grande, São Paulo
Brazil: Morro Grande, São Paulo
Brazil: Parque Nacional do Itatiaia, Rio de Janeiro
GU189112
GU189113
GU189114
GU189115
GU189116
GU189116
GU189118
GU189119
GU189120
GU189121
GU189123
GU189124
GU189122
GU189187,
GU189205,
GU189182,
GU189182,
GU189202,
GU189196,
GU189182,
GU189191,
GU189217,
GU189182,
GU189184,
GU189182,
GU189196,
GU189182,
GU189189,
GU189189,
GU189217,
GU189196,
GU189210,
GU189227,
GU189191,
GU189182,
GU189210,
GU189182,
GU189205,
GU189189,
GU189196,
GU189182,
GU189189,
GU189205,
GU189196,
GU189191,
GU189182,
GU189189,
GU189196,
GU189225,
GU189191,
GU189196,
GU189191,
GU189210,
GU189182,
GU189182,
GU189182,
GU189191,
GU189182,
GU189182,
GU189182,
GU189196,
GU189182,
GU189182,
GU189191,
GU189182,
GU189196,
GU189182,
GU189196,
GU189182,
GU189209,
GU189209,
GU189182,
GU189210,
GU189191,
GU189182,
GU189191,
GU189190,
GU189182,
GU189196,
GU189182,
GU189182,
GU189196,
GU189182,
GU189191,
GU189183,
GU189191,
GU189125
GU189126
GU189127
GU189128
GU189129
GU189130
GU189131
GU189132
GU189133
GU189134
GU189135
GU189136
GU189137
GU189138
GU189139
GU189140
GU189141
GU189142
GU189143
GU189143
GU189145
GU189146
GU189147
GU189148
GU189149
GU189150
GU189151
GU189152
GU189153
GU189154
GU189155
GU189156
GU189157
GU189158
GU189159
GU189160
GU189161
GU189162
GU189176
GU189177
GU189164
GU189178
GU189178
GU189165
GU189166
GU189167
GU189168
GU189169
GU189170
GU189171
GU189172
GU189173
GU189174
GU189210
GU189210
GU189210
GU189239
GU189217
GU189196
GU189182
GU189196
GU189221
GU189182
GU189196
GU189182
GU189214
GU189182
GU189196
GU189191
GU189217
GU189196
GU189218
GU189226
GU189216
GU189182
GU189212
GU189196
GU189209
GU189199
GU189217
GU189188
GU189189
GU189210
GU189210
GU189222
GU189189
GU189210
GU189196
GU189226
GU189217
GU189210
GU189191
GU189217
GU189191
GU189182
GU189217
GU189196
GU189191
GU189182
GU189217
GU189220
GU189185
GU189210
GU189210
GU189191
GU189196
GU189210
GU189196
GU189196
GU189210
GU189209
GU189196
GU189219
GU189210
GU189196
GU189224
GU189196
GU189217
GU189197
GU189196
GU189194
GU189197
GU189217
GU189217
GU189196
GU189191
589
S.T. Vilaça, F.R. Santos / Molecular Phylogenetics and Evolution 57 (2010) 585–597
Table 1 (continued)
Species
Basileuterus
Basileuterus
Basileuterus
Basileuterus
Basileuterus
à
*
culicivorus
culicivorus
culicivorus
culicivorus
culicivorus
Subspeciesà
Catalogue number
Locality
Cyt-b
BF5
azarae
azarae
auricapillus
auricapillus
auricapillus
LGEMA 2989
LGEMA 824
MPEG 61613
MPEG 61614
MPEG A8417
Brazil:
Brazil:
Brazil:
Brazil:
Brazil:
GU189175
GU189163
GU189180
GU189181
GU189182,
GU189217,
GU189205,
GU189182,
GU189208,
Buri, São Paulo
Morro Grande, São Paulo
Querência, Mato Grosso
Querência, Mato Grosso
Ourilândia do Norte, Pará
GU189196
GU189217
GU189210
GU189191
GU189210
According to the defined subspecies distributions indicated by Curson et al. (1994) and Restall et al. (2005).
These specimens also received a field/museum classification according to the subspecies designation.
2.2. DNA extraction and mitochondrial sequencing
We extracted genomic DNA from blood and tissue samples
using standard phenol–chloroform protocol after digestion with
proteinase K (Sambrook and Russel, 2001). For museum skin samples, it was added DTT in the proteinase K step. Extracted DNA was
quantified in 0.8% agarose gel or in Qubit Starter Kit (Invitrogen).
We amplified the entire Cytochrome b (Cyt-b) with the primers
L14841 and H16065 (Sorenson et al., 1999). PCR mixes of 12 lL included 2 lL of genomic DNA, 1 U of Taq polymerase (PhoneutriaÒ),
200 lM of dNTPs, 1 Tris–KCl buffer with 1.5 mM MgCl2 (PhoneutriaÒ) and 0.5 lM of each primer. The amplification program consisted of 2 min at 94 °C, followed by 35 cycles of 40 s at 94 °C,
40 s at 45–50 °C, 2 min at 72 °C and a final extension step of
10 min at 72 °C. After amplification, PCR products were run in
0.8% agarose gels and stained with ethidium bromide. Negative
controls, where template DNA was omitted, were used in all amplification runs. Only products with a single and well-defined band
were used in the sequencing reactions. Before sequencing, PCR
products were cleaned by precipitation using 20% polyethyleneglicol with 2.5 M NaCl. Sequencing reactions were performed using
the primers L14841, IntR (Brumfield and Edwards, 2007), IntF
(Brumfield and Edwards, 2007) and H16065, and were conducted
in a final volume of 10 lL containing: 2 lL of purified PCR product,
3 lL of ultrapure water, 1 lL of primer (5 lM) and 4 lL of sequencing kit (ET DYE Terminator Kit, GE Healthcare). The sequencing
program consisted of 35 cycles of 95 °C for 25 s, 50 °C for 15 s,
60 °C for 3 min. Then, sequencing products were precipitated with
ammonium acetate and ethanol, dried at room temperature, dissolved with formamide-EDTA and run in the automatic sequencer
MegaBACE 1000 (GE Healthcare).
To avoid the amplification of nuclear sequences of mitochondrial origin, i.e. numts (Sorenson and Quinn, 1998), the following
measures were undertaken: (i) we amplified sequences longer
than 1000 bp; (ii) amplification primers had degenerate sites
and/or had annealing sites in tRNA genes; (iii) for each individual,
at least two different PCR products were double strand sequenced
until, at least, two high quality and independent sequences could
be obtained; (iv) chromatograms were carefully checked for ambiguities, or possible heterozygote positions; (v) Cyt-b sequences
produced in the present study were aligned and compared with
others obtained from the GenBank, to check for the presence of
any start, stop or nonsense codons, as well as alignment gaps.
Consensus sequences were obtained and checked through the
programs Phred v. 0.20425 (Ewing et al., 1998), Phrap v.
0.990319 (Ewing and Green, 1998) and Consed 16.0 (Gordon
et al., 1998). Alignments were done using the Clustal W algorithm
implemented in MEGA 4.0 (Tamura et al., 2007) with manual edition whenever it was necessary.
2.3. Nuclear DNA sequencing
Usually, nuclear introns evolve faster than exons due to the reduced selection acting upon their sequences (Fotheringham et al.,
1997). This rapid evolution makes them potentially useful for population comparisons and to evaluate the independent divergence
of mitochondrial and nuclear markers. To evaluate the usefulness
of nuclear markers for phylogeographic studies in the Basileuterus
genus we have sequenced the intron 5 of the nuclear b-fibrinogen
gene (hereafter BF5). The amplification and sequencing was done
with the same protocol used for the mitochondrial Cyt-b gene.
The primers used for amplification and sequencing were BF5L
and BF5H (Brumfield and Edwards, 2007). High quality consensus
sequences were obtained through the programs Phred v. 0.20425
(Ewing et al., 1998), Phrap v. 0.990319 (Ewing and Green, 1998),
Consed 16.0 (Gordon et al., 1998) and Polyphred (Nickerson
et al., 1997). All detected polymorphisms and heterozygote sites
identified by Polyphred were also carefully eye checked in the
aligned chromatograms in Consed. Haplotype inferences for nuclear data were done using the program PHASE version 2 (Stephens
and Donnelly, 2003; Stephens et al., 2001), with analyses run for
100 iterations, 1 thinning interval and a burn-in of 100.
2.4. Microsatellite genotyping
Allelic variation at six microsatellite loci was used to evaluate
the population differentiation. All six loci (Table 3) have been previously described for another Parulidae species. The PCR mixes of
12 lL included 2 lL of genomic DNA, 1 U of Taq polymerase
(PhoneutriaÒ), 200 lM of dNTPs, 1 Tris–KCl buffer with 1.5 mM
Table 2
Estimates for each population: number of haplotypes (H), nucleotide diversity (p), haplotype diversity (h), average number of nucleotide differences (k), neutrality tests (Tajima’s
D and Fu’s Fs) and genetic differentiation (Ust) for the mitochondrial and nuclear intron used in this study. N refers to the number of chromosomal loci sequenced in each
population.
Cyt-b
MEX
MES
COL
VEN
BAP
*
**
BF5
N
H
h
K
p
4
12
2
4
94
4
11
2
3
87
1.00
0.98
1.00
0.83
0.99
12.75
10.57
11.00
3.39
38.34
0.01
0.009
0.01
0.003
0.03
p < 0.05.
p < 0.001.
Tajima’s D
0.31
0.28
0.00
0.18
0.09
Fu’s Fs
0.56
2.8
4.33
0.89
24.02**
Ust
N
H
h
k
p
0.57**
0.57**
0.51**
0.58**
0.53**
8
22
4
8
202
5
12
2
4
41
0.85
0.90
0.50
0.75
0.88
2.07
2.82
0.51
2.02
2.69
0.003
0.005
0.0009
0.004
0.005
Tajima’s D
0.56
0.29
0.61
0.63
1.18
Fu’s Fs
1.113
5.111*
0.172
0.155
26.521**
Ust
0.34**
0.33**
0.36**
0.34**
0.33**
590
S.T. Vilaça, F.R. Santos / Molecular Phylogenetics and Evolution 57 (2010) 585–597
MgCl2 (PhoneutriaÒ), 0.1 lM of the forward primer with a m13 tail
(Schuelke, 2000), 1 lM of the reverse primer and 1 lM of FAM or
HEX fluorescent dyes. Laboratory protocols for amplifying these
loci followed Winker et al. (1999), Stenzler et al. (2004) and King
et al. (2005). After amplification, the products were checked in
polyacrylamide gel electrophoresis, and revealed by silver nitrate
staining (Dias Neto et al., 1993). For genotyping, the PCR products
were eluted in sterilized water and run in the automatic sequencer
MegaBACE 1000 (GE Healthcare). All samples were run with the ET
550-R size standard (GE Healthcare). For double checking, 10% of
the samples were run more than once and all museum skin samples were genotyped at least twice. The software Fragment Profiler
(GE Healthcare) was used to analyze and generate the microsatellite genotypic data.
2.5. Phylogenetic analysis of mitochondrial and nuclear sequence
markers
For estimating the evolutionary model of nucleotide change for
Cyt-b and BF5 sequences we have used Modeltest version 3.7
(Posada and Crandall, 1998) applying the Bayesian Information
Criterion (Posada and Buckley, 2004). The selected model for the
Cyt-b data analysis was the Transversion Model (TVM), which recognizes four separate transversion rates, a single transition rate,
and variable base frequencies, with gamma distributed (C) rate
variation across sites (a = 0.5085) and a proportion of invariant
sites (I = 0.6384). For the BF5 data, the model selected was the
Hasegawa–Kishino–Yano model (HKY), which recognizes variable
base frequencies, variable transition and transversion frequencies,
with transition/transversion ratio (R = 1.4014) and a proportion of
invariant sites (I = 0.9050). Saturation in the DNA sequences was
also examined by plotting the number of transition and transversion substitutions against p-distances for each pairwise comparison using the program Dambe (Xia and Xie, 2001).
For Cyt-b, maximum likelihood (ML) tree analysis was performed in PHYML version 2.4.4 (Guindon and Gascuel, 2003), using
the model selected by Modeltest and 1000 nonparametric bootstraps to evaluate the support of the resulted topologies
(Felsenstein, 1985). Bayesian phylogenetic (BP) analyses were carried out in MrBayes 3.1.2 (Ronquist and Huelsenbeck, 2003) using
two independent runs of four Markov chains (1 cold and 3 heated)
with 20,000,000 generations and sampling every 100 generations.
An initial tree produced by Maximum Parsimony (MP) in MEGA 4
(Tamura et al., 2007) was randomly chosen and used to accelerate
the convergence. The first 25% of the sampling trees and estimated
parameters were discarded as burn-in. Results of log-likelihood
scores were plotted against generation times to identify the point
at which log-likelihood values reached an equilibrium state (stationary). For the ML and BP phylogenetic analysis we have used
Cyt-b sequences retrieved from Genbank as outgroups: Basileuterus
rivularis, B. tristriatus and B. flaveolus.
2.6. Population structure analysis
2.6.1. Nuclear and mitochondrial DNA
To calculate the nucleotide diversity (p), haplotype diversity (h)
and the average number of nucleotide differences (k) we used the
program DNAsp version 4.5 (Rozas et al., 2003). Guided by the phylogenetic results, we used the program Arlequin version 3.11
(Excoffier et al., 2005) to estimate the genetic differences between
the groups based on Ust (an Fst analogue that considers allelic differences) with the Analysis of Molecular Variance (AMOVA) approach
(Excoffier et al., 1992). We also used Arlequin to calculate Tajima’s
D and Fu’s Fs to assess any departure from neutrality that could
indicate a signal of population expansion. In addition, we also used
the AMOVA to test if there are any genetic differences that can be
non-randomly associated with the two species B. culicivorus and
B. hypoleucus. For this test, we used individuals from Brazil and
Paraguay, the only two countries with samples of both species.
2.6.2. Microsatellites
In order to characterize variation in each locus, we tested the
departures from Hardy–Weinberg equilibrium using Arlequin
(Excoffier et al., 2005). The frequency of null alleles was estimated
according to Brookfield (1996) in the software Microchecker (Van
Oosterhout et al., 2004, 2006). AMOVA analysis was also performed
in Arlequin, as previously described. Thus, to measure the amount
of genetic differentiation attributable among the groups established in the phylogenetic analysis, we estimated the conventional
Fst that considers only the frequency of alleles and also the Rst that
takes into account the square differences between allele repeat
numbers. The statistical significance was determined by a permutation procedure.
2.7. Molecular clock and divergence time estimates
We used the Bayesian approach implemented in BEAST version
1.4.7 (Drummond and Rambaut, 2007) to calculate the divergence
times between phylogenetic groups detected by Cyt-b analysis.
For the estimation of the time to the most recent common ancestor (TMRCA), we investigated four population models: constant
population size, exponential growth, logistic growth and expansion growth. To assess which model was the best fit for the data,
the associated Bayes Factors were estimated (Suchard et al., 2001).
Since a clock-like evolution was rejected using a likelihood ratio
test in Paup (Swofford, 1993) and by the estimation of the parameter ucld.stdev in BEAST, we have applied an uncorrelated log-normal relaxed-clock. Due to the absence of parulid fossil record, it
was not possible to calibrate a local substitution rate, and we have
used a fixed mutation rate. The Cyt-b rate used of 2.07% mutations/million years in Passeriformes was based on the estimates
of Weir and Schluter (2008), who used several calibrations points.
Because the rate estimated by Weir and Schluter (2008) is associated with an standard deviation, we incorporated the normal distribution to reflect the uncertainty of the original estimation (Ho,
2007). Population size dynamics through time (Drummond et al.,
2005) were also estimated using the Bayesian Skyline plot approach in BEAST. In this method, we used two types of analysis
to get a better estimation of the evolutionary processes that occurred in each population. First, we analyzed all the haplotypes
simultaneously without the assumption of any a priori population
structure. Next, the estimation was performed for the monophyletic groups established according to the phylogenies, except the
group from Colombia with only two individuals. All analyses in
BEAST were run for 70,000,000 generations with a burn-in of
7,000,000. Results were then visualized in Tracer 1.4 (Rambaut
and Drummond, 2007). We employed a GTR + I + G model of evolution with six rate categories, and other priors according to the
default settings provided by BEAST version 1.4.7. Parameters were
sampled every 1000 generations.
3. Results
3.1. Cytochrome b
We obtained a total of 1055 bp for the Cyt-b gene from 115
specimens. Neither stop nor nonsense codons were observed. No
signal of saturation was observed among the sequences. We identified 107 unique haplotypes with 228 polymorphic sites, from
which 172 were parsimony informative and 56 were singleton variable sites. All Cyt-b phylogenetic reconstructions identified five
S.T. Vilaça, F.R. Santos / Molecular Phylogenetics and Evolution 57 (2010) 585–597
591
monophyletic groups (Fig. 2). The ML and BP reconstructions found
a consistent separation among five clades: (1) Western Mexico
(MEX), (2) Eastern Mexico and El Salvador (MES), (3) Colombia
(COL), (4) Venezuela (VEN) and (5) Brazil, Paraguay and Argentina
(BAP).
The haplotype pairwise differences within these groups varied
from 3.39 (VEN) to 38.44 (BAP) (Table 2). The uncorrected sequence divergence among groups ranged from 4.4% (COL vs.
VEN) to 6.9% (MEX vs. BAP) with a mean of 5.61%. The Fu’s Fs neutrality test, which is useful to search for additional demographic
signals, showed a remarkable sign of population expansion in the
group of BAP (Table 2). However, the Tajima’s D test was not significant for any population. The specific ust values of each population
(Table 2) are homogeneous, indicating that no population contributes differently to the average ust, and there are no detectable evolutionary constraints in these populations.
The AMOVA analysis found a substantial mtDNA differentiation
across the groups (ust = 0.5138; p < 0.001) with the variation within population (48.62%) and among populations (51.38%) well distributed, which could indicate a significant population structure
with a low overall gene flow. When the AMOVA was performed
taking into consideration the species B. culicivorus and B. hypoleucus from Brazil and Paraguay, the results were not significant
(ust = 0.006; p = 0.54).
The Bayes Factor favored the model that assumes an exponential growth, thus we rejected the other models and used the Exponential Growth Model for our estimation of the time to the most
recent common ancestor (TMRCA). Our analysis with BEAST found
a TMRCA for all haplotypes sampled in this study of 2.54 million
years ago (MYA) (95% credibility interval: 3.17–1.93 MYA). The
TMRCA for each node of the tree is shown in the Fig. 3. When all haplotypes were considered as a single group, the Bayesian Skyline results indicated a rapid population growth starting approximately
500,000 years ago followed by a recent bottleneck (Fig. 4a). When
the populations were considered separately, the MEX population
maintained a relative stable size (Fig. 4b), the MES showed a recent
decline followed by a recovery of the effective size (Fig. 4c), the
VEN group showed a constant slow decline in the last
200,000 years (Fig. 4d), and the BAP population indicates a rapid
growth in the last 500,000 years (Fig. 4e).
3.2. b-Fibrinogen intron 5
For the intron 5 of the nuclear b-fibrinogen gene (BF5), we obtained a total of 572 bp. We found 58 haplotypes and 42 polymorphic sites, with no indel detected, and no signal of recombination.
Of the 58 haplotypes identified, four were observed only in the
group MEX, 10 in the group MES and 36 were exclusive of the
BAP group. The Fu’s Fs test found a significant population expansion for the groups MES and BAP and Tajima’s D found no significant result (Table 2). The AMOVA results suggest, as for Cyt-b, a
highly structured population (ust = 0.3315; p < 0.001) with a twofold higher variation within populations (66.85%) than among populations (33.15%). The highest ust values were observed among the
MEX and VEN populations (ust = 0.70; p < 0.001) and the lowest
among BAP and VEN (ust = 0.01; p = 0.35). When we considered
the differences between B. culicivorus and B. hypoleucus, the AMOVA results were similar as the ones from Cyt-b, with a ust of 0.006
(p = 0.81).
3.3. Microsatellites
The number of alleles obtained for the loci used ranged from 12
to 29. Of the six loci, only the locus DkiD123 was in Hardy–Weinberg equilibrium when considered the entire sample. When analyzed separately in the five geographic groups, most of the loci
Fig. 2. Maximum Likelihood and Bayesian tree using all 115 Cyt-b sequences of B.
culicivorus, B. hypoleucus and three outgroups. Only bootstrap values >50 (before
slash) and posterior probabilities >95 (after slash) are shown. The asterisk indicates
the only clade that showed a difference in topology between ML and BP analysis.
–
–
1.00
1.00
1.00
0.001
*We could not amplify the locus VeCr02 for the populations of VEN and COL and the locus VeCr04 for COL.
Stenzler et al. (2004).
§
Dawson et al. (1997).
¥
Winker et al. (1999).
à
He
–
–
0.833
1.00
1.00
0.667
–
–
1.00
1.00
1.00
0.00
A Ho
–
–
3
4
4
2
–
–
2
2
2
2
n
p
0.00
0.156
0.331
0.116
0.076
0.000
0.821
0.848
0.819
0.887
0.800
0.891
He.
Ho
0.200
0.667
0.833
0.812
0.600
0.4166
7
8
11
10
9
10
A
n
10
12
12
11
10
12
1.00
0.031
0.445
1.00
0.011
1.00
p
He
0.000
0.000
0.000
0.042
0.281
0.029
–
4
6
8
6
6
–
0.750
1.00
1.00
1.00
1.00
–
1.00
1.00
1.00
1.00
0.33
4
4
4
4
4
4
2
3
6
5
5
8
n
–
0.786
0.9285
1.00
0.893
0.929
–
4
4
4
4
4
p
0.370
0.560
0.865
0.888
0.821
0.901
0.252
0.418
0.721
0.854
0.828
0.814
9
10
17
18
14
27
A
n
119
124
122
123
122
124
0.1217
0.1211
0.0737
0.0167
0.0222
0.0659
Na
p
0.00
0.00
0.00
0.012
0.07
0.00
0.414
0.637
0.886
0.897
0.832
0.903
He
Ho.
0.25
0.437
0.743
0.861
0.803
0.781
13
12
21
20
15
29
A
N
136
144
144
144
142
146
FAM
FAM
FAM/HEX
FAM
FAM
HEX
BAP
Fluorescence All samples
Locus
VeCr02à
VeCr04à
DkiD120§
DkiD126§
DkiD123§
Lsw18¥
Ho
He
p
He
n A Ho
A Ho
0.429
0.714
0.893
0.893
0.893
1.00
COL
MES
MEX
VEN
0.500
0.00
0.75
1.00
0.25
1.00
p
S.T. Vilaça, F.R. Santos / Molecular Phylogenetics and Evolution 57 (2010) 585–597
Table 3
Microsatellite loci used for genotyping, including number of samples genotyped (N), number of observed alleles (A), observed (Ho) and expected (He) heterozygosities, significance level of Hardy–Weinberg equilibrium (p) and the
frequency of null alleles (Na).
592
Fig. 3. Condensed tree of the Cyt-b gene, exhibiting the times of divergence of each
clade in million years ago (MYA). The number within brackets shows the 95%
confidence interval for each estimate.
were in equilibrium (see Table 3). The software Microchecker detected a significant frequency of null alleles for the loci VeCr 02,
VeCr 04, DkiD120, and LsW18, when the entire population was
considered. We used the Brookfield’s (1996) method, which assumes that heterozygote deficiencies are mainly due to null alleles
and not population structure. Although the microsatellite loci were
not isolated in the species under study (which could lead to high
levels of null alleles), this assumption is not reasonable, since there
is a significant population structure that could lead to a Wahlund
effect, and in the separated geographic groups most loci show
equilibrium. Moreover, the two loci that showed the highest estimates of null alleles (VeCr 02 and VeCr 04), also showed this pattern in another study for the warblers Vermivora chrysoptera and
V. pinus (Vallender et al., 2007). The analysis of variance in allele
repeat numbers over the populations recovered in the phylogeny
yielded a weighted estimate of Rst = 0.19 (p < 0.001). A similar analysis, taking under consideration only the frequency of alleles, estimated an Fst of 0.07 (p < 0.001). This discrepancy could be due to
the fact that conventional Fst often provide less biased estimates
of differentiation than Rst when the number of scored loci is low
(Gaggiotti et al., 1999), and therefore the further considerations
will only take into account the estimates done with Fst. The only
significant Fst values were observed between the BAP and MES
clades (Fst = 0.09; p < 0.001), BAP and MEX (Fst = 0.08; p = 0.02),
MES and VEN (Fst = 0.08; p = 0.02), and MEX and MES (Fst = 0.08;
p = 0.03). When the two species (B. culicivorus and B. hypoleucus)
S.T. Vilaça, F.R. Santos / Molecular Phylogenetics and Evolution 57 (2010) 585–597
593
Fig. 4. Bayesian Skyline Plot for Cyt-b sequences with a log-normal relaxed clock and a generation time of 1 year (Milot et al., 2000). The y axis is the effective number of
females. The thick solid line is the median estimate and the thin line (grey) show the 95% highest posterior density limits. The x axis is scaled as million years ago (MYA). (a)
all clades, (b) MEX clade, (c) MES clade, (d) VEN clade, (e) BAP clade.
were compared, the results were similar as the ones from mitochondrial and nuclear markers, presenting a non-significant Fst of
0.003 (p = 0.12).
4. Discussion
4.1. Historical biogeography
The Late Pliocene–Pleistocene was a highly active period both
geologically and environmentally in South America (Colinvaux
et al., 1996). The final closure of the Panama Isthmus took place
approximately 2.8 MYA (Coates and Obando, 1996) and the
temperature shifts during this period probably affected both indigenous and immigrant fauna. Our data suggest that the Pliocene–
Pleistocene boundary was an important time for the differentiation
of B. culicivorus, since their TMRCA indicates a basal divergence at
2.54 MYA. On the other hand, a major part of bird diversification
in North America appeared to have taken place before the
Pliocene–Pleistocene boundary (Bermingham et al., 1992;
Garcia-Moreno and Fjeldsa, 2000). Species of the genus Myioborus,
which is closely related to the genus Basileuterus, have diverged
594
S.T. Vilaça, F.R. Santos / Molecular Phylogenetics and Evolution 57 (2010) 585–597
in the Pliocene between 3.6 and 3.9 MYA (Pérez-Emán, 2005). Lovette (2004), studying the radiation of Phaeothlypis, found that the
intraspecific divergence of this group occurred also between 3.0
and 3.8 MYA. These results associated with the estimated dates that
we have found, corroborate the fact that the two parulid genera that
radiated into South America had their initial diversification during
the Late Pliocene. However, Johnson and Cicero (2004) argued that
the Pleistocene was also a significant period for bird speciation,
since many pairs of species have diverged during this period. Within the Parulidae family, species of Dendroica have diversified during
the Pleistocene (Johnson and Cicero, 2004). This period was also an
important period for diversification of B. culicivorus as it coincides
with the divergence of several clades within South America.
The colonization of South America by many Oscine birds precedes the final closure of the Panama Isthmus, since studies with
birds demonstrated that species of northern origin first came to
South America when the continent was still separated (Barker,
2007; Lovette, 2004; Pérez-Emán, 2005; Weir et al., 2009). In a recent analysis, Weir et al. (2009) showed that a family with a northern origin (Icteridae) presented a higher dispersal rate to South
America before the formation of the land bridge in Panama, contrasting with bird families of southern origin, which required a
complete land bridge to cross between the two continents. Interestingly, Mayr (1964) affirms that the Basileuterus colonization of
South America ‘‘surely preceded the closing of the Panama gap”,
but the time was uncertain. Contrasting with previous analyses
and ideas, our results indicate that B. culicivorus expanded into
South America in a time interval posterior to the closure of the
Panama Isthmus. This fact indicates a more recent history of southern dispersion for B. culicivorus, when compared to other Oscine
birds. Additionally, it reveals that although this warbler has a great
capacity of flight, which would be an advantage in order to cross
the ocean waters, it likely arrived in South America flying over connected lands along adjacent forest habitats.
It is believed the Parulidae originated in the northern Central
America, and the two parulid genera endemic in the Neotropics,
Basileuterus and Myioborus, have radiated into South America after
a northern origin (Curson et al., 1994; Mayr, 1964). This hypothesis
was confirmed for the Myioborus genus (Pérez-Emán, 2005) and we
also found similar results for Basileuterus. In this study, the first and
second most basal clades of B. culicivorus, the groups MEX and MES
are from the Mexico and El Salvador, the northernmost extreme of
the species distribution. The general branching pattern consists of a
paraphyletic clustering, whose southern clades are nested within
northern located clades. This indicates that the center of origin for
this species is in the north of its distribution, with a subsequent
spread into the south. All five mtDNA clades show a remarkable
population structuring, which is supported by the high values of
bootstrap and ust analysis. For nuclear intron BF5, a high structuration is also apparent, with several private alleles observed among
the populations. The high geographic resolution exhibited by nuclear and mtDNA analysis suggests that all five groups became isolated
at different times, due to a single and continuous colonization event
from northern ancestral populations through a southward route.
An indication of structuration has also been drawn from microsatellite data in the comparative analysis of the separated populations inferred from the phylogeny. However, microsatellites have
not shown to be as informative as mtDNA and BF5 markers, probably because of their higher mutation rates and levels of homoplasy that could explain the lower Fst values among deeply
diverging phylogroups.
In our dating approach we expect some population events to
precede coalescence of lineages within groups, e.g. the TMRCA for
the monophyletic group COL + VEN + BAP (Fig. 3) should be more
recent than the split of Central American populations originating
South American ones. Therefore, we consider here the TMRCA dates
for monophyletic geographic groups as minimal time estimates
for ancestral population splits. However, some TMRCA estimates
can also work as an upper limit for the split of derived populations,
e.g. the TMRCA estimate joining MES (Central America) and COL +
VEN + BAP (South America) should precede the population split
between both regions. We found that the most basal divergence
of the B. culicivorus lineages occurred in the Late Pliocene. However,
its diversification through South America occurred in a period between 2.22 and 1.45 MYA, which is the period corresponding to
their TMRCA in Colombia (COL + VEN + BAP). Next, B. culicivorus colonized Venezuela and took a southern route of colonization, arriving to Brazil, Argentina and Paraguay. Basileuterus culicivorus
probably used a route through northern-northeastern Brazil since
haplotypes from this region belong to the most basal clade within
the BAP group, which is congruent with the Coastal Corridor that
connected southern and northern patches of savannas during the
Pleistocene (da Silva and Bates, 2002; Quijada-Mascareñas et al.,
2002). This north–south migration pattern is congruent among several birds (da Silva and Bates, 2002; Remsen et al., 1991), mammals
and reptiles (Quijada-Mascareñas et al., 2007), which show a
remarkable resemblance in their distribution areas. Wüster et al.
(2005), studying the rattlesnake Crotalus durissus, a species complex
with a similar distribution to B. culicivorus, found an analogous pattern of sequential migration across North, Central and South America, with very similar dates of arrival in the southern continent.
The Bayesian Skyline Plot of geographic groups indicated that
each population is evolving differently according to demography.
After the B. culicivorus population first arrived in Brazil, Paraguay
and Argentina, they experienced a rapid growth that expanded
its population by several orders. It started 500,000 years ago and
ended 250,000 years ago, a period corresponding to the Middle
Pleistocene. The repeated glaciations during the Pleistocene that
caused the periodical retractions of the Amazon and Atlantic rain
forests (Haffer, 1969, 1993; Quijada-Mascareñas et al., 2007) could
have benefited B. culicivorus. A retraction of the Amazon forest
have allowed the establishment of a corridor of more open vegetation from the northern South America to southern habitats during
the Middle Pleistocene that could have lasted long enough to permit the population growth. Although there is some controversy
about the Amazon forest shrinkage during the Early and Middle
Pleistocene (Colinvaux et al., 1996; Wüster et al., 2005), other studies confirm that such corridors might have existed (da Silva and
Bates, 2002), which is also plausible according to the documented
Milankovich cycles that occurred before the Quaternary glaciations
(Bartlein and Prentice, 1989; Bennett, 1990; Haffer, 1993). Even
though B. culicivorus can be currently found in some open areas
of the Amazon region, particularly close to the Cerrado (Brazilian
savannah), it does not seem to occur in the typical rainforest
biome, probably because it cannot compete with locally adapted
species, including other Basileuterus or even other migratory Parulidae. Thus, the retraction of the rain forests to small fragments separated by dry forests and savannas during the Pleistocene have
likely promoted a new route of migration to B. culicivorus, favoring
its population expansion into South America.
In conclusion, our results enlighten the dynamics of Basileuterus
populations in South America and provide new evidences for Amazon fragmentation and connection with the Cerrado (Brazilian savanna) during the Pleistocene, demonstrating the potential
usefulness of phylogeographical studies of common species with
wide distributions to elucidate the dynamics of processes in a continental scale.
4.2. Phylogeny and systematics
In this study, haplotypes of B. culicivorus and B. hypoleucus
were not recovered as reciprocally monophyletic, suggesting an
S.T. Vilaça, F.R. Santos / Molecular Phylogenetics and Evolution 57 (2010) 585–597
incomplete lineage sorting or an extensive gene flow. Although
these two recognized species cannot be differentiated genetically,
we can distinguish five well supported clades within B. culicivorus
with a strong geographical correlation. The few subspecies represented by samples identified in the field or deposited as vouchers
can also be recognized as monophyletic clades, B. c. flavescens and
B. c. auricapillus, the former within the group MES and the latter
within the major group BAP. The only two individuals classified
as B. c. culicivorus were also grouped within the clade MES. Considering the geographic occurrence of thirteen B. culicivorus subspecies
(Curson et al., 1994; Restall et al., 2005), we could delineate their
possible correlation with other monophyletic clades. The MEX
group is formed by the subspecies B. c. basherii and the COL group
by B. c. occultus. Within the MES clade that includes individuals
from El Salvador, all should belong to the culicivorus subspecies
according to its geographical distribution, supporting the monophyly of this race. The other clade within the MES group is formed
by individuals of the subspecies flavescens. In the VEN clade, all
individuals were collected in the Venezuelan region where the B.
c. olivascens subspecies occurs. Within the BAP group, two subspecies are recognized: B. c. auricapillus and B. c. azarae. Even though
the auricapillus individuals from northeastern Brazil grouped together, in this clade we also have individuals from Paraguay, which
should belong to the azarae race. Thus, the lack of a robust separation between these two subspecies could be resulted either from
incomplete lineage sorting of mtDNA lineages or from an incipient
morphological differentiation used to define both subspecies. However, since the BAP population experienced a recent population
growth, the short divergence time may be not sufficient to reach
mtDNA coalescence within each subspecies.
Considering haplotype divergence estimates, the mean intraspecific divergence observed in Basileuterus culicivorus (5.61% for
mtDNA) was consistent with the values (3.6–6.8%) found for another related species of the genus (Lovette, 2004). However, it is
a high divergence if we compare with other Parulidae: Parula americana – P. pitiayumi, 1.0% (Lovette and Bermingham, 2001); Dendroica townsendi – D. occidentalis, 0.9% (Lovette and Bermingham,
1999); Dendroica nigrescens – D. graciae, 1.5% (Lovette and
Bermingham, 1999); Dendroica coronata – D. auduboni, 0.4% (Lovette and Bermingham, 1999). This low divergence pattern observed
among other parulid species contrasts strikingly with the high geographic structuring and genetic diversity of the Basileuterus genus,
as already highlighted by Lovette and Bermingham (2001) and also
detailed in this study.
Silva (1992) already noticed that several specimens of B. hypoleucus displayed variations in the intensities and distribution of
the yellow color in museum skins. Even though white color is observed in their underparts, the yellow is frequently present in specimens classified as B. hypoleucus. We also observed this pattern in
the museum skins analyzed for this study. Silva (1992) also demonstrated that in regions where these two species are sympatric,
the intensity of yellow in B. hypoleucus is higher, which could indicate elevated levels of admixture. Therefore, it also suggested that
in the allopatric areas of occurrence of B. hypoleucus there should
be less introgression of genes from B. culicivorus.
If we consider the BAP group phylogeny, B. hypoleucus Cyt-b haplotypes are represented by the most basal lineages (KU407 and
KU397). Thus we can infer that this taxon (or some individuals)
probably differentiated in the past, when the first migrants arrived
in the countries of Brazil and Paraguay. However, our results indicate that there is no present reproductive barrier between these
recognized species. Although it is not currently possible to distinguish genetically between these two species, the restricted area of
occurrence of B. hypoleucus could suggest either that this is an
incipient species in the process of differentiation or the white color
is a restricted polymorphism of a major taxon, B. culicivorus. Our re-
595
sults and the observation that these recognized species do not own
differences in vocalization or morphometry (Silva, 1992), might be
a strong indication that these belong to a single species.
Following the unified species concept (de Queiroz, 1998, 2005,
2007) a lineage to be considered a different species has to be evolving separately from other lineages. Considering other species’
concepts, as the biological (which takes into consideration reproductive isolation), isolation (which considers isolating mechanisms), recognition (mating and fertilization compatible),
monophyletic (reciprocal monophyly) and genealogical (coalescence of alleles) (see de Queiroz, 2007, for a review of species concepts) each property of different concepts should only be seen as
an evidence of lineage separation. Considering the arguments above,
B. culicivorus and B. hypoleucus do not retain any characteristics that
could distinguish them as separate species. However, the lack of
characteristics that could corroborate their separation does not
mean that they are not separate species, since ‘‘the farther along lineages are in the process of divergence, the larger the number of differences they can be expected to have acquired relative to one
another, and therefore the easier it should be to find evidence of separation” (de Queiroz, 2007). Since we have used different markers
(mitochondrial and nuclear) and our findings are corroborated by
another morphological study (Silva, 1992), we consider that the
hypothesis of existence of two species is not supported, and we propose that these two taxa should be lumped in a single species Basileuterus culicivorus.
Regarding the five sub-clades or phylogroups recovered in the
phylogenetic tree, we have not observed any grouping according
to the three allopatric divisions suggested by Curson et al.
(1994). The phylogeny also failed in separating some subspecies,
indicating that they could be evolving as a single taxon (e.g. auricapillus azarae). Thus, supported by our data and by distinct morphological characteristics that define each subspecies or species
(Curson et al., 1994), the identified clades should be considered
in further studies as possible independent taxa: the groups MEX
(basherii), MES (with likely two sub-taxa: flavescens and culicivorus), COL (occultus), VEN (olivascens), and BAP (with likely three
sub-taxa: azarae, auricapillus and hypoleucus). Whether these
clades can be defined as five different subspecies or even species,
demands further studies in a larger sampling.
Finally, this detailed phylogenetic analysis of the Goldencrowned Warbler (B. culicivorus) depicts the importance of the
study of common bird species to understand patterns of range
expansion and colonization in the Neotropics. Moreover, it illustrates an interesting biogeographic scenario that could be mirrored
by many other species colonizing South America after the closure
of the Panama Isthmus, which were likely subjected to Pleistocenic
vicariant events.
Acknowledgments
STV and FRS were supported by CNPq (National Research Council of Brazil). We are extremely grateful to curators and collection
managers who provided genetic material loans: Paul Sweet (American Museum of Natural History, USA), John Bates and David Willard (Field Museum of Natural History, USA), Alexandre Aleixo
and Fabiola Poletto (Museu Paraense Emílio Goeldi, Brazil), Mark
Robbins (University of Kansas Natural History Museum, USA),
and Gustavo Cabanne and Cristina Miyaki (Universidade de São
Paulo, Brazil). We also thank the ornithologists Lucas Carrara and
Marcelo Vasconcelos for providing blood samples and the morphological identification of some birds. Thanks also to Eduardo M.
Tarazona-Santos for helping us at different phases of this research
and making constructive comments. We also thank Irby Lovette
and a anonymous reviewer for valuable comments on this paper.
596
S.T. Vilaça, F.R. Santos / Molecular Phylogenetics and Evolution 57 (2010) 585–597
This study received research grants from CNPq and FAPEMIG (State
foundation of Science).
References
Barker, F.K., 2007. Avifaunal interchange across the Panamanian isthmus: insights
from Campylorhynchus wrens. Biol. J. Linn. Soc. 90, 687–702.
Bartlein, P.J., Prentice, I.C., 1989. Orbital variations, climate and paleoecology.
Trends Ecol. Evol. 4, 195–199.
Bennett, K.D., 1990. Milankovitch cycles and their effects on species in ecological
and evolutionary time. Paleobiology 16, 11–21.
Bermingham, E., Rohwer, S., Freeman, S., Wood, C., 1992. Vicariance biogeography
in the pleistocene and speciation in north-American wood warblers – a test of
mengel model. Proc. Natl. Acad. Sci. USA 89, 6624–6628.
Brookfield, J.F.Y., 1996. A simple new method for estimating null allele frequency
from heterozygote deficiency. Mol. Ecol. 5, 453–455.
Brumfield, R.T., Edwards, S.V., 2007. Evolution into and out of the Andes: a Bayesian
analysis of historical diversification in Thamnophilus antshrikes. Evolution 61,
346–367.
CBRO, 2009. Listas das aves do Brasil. Available from: <http://www.cbro.org.br>.
Coates, A.G., Obando, J.A., 1996. The geologic evolution of the central American
Isthmus. In: Jackson, J.B.C., Budd, A.F., Coates, A.G. (Eds.), Evolution and
Enviroment in Tropical America. Univ. Chicago Press, Chicago, pp. 21–56.
Colinvaux, P.A., De Oliveira, P.E., Moreno, J.E., Miller, M.C., Bush, M.B., 1996. A long
pollen record from lowland Amazonia: forest and cooling in glacial times.
Science 274, 85–88.
Curson, J., Quinn, D., Beadle, D., 1994. New World Warblers. Cristopher Helm,
London.
DaSilva, J.M.C., Bates, J.M., 2002. Biogeographic patterns and conservation in the
South America Cerrado: a tropical savanna hotspot. Bioscience 52, 225–233.
de Queiroz, K., 1998. The general lineage concept of species, species criteria, and the
process of speciation. In: Howard, D.J., Berlocher, S.H. (Eds.), Endless Forms:
Species and Speciation. Oxford University Press, Oxford, pp. 57–75.
de Queiroz, K., 2005. A unified species concept and its consequences for the future
of taxonomy. Proc. Calif. Acad. Sci. 56, 196–215.
de Queiroz, K., 2007. Species concepts and species delimitation. Syst. Biol. 56, 879–
886.
Dias Neto, E., Santos, F.R., Pena, S.D., Simpson, A.J., 1993. Sex determination by low
stringency PCR (LS-PCR). Nucleic Acids Res. 21, 763–764.
Drummond, A.J., Rambaut, A., 2007. BEAST: Bayesian evolutionary analysis by
sampling trees. BMC Evol. Biol. 7.
Drummond, A.J., Rambaut, A., Shapiro, B., Pybus, O.G., 2005. Bayesian coalescent
inference of past population dynamics from molecular sequences. Mol. Biol.
Evol. 22, 1185–1192.
Emsen, J.V., Cadena, C.D., Jaramillo, A., Nores, M., Pacheco, J.F., Robbins, M.B.,
Schulenberg, T.S., Stiles, F.G., Stotz, D.F., Zimmer, K.J., 2008. A classification of
the bird species of South America. American Ornithologists’ Union.
Ericson, P.G.P., Irestedt, M., Johansson, U.S., 2003. Evolution, biogeography, and
patterns of diversification in passerine birds. J. Avian Biol. 34, 3–15.
Ewing, B., Green, P., 1998. Base-calling of automated sequencer traces using phred.
II. Error probabilities. Genome Res. 8, 186–194.
Ewing, B., Hillier, L., Wendl, M.C., Green, P., 1998. Base-calling of automated
sequencer traces using phred. I. Accuracy assessment. Genome Res. 8, 175–185.
Excoffier, L., Laval, G., Schneider, S., 2005. Arlequin ver. 3.0: an integrated software
package for population genetics data analysis. Evol. Bioinform. Online 1, 47–50.
Excoffier, L., Smouse, P.E., Quattro, J.M., 1992. Analysis of molecular variance
inferred from metric distances among DNA haplotypes – application to human
mitochondrial-DNA restriction data. Genetics 131, 479–491.
Felsenstein, J., 1985. Confidence-limits on phylogenies – an approach using the
bootstrap. Evolution 39, 783–791.
Fotheringham, J.R., Martin, P.R., Ratcliffe, L., 1997. Song transmission and auditory
perception of distance in wood warblers (Parulinae). Anim. Behav. 53, 1271–
1285.
Gaggiotti, O.E., Lange, O., Rassmann, K., Gliddon, C., 1999. A comparison of two
indirect methods for estimating average levels of gene flow using microsatellite
data. Mol. Ecol. 8, 1513–1520.
Garcia-Moreno, J., Fjeldsa, J., 2000. Chronology and mode of speciation in the
Andean avifauna. Bonner Zoologische Monographien 46, 25–46.
Gordon, D., Abajian, C., Green, P., 1998. Consed: a graphical tool for sequence
finishing. Genome Res. 8, 195–202.
Guindon, S., Gascuel, O., 2003. A simple, fast, and accurate algorithm to estimate
large phylogenies by maximum likelihood. Syst. Biol. 52, 696–704.
Haffer, J., 1969. Speciation in Amazonian forest birds. Science 165, 131–137.
Haffer, J., 1993. Time’s cycle and time’s arrow in the history of Amazonia.
Biogeographica 69, 15–45.
Ho, S.Y.W., 2007. Calibrating molecular estimates of substitution rates and
divergence times in birds. J. Avian Biol. 38, 409–414.
Johnson, N.K., Cicero, C., 2004. New mitochondrial DNA data affirm the importance
of Pleistocene speciation in North American birds. Evolution 58, 1122–1130.
King, T.L., Eackles, M.S., Henderson, A.P., Bocetti, C.I., Currie, D., Wunderle, J.M.,
2005. Microsatellite DNA markers for delineating population structure and
kinship among the endangered Kirtland’s warbler (Dendroica kirtlandii). Mol.
Ecol. Notes 5, 569–571.
Lovette, I.J., 2004. Molecular phylogeny and plumage signal evolution in a trans
Andean and circum Amazoman avian species complex. Mol. Phylogenet. Evol.
32, 512–523.
Lovette, I.J., Bermingham, E., 1999. Explosive speciation in the New World
Dendroica warblers. Proc. R. Soc. Lond. B. Biol. 266, 1629–1636.
Lovette, I.J., Bermingham, E., 2001. Mitochondrial perspective on the phylogenetic
relationships of the Parula wood-warblers. Auk 118, 211–215.
Lovette, I.J., Bermingham, E., 2002. What is a wood-warbler? Molecular
characterization of a monophyletic parulidae. Auk 119, 695–714.
Maldonado-Coelho, M., Marini, M.A., 2004. Mixed-species bird flocks from Brazilian
Atlantic forest: the effects of forest fragmentation and seasonality on their size,
richness and stability. Biol. Conserv. 116, 19–26.
Mayr, E., 1964. Inferences concerning tertiary American bird faunas. Proc. Natl.
Acad. Sci. USA 51, 280–288.
Melo-Junior, T.A., De Vasconcelos, M.F., Fernandes, G.W., Marini, M.A., 2001. Bird
species distribution and conservation in Serra do Cipó. Minas Gerais, Brazil.
Cambridge Journals Online, pp. 189–204.
Milot, E., Gibbs, H.L., Hobson, K.A., 2000. Phylogeography and genetic structure of
northern populations of the yellow warbler (Dendroica petechia). Mol. Ecol. 9,
667–681.
Nickerson, D.A., Tobe, V.O., Taylor, S.L., 1997. PolyPhred: automating the detection
and genotyping of single nucleotide substitutions using fluorescence-based
resequencing. Nucleic Acids Res. 25, 2745–2751.
Pérez-Emán, J.L., 2005. Molecular phylogenetics and biogeography of the
Neotropical redstarts (Myioborus; Aves, Parulinae). Mol. Phylogenet. Evol. 37,
511–528.
Pinto, O.M.O., 1944. Catálogo das aves do Brasil; 2ª parte. Ordem Passeriformes.
Depto. de Zoologia da Secretaria da Agricultura, Indústria e Comércio, São Paulo.
Posada, D., Buckley, T.R., 2004. Model selection and model averaging in
phylogenetics: advantages of akaike information criterion and Bayesian
approaches over likelihood ratio tests. Syst. Biol. 53, 793–808.
Posada, D., Crandall, K.A., 1998. MODELTEST: testing the model of DNA substitution.
Bioinformatics 14, 817–818.
Quijada-Mascareñas, J.A., Ferguson, J.E., Pook, C.E., Salomão, M.D.G., Thorpe, R.S.,
Wuster, W., 2002. Phylogeographic patterns of trans-Amazonian vicariants and
Amazonian biogeography: the Neotropical rattlesnake (Crotalus durissus
complex) as an example. J. Biogeogr. 34, 1296–1312.
Quijada-Mascareñas, J.A., Ferguson, J.E., Pook, C.E., Salomão, M.G., Thorpe, R.S.,
Wüster, W., 2007. Phylogeographic patterns of trans-Amazonian vicariants and
Amazonian biogeography: the Neotropical rattlesnake (Crotalus durissus
complex) as an example. J. Biogeogr. 34, 1296–1312.
Rambaut, A., Drummond, A.J., 2007. Tracer version 1.4. Available from: <http://
BEAST.bio.ed.ac.uk/Tracer>.
Remsen, J.V., Rocha, O.O., Schmitt, C.G., Schmitt, D.C., 1991. Zoogeography and
geographic variation of Phatyrinchus mystaceus in Bolivia and Peru, and the
circum-Amazonian distribution pattern. Ornitol. Neotrop. 2, 77–83.
Restall, R., Rodriguez, G.A., Lentino, M., 2005. On plumage differences in four
subspecies of Golden-crowned Warbler Basileuterus culicivorus in Venezuela.
Cotinga 23, 33–36.
Ridgely, R.S., Tudor, G., 1989. The Birds of South America, vol. 1. University of Texas
Press, Austin, TX.
Robbins, M.B., Faucett, R.C., Rice, N.H., 1999. Avifauna of a Paraguayan Cerrado
locality: Parque Nacional Serrania San Luis, depto. Concepcion. Wilson Bull. 111,
216–228.
Ronquist, F., Huelsenbeck, J.P., 2003. MrBayes 3: Bayesian phylogenetic inference
under mixed models. Bioinformatics 19, 1572–1574.
Rozas, J., Sanchez-DelBarrio, J.C., Messeguer, X., Rozas, R., 2003. DnaSP, DNA
polymorphism analyses by the coalescent and other methods. Bioinformatics
19, 2496–2497.
Sambrook, J., Russel, D.W., 2001. Molecular Cloning: A Laboratory Manual. Cold
Spring Harbor Laboratory Press, New York.
Schuelke, M., 2000. An economic method for the fluorescent labeling of PCR
fragments. Nat. Biotechnol. 18, 233–234.
Sick, H., 2001. Ornitologia Brasileira. Editora Nova Fronteira, Rio de Janeiro.
Silva, W.R., 1992. Padrões ecológicos, bioacústicos, biogeográficos e filogenéticos do
complexo Basileuterus culicivorus (Aves, Parulidae) e demais espécies brasileiras
do gênero. Departamento de Ecologia. Universidade de Campinas, Campinas. p.
132.
Sorenson, M.D., Ast, J.C., Dimcheff, D.E., Yuri, T., Mindell, D.P., 1999. Primers for a
PCR-based approach to mitochondrial genome sequencing in birds and other
vertebrates. Mol. Phylogenet. Evol. 12, 105–114.
Sorenson, M.D., Quinn, T.W., 1998. Numts: a challenge for avian systematics and
population biology. Auk 115, 214–221.
Stenzler, L.M., Fraser, R., Lovette, I.J., 2004. Isolation and characterization of 12
microsatellite loci from Golden-winged Warblers (Vermivora chrysoptera)
with broad cross-taxon utility in emberizine songbirds. Mol. Ecol. Notes 4,
602–604.
Stephens, M., Donnelly, P., 2003. A comparison of Bayesian methods for haplotype
reconstruction from population genotype data. Am. J. Hum. Genet. 73, 1162–
1169.
Stephens, M., Smith, N.J., Donnelly, P., 2001. A new statistical method for haplotype
reconstruction from population data. Am. J. Hum. Genet. 68, 978–989.
Suchard, M.A., Weiss, R.E., Sinsheimer, J.S., 2001. Bayesian selection of continuous –
time Markov chain evolutionary models. Mol. Biol. Evol. 18, 1001–1013.
Swofford, D.L., 1993. Paup – a computer-program for phylogenetic inference using
maximum parsimony. J. Gen. Physiol. 102, A9–A9.
S.T. Vilaça, F.R. Santos / Molecular Phylogenetics and Evolution 57 (2010) 585–597
Tamura, K., Dudley, J., Nei, M., Kumar, S., 2007. MEGA4: molecular evolutionary
genetics analysis (MEGA) software version 4.0. Mol. Biol. Evol. 24, 1596–
1599.
Vallender, R., Robertson, R.J., Friesen, V.L., Lovette, I.J., 2007. Complex hybridization
dynamics between golden-winged and blue-winged warblers (Vermivora
chrysoptera and Vermivora pinus) revealed by AFLP, microsatellite, intron and
mtDNA markers. Mol. Ecol. 16, 2017–2029.
Van Oosterhout, C., Hutchinson, W.F., Wills, D.P.M., Shipley, P., 2004. MICROCHECKER: software for identifying and correcting genotyping errors in
microsatellite data. Mol. Ecol. Notes 4, 535–538.
Van Oosterhout, C., Weetman, D., Hutchinson, W.F., 2006. Estimation and
adjustment of microsatellite null alleles in nonequilibrium populations. Mol.
Ecol. Notes 6, 255–256.
597
Weir, J.T., Bermingham, E., Schluter, D., 2009. The great American biotic interchange
in birds. Proc. Natl. Acad. Sci. USA 106, 21737–21742.
Weir, J.T., Schluter, D., 2008. Calibrating the avian molecular clock. Mol. Ecol. 17,
2321–2328.
Winker, K., Glenn, T.C., Graves, G.R., 1999. Dinucleotide microsatellite loci in a
migratory wood warbler (Parulidae : Limnothlypis swainsonii) and amplification
among other songbirds. Mol. Ecol. 8, 1553–1556.
Wüster, W., Ferguson, J.E., Quijada-Mascareñas, J.A., Pook, C.E., Salomão, M.G.,
Thorpe, R.S., 2005. Tracing an invasion: landbridges, refugia and the
phylogeography of the Neotropical rattlesnake (Serpentes: Viperidae: Crotalus
durissus). Mol. Ecol. 14, 1095–1108.
Xia, X., Xie, Z., 2001. DAMBE: software package for data analysis in molecular
biology and evolution. J. Hered. 92, 371–373.
Baixar