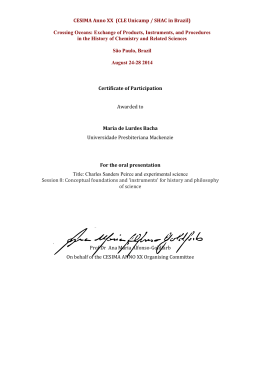
Cobas et al. Diabetology & Metabolic Syndrome 2013, 5:83
http://www.dmsjournal.com/content/5/1/83
RESEARCH
DIABETOLOGY &
METABOLIC SYNDROME
Open Access
Heterogeneity in the costs of type 1 diabetes in a
developing country: what are the determining
factors?
Roberta Arnoldi Cobas1*, Marcos Bosi Ferraz2, Alessandra Saldanha de Mattos Matheus1,
Lucianne Righeti Monteiro Tannus1, Aline Tiemi Kano Silva1, Luiz Antonio de Araujo4, Carlos Antonio Negrato3,
Sérgio Atala Dib2, Marilia Brito Gomes1, On behalf of the Brazilian Type 1 Diabetes Study Group (BrazDiab1SG)
Abstract
Background and aims: Regional differences in the clinical care of Type 1 diabetes (T1D) in Brazil have been
recently described. This study aimed to estimate the costs of T1D from the public health care system’s perspective
across the regions of Brazil and to determine the components that influence these costs.
Methods: This was a retrospective, cross-sectional and nationwide multicenter study conducted between
December 2008 and December 2010 in 28 public clinics in 20 Brazilian cities. The study included 3,180 T1D subjects
receiving healthcare from the National Brazilian Healthcare System (NBHCS) with a follow-up of at least one year.
The direct medical costs were derived from the costs of medications, supplies, examinations, visits to the center,
medical procedures and hospitalizations that occurred during the previous year. Clinical and demographic factors
that determined the differences in the cost across four geographic regions (southeast, south, north/northeast and
mid-west) were investigated.
Results: The per capita mean annual direct medical costs of T1D in US$ were 1,466.36, 1,252.83, 1,148.09 and
1,396.30 in southeast, south, north/northeast and mid-west regions, respectively. The costs of T1D in the southeast
region were higher compared to south (p < 0.001) and north/northeast regions (p = < 0.001), but not to the
mid-west (p = 0.146) region. The frequency of self-monitoring of blood glucose (SMBG) was different across the
regions as well as the daily number of SMBG, use of insulin pumps or basal or prandial insulin analogs. Age,
ethnicity, duration of diabetes, level of care, socioeconomic status and the prevalence of chronic diabetic
complications differed among the regions. In a regression model the determinants of the costs were the presence
of microvascular diabetes-related complications (p < 0.001), higher economic status (p < 0.001), and being from the
southeast region (p < 0.001).
Conclusions: The present data reinforce the regional differences in the costs of T1D and in the socioeconomic
profile and health care provided to the patients with T1D in specialized public centers in Brazil. Both factors
influenced directly the costs of T1D and should be considered for discussing future health policies.
Keywords: Type 1 diabetes, Direct costs of type 1 diabetes, Chronic complications
* Correspondence: [email protected]
1
Disciplina de Diabetes, State University Hospital of Rio de Janeiro (UERJ),
Rio de Janeiro, Brazil- Avenida 28 de setembro, 77, Terceiro andar, Vila Isabel
20551-030, Brazil
Full list of author information is available at the end of the article
© 2013 Cobas et al.; licensee BioMed Central Ltd. This is an open access article distributed under the terms of the Creative
Commons Attribution License (http://creativecommons.org/licenses/by/2.0), which permits unrestricted use, distribution, and
reproduction in any medium, provided the original work is properly cited.
Cobas et al. Diabetology & Metabolic Syndrome 2013, 5:83
http://www.dmsjournal.com/content/5/1/83
Background
Type 1 diabetes (T1D) is a chronic disease that carries a
large risk of chronic disabling complications that have a
negative impact in the costs of the disease and in the
patient’s quality of life. Moreover, the incidence of T1D
is increasing in many countries, including Brazil [1,2].
Despite the well known benefits of an intensive glucose
control in reducing or postponing the risks of diabetesrelated complications and the costs of the disease, the glycemic control in the majority of patients with T1D in
Brazil does not meet the guidelines recommendations [3].
Brazil is a large country with about 191 · 8 million inhabitants, according to the last population census conducted by the Brazilian Institute of Geography and
Statistics (IBGE) [4]. It is divided into five major geographic regions (north, northeast, mid-west, southeast,
and south) and the proportion of people living in urban
areas is of 84% [4]. The regional population densities
present wide disparities. The north region comprises
45 · 2% of the total area of the country and has only 8 ·
1% of the total population. In contrast, the southeast region accounts for 42% of the total population density
and comprises only 10 · 9% of the total area of the country [4]. In addition to demographic differences, cultural,
and socioeconomic aspects also differ among regions.
Actually, the functional illiteracy rate in people older
than 14 years was 23 · 1% in the north, 30 · 8% in the
northeast, 15 · 2% in the southeast, 15 · 5% in the south,
and 18 · 5% in the mid-west in 2010 [5].
The direct costs of T1D has been recently estimated in
Brazil [6]. Previous data from our group have shown important regional differences in the clinical care of T1D
patients in Brazil regarding the achievement of therapeutic goals, frequency of screening for chronic diabetesrelated complications, insulin regimens, and frequency of
self-monitoring of blood glucose (SMBG) [7]. The results
found in this study are alarming and suggest that governmental health policy should be directed to each geographic region, in order to meet their specific demands
and improve the quality of care in the public health care
system overall.
The aim of our study was to estimate the costs of T1D
from the public health care system’s perspective across
the different regions of Brazil and to determine the
regional differences of the components that influence
these costs. We believe these data may provide important clues for reassessment of regional health policies in
Brazil.
Page 2 of 7
in 20 Brazilian cities in public clinics with secondary and
tertiary care levels (Figure 1). The public healthcare system in Brazil is divided in primary, secondary and tertiary care levels according to the characteristics and
infrastructure of the healthcare units. As patients with
T1D usually are treated at secondary or tertiary centers
in our country, primary care centers were not included
in the study. Also, patients attending the private or supplementary health care system (about 24% of the total
Brazilian population) were not included. The detailed
methodology has been described elsewhere [3]. Written
informed consent for the study was obtained from all of
the patients aged 18 years or older or from the parents
or guardians of the patients younger than 18 years. The
study was approved by each local center’s ethics committee. Only the patients with at least 12 months of
follow-up at the respective center were included. This
inclusion criterion allowed us to quantify the variables
required to determine the costs over the prior year to
the study through an interview.
Economic status was defined according to the Brazilian
Economic Classification Criteria (ABEP) [8], which estimates the purchasing power of urban individuals and
families, thus classifying the population in terms of economic strata. These criteria provide scores according to
the ownership of items and education level. Economic status were classified as high, middle, low or very low [8].
Assessment of clinical and demographic variables
Information on the diabetic treatment modalities, source
of insulin pumps, medications and supplies for SMBG,
frequency of SMBG, routine diabetes care and other data
not available from medical records (eg. admissions in
Research design and methods
Study design
This is a retrospective, cross-sectional and nationwide
multicenter cost-of-illness study conducted between December 2008 and December 2010 in 28 centers located
Figure 1 Distribution of the participating centers across
the country.
Cobas et al. Diabetology & Metabolic Syndrome 2013, 5:83
http://www.dmsjournal.com/content/5/1/83
other hospitals) were obtained through an interview with
information provided directly by the patient or his caregiver. The following information was obtained from
medical records assessed during the interview: the total number of HbA1c measurements performed in the
prior year, fructosamine levels, fasting, and 2-h postprandial glycemia, total cholesterol, LDL-cholesterol,
HDL-cholesterol, triglycerides, uric acid, plasma creatinine, plasma urea, sodium, potassium, liver enzymes
(aspartate [AST] and alanine [ALT] aminotransferase),
C-reactive protein (CRP), thyroid stimulating hormone
(TSH), proteinuria, and albuminuria. The number of tests
performed to screen for diabetes-related complications,
such as electrocardiograms (ECGs), exercise stress tests,
stress echocardiographs, calcium score tomographies,
coronary artery angiographs, and fundoscopies, were
analyzed. The frequencies of medical procedures, such
as vitrectomy, laser therapy, hemodialysis, and hospitalizations due to diabetes decompensation or ketoacidosis were also evaluated.
Costs evaluation and distribution of healthcare resources
The direct medical costs were calculated using the costs
of medications (oral drugs and insulin), SMBG supplies,
blood analysis and other examinations, consultations
with physicians, nurses and dietitians, medical procedures, and hospitalizations that occurred during the
prior year. The drugs included in the analysis were those
specific to treating T1D or its related comorbidities
(dyslipidemia, arterial hypertension, obesity), and complications (retinopathy, nephropathy, and neuropathy).
The medication costs were obtained from the Brazilian
Ministry of Health website [9] when the drug was provided by public institutions or by the average price at
three nationwide pharmaceutical web sites when privately acquired. When the price varied by region, we calculated the average cost. The costs of examinations and
medical procedures were obtained from the table of procedures using the 2010–2011 NBHCS prices which determine the reimbursements to government-sponsored
healthcare units. The price of insulin pumps and their
supplies was based on the value paid by the Municipal
Health Bureau of Rio de Janeiro (RJ-SMS) in May 2010.
The costs of SMBG supplies, syringes, and needles were
determined by the April 2011 RJ-SMS or by the mean
values for three nationwide pharmaceutical companies
when privately acquired.
All of the costs were converted into US dollars (at 1
US dollar = 1 · 9315 Reais) using the average of the 3
consecutive years (2008–2010).
Data storage and statistical analysis
The statistical analysis was performed using the Statistical Package for the Social Sciences (SPSS) Version 17.0.
Page 3 of 7
Data are presented as mean [95% confidence interval]
for continuous variables and as counts (relative frequencies) for discrete variables.
Comparison of the direct medical costs across the four
regions was performed using non- parametric test Mann–
Whitney for every two regions. The statistically significant
p-values were corrected using the Sidak procedure to control for type I errors (p < 0 · 01). Data on the north and
northeast regions were evaluated together, so four geographic regions were compared (southeast, n = 1,310;
south, n = 727; north/northeast, n = 938, and mid-west,
n = 205). A regression analysis was performed to investigate the role of the geographic regions and other independent variables (age, ethnicity, duration of diabetes,
economic status, level of attention, and the presence of
microvascular or macrovascular diabetes-related complications) in influencing the direct medical costs. In this regression analysis the geographic regions were introduced
in the model as dummies variables.
Results
The clinical and demographic characteristics of the studied populations are presented in Table 1. The per capita
mean [95% IC] direct medical costs of T1D were US$
1,466 · 36 [1,382 · 09-1,550 · 64], US$ 1,252 · 83 [1,168 ·
66-1,337 · 00], US$ 1,148 · 09 [1,048 · 86-1,247 · 32], and
Table 1 Clinical and demographic data of the studied
population
Variable
N
3,180
Female gender, n (%)
1,791 (56 · 3)
Age, y
22 ± 11 · 8; 20 (2–66)
Ethnicity, n (%)
Caucasian
1,824 (57 · 4)
Non-Caucasian*
1,356 (42 · 6)
Socioeconomic status**
High
222 (7 · 2)
Medium
710 (22 · 3)
Low
1,052 (33 · 1)
Very low
1,102 (34 · 7)
Level of care, n (%)
Secondary
897 (28 · 2)
Tertiary
2,283 (71 · 8)
Duration of diabetes, y
10 · 3 ± 8 · 03, 8 (1–50)
HbA1c%, mmol/mol
9 · 34 ± 2 · 34, 78.6 ± 25
†
Presence of microvascular complications
635 (27 · 4)
Presence of macrovascular complications†
119 (5 · 1)
y = year. The data are presented as number (percentage), mean ± SD and/or
median (Min-Max). *Afro-Brazilians, Mulattos, Asians, Native Indians **Missing
data from 87 participants.
†
Excludes the patients without criteria for the diabetic complications screening.
Cobas et al. Diabetology & Metabolic Syndrome 2013, 5:83
http://www.dmsjournal.com/content/5/1/83
Page 4 of 7
Table 2 Total annual costs (US$) of the studied population across the different geographic regions in Brazil
Southeast (n = 1310)
South (n = 727)
North/Northeast (n = 938)
Mid-West (n = 205)
1,920,936 · 74
910,808 · 38
1,076,906 · 08
286,241 · 19
1,466 · 36
1,252 · 83
1,148 · 09
1,396 · 30
[1,382 · 09–1,550 · 64]
[1,168 · 66–1,337 · 00]
[1,048 · 86–1,247 · 32]
[1,268 · 30–1,370 · 00]
1,052 · 10
885 · 54
654 · 86
986 · 42
(778 · 65–1,710 · 46)
(698 · 01–1,513 · 22)
(429 · 77–1,164 · 17)
(631 · 81–1,871 · 78)
Direct medical cost (US$)
Total
Per capita
Data presented as mean [95% CI] and median (interquartile range). Southeast vs south (p < 0 · 001); southeast vs north/northeast (p < 0 · 001); southeast vs
midwest (p = 0 · 146); midwest vs north/northeast (p = <0 · 001); south vs northeast (p < 0 · 001); south vs midwest (p = 0 · 292).
US$ 1,396 · 30 [1,268 · 30-1,370 · 00] in southeast, south,
north/northeast, and midwest regions, respectively. The
costs of T1D in the southeast region were higher compared to the south (p < 0 · 001), and north/northeast
regions (p < 0 · 001), but not to the mid-west region
(p = 0 · 146). Midwest costs were statistically different
from north/northeast (p < 0 · 001) but not from south
regions (p = 0 · 292). South costs were higher than north/
northeast (p < 0 · 001) (Table 2).
The components of the clinical care of diabetes that
most impacted the direct medical costs were compared
among the regions aiming to find explanations for the
regional differences of these costs (Table 3). As previously shown, the frequency of SMBG is different across
the regions (p < 0 · 001) as well as the daily number of
SMBG (p < 0 · 001), use of insulin pumps (p = 0 · 009) or
basal or prandial insulin analogs (p < 0 · 001).
The clinical and demographic variables that could have
influenced the costs were compared among the regions
and the results are shown in Table 4. Age (p = 0 · 017), ethnicity (p < 0 · 001), duration of diabetes (p < 0 · 001), level
of care (p < 0 · 001), socioeconomic status (p < 0 · 001) and
the prevalence of chronic diabetes-related microvascular
(p < 0 · 001) and macrovascular (p = 0 · 004) complications
differed among the regions but not gender.
In the regression model using the direct medical costs
as the dependent variable and geographic region, age,
ethnicity, duration of diabetes, level of attention, socioeconomic status and the presence of chronic microvascular or macrovascular diabetes-related complications as the
independent variables we observed that the independent
determinants of the costs were the presence of microvascular diabetes-related complications (B −603 · 00, SE
64 · 36; β -0 · 165; p < 0 · 001), economic status (B −202 ·
57, SE 27 · 72; β -0 · 129; p < 0 · 001), and being from
the southeast region (B 197 · 95, SE 52 · 77; β 0 · 066;
p < 0 · 001). This model explained only 5 · 4% of the variability of the costs (R2 = 0 · 054).
Discussion
Brazil is a large country with a great cultural, socioeconomic and demographic diversity. As previously demonstrated [7], these diversities are also extrapolated to the
type of treatment and clinical care of T1D patients in
our country. From the present data we can see that
the direct medical costs of T1D also follow this same
pattern.
The first interesting issue raised by the present study
is the existence of two extremes in Brazil regarding
the characteristics, the care of patients with T1D and
the costs of the disease: the southeast and the north/
northeast regions. In the southeast region, the average
per capita costs of T1D was 28% and 17% higher than in
the north/northeast and in the south regions, respectively,
although not different from mid-west. In fact, being from
the Southeast region was independently associated with
higher medical costs. This finding could be explained by
the different pattern of treatment offered to patients living
and receiving treatment in each region which is reflected
in the costs. For example, a smaller proportion of patients
in the north/northeast region performed SMBG and when
performed, it was in a lower daily frequency. Moreover,
Table 3 Differences in the resources utilization among the geographic regions of Brazil
Southeast
South
North/Northeast
Mid-West
p-value
93 · 9
92 · 7
77 · 2
95 · 1
<0 · 001
Daily frequency of SMBG*
3 · 88 [3 · 78–3 · 98] 4
(3–5)
3 · 02 [2 · 91–3 · 13] 3
(2–4)
2 · 93 [2 · 76–3 · 10] 2
(2–3)
3 · 19 [3 · 00–3 · 37] 3
(2–4)
<0 · 001
Use of insulin pump, n (%)
23 (1 · 8)
10 (1 · 4)
2 (0 · 2)
3 (1 · 5)
0 · 009
Use of ultra-rapid insulin analogs, n (%)
627 (52 · 5)
364 (52 · 4)
122 (16 · 8)
98 (52 · 7)
<0 · 001
Use of basal insulin analogs n (%)
281 (21 · 5)
156 (21 · 5)
108 (11 · 5)
73 (35 · 6)
<0 · 001
SMBG (yes), (%)
SMBG = self- monitoring of blood glucose. *Data presented as mean [95%CI] and median (interquartile interval).
Cobas et al. Diabetology & Metabolic Syndrome 2013, 5:83
http://www.dmsjournal.com/content/5/1/83
Page 5 of 7
Table 4 Clinical and demographic differences among the geographic regions of Brazil
Southeast
South
North/Northeast
Midwest
P value
Gender (female), (%)
58 · 5
56 · 3
53 · 1
57 · 6
0 · 087
Ethnicity (Caucasian), (%)
58 · 7
87 · 3
34 · 6
46 · 3
<0 · 001
Age (y)*
22 · 0 ± 12 · 5
23 · 4 ± 12 · 3
20 · 9 ± 9 · 9
21 · 8 ± 11 · 9
0 · 017
Duration of diabetes (y)**
11 · 2 ± 8 · 8
11 · 4 ± 8 · 3
8·5±6·4
9·4±7·5
<0 · 001
Level of care*** (tertiary), (%)
93 · 1
94 · 2
34 · 9
24 · 9
<0 · 001
Low or very-low economic status (%)****
66 · 1
58 · 1
86 · 1
58 · 2
<0 · 001
Prevalence of microvascular complications (%)
22 · 0
23 · 8
14 · 5
18 · 5
0 · 001
Presence of macrovascular complications (%)
5·1
3·2
2·5
2·9
0 · 004
SE = Southeast; N/NE = North/Northeast; MW = Midwest.
*p = 0 · 006 (SE vs South), p = 0 · 003 (South vs N/NE).
**p <0 · 001 (SE vs N/NE), p = 0 · 006 (SE vs MW), p <0 · 001 (South vs N/NE), p = 0 · 001 (South vs MW).
***p <0 · 001 (SE vs N/NE), p <0 · 001 (SE vs MW), p <0 · 001 (South vs N/NE), p <0 · 001 (South vs MW), p = 0 · 007 (N/NE vs MW).
****p <0 · 001 (N/NE vs MW), p = 0 · 042 (SE vs MW),p <0 · 001 (SE vs N/NE), p <0 · 001 (SE vs South), p = 0 · 02 (South vs MW), p <0 · 001 (N/NE vs South).
the great majority of patients were using the lower cost
human regular or NPH insulins. However, we also observed that most patients in north/northeast belong to
low or very low socioeconomic status and are seen mostly
in secondary centers.
Another determinant of the costs of T1D in our study
was the socioeconomic status. What must be investigated is 'how far it, which also reflects the educational
level in the ABEP classification, interferes with the
costs’? Intuitively, we can consider that both the patient
and the healthcare team can act to determine this difference. In the daily clinical practice physicians know that
the complexity of the treatment offered to the patients
should correspond to their acceptance and ability to
follow the recommendations adequately. Otherwise, it
would result in poor compliance and any proposed treatment strategy would be inefficient. This means that we
are increasingly individualizing treatment in diabetes
and this has already reflected in the most recent guidelines recommendations for type 2 diabetes (T2D) treatment [10]. These recommendations consider the patients’
motivation, adherence, and self-care capacities as well as
the resources and support system, as important factors in
choosing the best treatment for a particular patient. On
the other hand, patients with a higher education or even
cognitive level could act more positively in finding the best
available treatment options for him, many of which, are
more expensive. This is particularly important in many
cities in Brazil where the public health care system do not
provide insulin analogs and the supplies for SMBG in a
regular basis.
Other determinant of higher costs in T1D is the presence of chronic diabetes-related microvascular complications. In epidemiological studies, it is important to
consider that the prevalence of chronic complications is
proportional to the frequency of screening and the survival to acute complications of the disease. Patients from
north/northeast presented lower prevalence of complications, which could reflect a survival bias. Intervention
studies, such as the Diabetes Control and Complications
Trial (DCCT), have shown that intensive treatment during the early stages of T1D reduces the risk of future
microvascular complications [11]. Information derived
from clinical and economic trials can guide economic
policy decisions that aim to reduce direct costs by reallocating resources toward preventing acute and chronic
diabetes-related complications. Increased costs due to
the presence of chronic diabetes-related complications
may have a future impact on health economics because
chronic complications become more prevalent as the
disease progresses.
The impact of T1D alone on the total investment in
the public health care system by the three spheres of
government, Federal, State and Municipal is unknown.
According to data from the National Health Ministry of
Brazil we have observed an increase in global health
Table 5 Per capita expenditure on public health services and actions for each geographic region according to the
National Health Ministry of Brazil
Per capita expenditure
(US$/% Total)
2008
2009
2010
3-year mean
Individual cost of T1D/
Per capita expenditure
North/Northeast
237 · 20 (21 · 8%)
256 · 89 (22 · 0%)
282 · 23 (21 · 7%)
258 · 77 (21 · 8%)
4 · 44
Southeast
306 · 17 (28 · 2%)
331 · 73 (28 · 5%)
373 · 87 (28 · 7%)
337 · 26 (28 · 5%)
4 · 35
South
257 · 89 (23 · 7%)
279 · 12 (23 · 9%)
321 · 06 (24 · 7%)
286 · 02 (24 · 2%)
4 · 38
Midwest
285 · 15 (26 · 3%)
297 · 86 (25 · 6%)
323 · 52 (24 · 9%)
302 · 18 (25 · 5%)
4 · 62
Cobas et al. Diabetology & Metabolic Syndrome 2013, 5:83
http://www.dmsjournal.com/content/5/1/83
expenditure from years 2008 to 2010 in all regions of
the country, which is determined by law. The per capita
expenditure is higher in the southeast and lowest in the
north/northeast regions (Table 5), consistent with the
trend of the per capita costs of T1D. However, patients
with T1D cost about 4 times the per capita expenditure
on public health services and actions by the Ministry of
Health in all regions. The fixed offer and the variable demand could explain these similar relations despite the
differences in regional costs. Thus, it is likely that the
health investment cap would be a limiting factor in
the per capita costs of T1D.
Although the study design does not allow a complete
evaluation of the clinical and economic consequences of
the treatment of T1D in Brazil, we suspect that other
factors besides the economic status may interfere in clinical outcomes and in meeting the recommended therapeutic goals. For instance, the southeast and mid-west
regions, despite having a 22% and 28% higher T1D per
capita costs, respectively, a greater frequency of SMBG
and proportion of insulin analogues use than the north/
northeast region, presented a similar low prevalence of patients within the recommended HbA1c targets [7].
Some study limitations must be addressed. The study
sample included only patients attended at public centers
on secondary or tertiary levels in urban areas. However,
according to the structure of care established by the
NBHCS, the vast majority of patients with T1D are
treated in these centers. Also, the collection of data may
have led to collection bias.
The present data reinforce the regional differences in
the health care provided to patients with T1D in specialized public centers in Brazil, as well as the regional differences in the socioeconomic and demographic profile
of the population. Both factors have directly influenced
the costs of T1D in Brazilian regions and should be considered for discussing future health policies.
Competing interests
Authors declare that they have no conflicts of interests.
Author’s contributions
RAC, ASMM, LRMT researched data and drafted the manuscript. ATKS, LAA,
SAD researched data. MBF contributed to conception and design, reviewed
the manuscript and contributed to discussion. RAC, CAN and MBG reviewed
the manuscript and contributed to the discussion. The writing group takes
final responsibility for the paper and is the study guarantor. All authors read
and approved the final manuscript.
Author’s informations
*Brazilian Type 1 Diabetes Study Group (BrazDiab1SG).
Executive steering committee: Marilia Brito Gomes (chair), Roberta Cobas,
Sergio Atala Dib, Carlos Negrato.
Principal investigators are indicated by an asterisk. Program coordinators
are italic.
Universidade Estado Rio de Janeiro: Roberta Cobas*, Alessandra Matheus,
Lucianne Tannus; Universidade Federal Rio de Janeiro: Melanie Rodacki*,
Lenita Zadenverg; Hospital Geral de Bonsucesso: Neuza Braga Campos de
Araújo*, Marilena de Menezes Cordeiro; Hospital Universitário Clementino
Page 6 of 7
Fraga Filho – IPPMG: Dr. Jorge Luiz Luescher*; Renata Szundy Berardo; Serviço
de Diabetes da Disciplina de Endocrinologia e Metabologia do Hospital das
Clínicas da Universidade de São Paulo: Marcia Nery*; Catarina Cani; Maria do
Carmo Arruda Marques; Unidade de Endocrinologia Pediátrica da Santa Casa
de Misericórdia de São Paulo: Luiz Eduardo Calliari*, Renata Maria de
Noronha; Instituto da Criança do Hospital das Clínicas da Universidade de
São Paulo: Thais Della Manna*, Roberta Salvodelli, Fernanda Garcia Penha;
Hospital das Clínicas da Faculdade de Medicina de Ribeirão Preto – USP:
Milton Cesar Foss*, Maria Cristina Foss-Freitas; Ambulatório da Faculdade
Estadual de Medicina de São José do Rio Preto: Antonio Carlos Pires*,
Fernando Cesar Robles; Associação de Diabéticos de Bauru: Carlos Antonio
Negrato*, Maria de Fatima Guedes; Centro de Diabetes da Escola Paulista de
Medicina: Sergio Atala Dib*, Patricia Dualib; Clínica de Endocrinologia da
Santa Casa de Belo Horizonte Setor Diabetes Tipo 1: Saulo Cavalcanti da
Silva*, Janice Sepulveda; Ambulatório Multiprofissional de Atendimento à
Diabetes do Hospital de Clínicas da Universidade Estadual de Londrina:
Henriqueta Guidio de Almeida*, Emerson Sampaio; Hospital de Clínicas da
Universidade Federal do Paraná:Rosangela Roginski Rea*, Ana Cristina
Ravazzani de Almeida Faria; Instituto da Criança com Diabete Rio Grande Sul:
Balduino Tschiedel*, Suzana Lavigne, Gustavo Adolfo Cardozo; Hospital de
Clínicas de Porto Alegre:Mirela Azevedo*, Luis Henrique Canani, Alessandra
Teixeira Zucatti; Hospital Universitário de Santa Catarina: Marisa Helena Cesar
Coral*, Daniela Aline Pereira; Instituto de Diabetes-Endocrinologia de Joinville:
Luiz Antonio de Araujo*; Hospital Regional de Taguatinga, Brasília:
Hermelinda Cordeiro Pedrosa*, Monica Tolentino; Flaviene Alves Prado;
Hospital Geral de Goiânia: Dr Alberto Rassi: Nelson Rassi*, Leticia Bretones de
Araujo; Centro de Diabetes e Endocrinologia do Estado da Bahia: Reine
Marie Chaves Fonseca*; Alexis Dourado Guedes, Odelisa Silva de Mattos;
Universidade Federal do Maranhão: Manuel Faria*, Rossana Azulay; Centro
Integrado de Diabetes e Hipertensão do Ceará: Adriana Costa e Forti*, Maria
Cristina Façanha; Universidade Federal do Ceará: Renan Montenegro Junior*,
Ana Paula Montenegro; Universidade Federal de Sergipe: Naira Horta Melo*,
Karla Freire Rezende; Hospital Universitário Alcides Carneiro: Alberto Ramos*;
Hospital Universitário João de Barros Barreto, Pará: João Felício Soares*, Flavia
Marques Santos; Hospital Universitário Getúlio Vargas, Hospital Adriano Jorge:
Deborah Laredo Jezini*.
Acknowledgements
We thank Elisangela Santos for her technical assistance.
Funding
This work was supported by grants from Farmanguinhos/Fundação Oswaldo
Cruz/National Health Ministry, Brazilian Diabetes Society, Fundação do
Amparo à Pesquisa do Estado do Rio de Janeiro, and Conselho Nacional de
Desenvolvimento Científico e Tecnológico do Brasil. Authors declare that the
funding sources had no involvement in study design, in the collection,
analysis, and interpretation of data, in the writing of the report, and in the
decision to submit the paper for publication.
Author details
1
Disciplina de Diabetes, State University Hospital of Rio de Janeiro (UERJ),
Rio de Janeiro, Brazil- Avenida 28 de setembro, 77, Terceiro andar, Vila Isabel
20551-030, Brazil. 2Federal University of São Paulo (UNIFESP), São Paulo,
Brazil- Rua Botucatu, 685, Vila Mariana, Brazil. 3Bauru’s Diabetics Association,
Brazil- Avenida Nações Unidas, 28-40, Bauru 17011-105, Brazil. 4Joinville
Endocrinology and Diabetes Institute, Santa Catarina, Brazil- Rua Alexandre
Dohler 129, Joinville 89201-260, Brazil.
Received: 9 August 2013 Accepted: 20 December 2013
Published: 27 December 2013
References
1. Sr F, Franco LJ, Vivolo MA, Negrato CA, Simoes AC, Ventureli CR:
Population-based incidence of IDDM in the State of São Paulo, Brazil.
Diabetes Care 1993, 16:701–04.
2. Negrato CA, Dias JP, Teixeira MF, Dias A, Salgado MH, Lauris JR, Montenegro
RM Jr, Gomes MB, Jovanovic L: Temporal trends in incidence of type 1
diabetes between 1986 and 2006 in brazil. J Endocrinol Invest 2010,
33:373–77.
3. Gomes MB, Coral M, Cobas RA, Dib SA, Canani LH, Nery M, De Freitas MC,
Faria M, Felício JS, Da Silva SC, Pedrosa H, Costae Forti A, Rea RR, Pires AC,
Cobas et al. Diabetology & Metabolic Syndrome 2013, 5:83
http://www.dmsjournal.com/content/5/1/83
Page 7 of 7
Montenegro Junior R, Oliveira JE, Rassi N, Negrato CA: Prevalence of adults
with type 1 diabetes who meet the goals of care in daily clinical
practice: a nationwide multicenter study in brazil. Diabetes Res Clin Pract
2012, 97:63–70.
4. Instituto Brasileiro de Geografia e Estatística: Censo demográfico 2010; 2010.
Available from: http://www.ibge.gov.br/home/estatistica/populacao/
censo2010/caracteristicas_da_populacao/tabelas_pdf/tab1.pdf. Accessed 15
March 2012.
5. Instituto Brasileiro de Geografia e Estatística (2010): Uma análise das
condições de vida da população brasileira 2010. [http://www.ibge.gov.br/
home/estatistica/populacao/condicaodevida/indicadoresminimos/
sinteseindicsociais2010/default.shtm]
6. Cobas RA, Ferraz MB, Matheus ASM, Tannus LRM, Negrato CA, Araujo LA,
Dib SA, Gomes MB: The cost of type 1 diabetes: a nationwide multicentre
study in Brazil. Bull World Health Organ 2013, 91:434–40.
7. Gomes MB, Cobas RA, Matheus ASM, Tannus LRM, Negrato CA, Rodacki M,
Braga N, Cordeiro MM, Luescher JL, Berardo RS, Nery M, Arruda-Marques
MC, Calliari LE, Noronha RM, Manna TD, Zajdenverg L, Salvodelli R, Penha FG,
Foss MC, Foss-Freitas MC, Pires AC, Robles FC, Guedes M, Dib SA, Dualib P,
Silva SC, Sepulvida J, Almeida HG, Sampaio E, Rea R, et al: Regional differences
in clinical care among patients with type 1 diabetes in Brazil: Brazilian type
1 diabetes study group. Diabetol Metab Syndr 2012, 4:44. doi:10.1186/
1758-5996-4-44.
8. ABEP: Brazilian Economic classification criteria. 2012 [http://www.abep.
org/novo/Content.aspx?SectionID=84]
9. Portal da saúde (SUS): Banco de preços em saúde. 2011. [http://portal2.
saude.gov.br/BPS/visao/consultapublica/publico_interno_item.cfm]
10. Inzucchi SE, Bergenstal RM, Buse JB, Diamant M, Ferrannini E, Nauck M,
Peters AL, Tsapas A, Wender R, Matthews DR: Management of hyperglycemia
in type 2 diabetes: a patient-centered approach. Position statement of the
American diabetes association (ADA) and the European association for the
study of diabetes (EASD). Diabetes Care 2012, 35:1364–1379.
11. DCCT: The diabetes control and complications trial. N Engl J Med 1993,
329:977–86.
doi:10.1186/1758-5996-5-83
Cite this article as: Cobas et al.: Heterogeneity in the costs of type 1
diabetes in a developing country: what are the determining factors?
Diabetology & Metabolic Syndrome 2013 5:83.
Submit your next manuscript to BioMed Central
and take full advantage of:
• Convenient online submission
• Thorough peer review
• No space constraints or color figure charges
• Immediate publication on acceptance
• Inclusion in PubMed, CAS, Scopus and Google Scholar
• Research which is freely available for redistribution
Submit your manuscript at
www.biomedcentral.com/submit
Download
PDF