EUROPEAN
COMMISSION
Brussels, 26.2.2015
SWD(2015) 41 final
COMMISSION STAFF WORKING DOCUMENT
Country Report Portugal 2015
Including an In-Depth Review on the prevention and correction of macroeconomic
imbalances
{COM(2015) 85 final}
This document is a European Commission staff working document . It does not
constitute the official position of the Commission, nor does it prejudge any such position.
EN
EN
EN
EN
CONTENTS
Executive summary
1
1.
Scene setter: economic situation and outlook
3
2.
Imbalances, risks and adjustment
9
2.1. External sustainability and competitiveness
10
2.2. Debt overhang and deleveraging
18
2.3. Labour market
25
3.
34
Other structural issues
3.1. Taxation, fiscal framework and other fiscal structural policies
35
3.2. Social policies
40
3.3. Education and vocational training policies
42
3.4. Structural measures to improve competitiveness
44
AA. Overview Table
51
AB. Standard Tables
62
LIST OF TABLES
1.1.
Key economic, financial and social indicators for Portugal
7
1.2.
The MIP scoreboard for Portugal
8
2.1.1. ICOR (5-year average growth) in selected euro area countries
10
2.1.2. Structure of the NIIP
11
2.1.3. Structure of goods exports by broad economic category (in %)
16
2.1.4. World market shares for services (in %)
16
2.2.1. Debt-to-equity and return on equity ratios, broken down by sector
18
2.2.2. Importance of SMEs in the Portuguese economy
19
2.2.3. Corporate solvency risk heat map
20
AB.1. Macroeconomic indicators
60
AB.2. Financial market indicators
61
AB.3. Taxation indicators
62
AB.4. Labour market and social indicators
63
AB.5. Expenditure on social protection benefits (% of GDP)
64
AB.6. Product market performance and policy indicators
65
AB.7. Green growth
66
LIST OF GRAPHS
1.1.
Real GDP growth and its components
3
1.2.
Poverty indicators in Portugal
3
1.3.
Contributions to potential growth in 2003-19
5
2.1.1. Breakdown of Portugal's Net International Investment Position (NIIP)
10
2.1.2. Current account financing
10
2.1.3. NIIP sensitivity to macroeconomic shocks
11
2.1.4. External position and its components
12
2.1.5. Net lending/ borrowing by sector
12
2.1.6. Portugal's headline and structural current account balance
12
2.1.7. Breakdown of Portugal's current account into cyclical and structural components
12
2.1.8. Imports and exports of goods and services as a proportion of GDP
13
2.1.9. Nominal ULC trends in tradable and non-tradable sectors
13
2.1.10.
Relative prices of tradables and non-tradables in Portugal
14
2.1.11.
Real effective exchange rates in relation to the EA-17
14
2.1.12.
Average growth rate in profit margins (2010-13)
14
2.1.13.
PULCs, quality and prices of Portuguese exports, by comparison with the EU28
average
2.1.14.
Geographical and sectoral breakdown of export market share growth in Portugal
15
15
2.2.1. Household indebtedness as a percentage of GDP
17
2.2.2. Private NFC indebtedness as a percentage of GDP
17
2.2.3. Breakdown by sector, total debt-to-GDP ratios
18
2.2.4. Distribution of corporate solvency risk by sector
20
2.2.5. Macroeconomic risk - growth and interest rates
22
2.2.6. Fiscal consolidation and ageing costs
22
2.3.1. Employment and unemployment
24
2.3.2. Employment and unemployment rates and long-term unemployment
24
2.3.3. Unemployment rate, actual and predicted based on Okun's law
25
2.3.4. Real compensation per employee and labour productivity
25
2.3.5. Nominal unit labour costs
26
2.3.6. Gap between employment growth in the tradable and in the non-tradable sectors: 2010-13
26
2.3.7. Employment by education level
27
2.3.8. Beveridge curve
27
2.3.9. Temporary employmen tand self-employment
27
2.3.10.
Number of collective agreements and workers covered
29
2.3.11.
Nominal compensation per employee and the minimum wage
29
LIST OF BOXES
1.1.
Economic surveillance process
6
EXECUTIVE SUMMARY
Between May 2011 and June 2014, Portugal
benefited from financial assistance in support of
an economic adjustment programme which also
covered the surveillance of imbalances and
monitoring of corrective measures. Portugal is
still affected by very high private and government
debt, vulnerability of the financial sector due to
weak bank profitability and an ongoing
deterioration of asset quality, limited access of
corporations to credit, high levels of
unemployment and bottlenecks in network
industries, services, regulated professions and
public administration. These weaknesses constitute
risks for economic growth and financial stability,
thus requiring decisive policy actions.
This Country Report assesses Portugal's economy
against the background of the Commission's
Annual Growth Survey, which recommends three
main pillars for the EU's economic and social
policy in 2015: investment, structural reforms, and
fiscal responsibility. In line with the Investment
Plan for Europe, it also explores ways to maximise
the impact of public resources and unlock private
investment. Finally, it assesses Portugal in the light
of the findings of the 2015 Alert Mechanism
Report, in which the Commission found it useful
to further examine the existence of macroeconomic
imbalances or their unwinding. To this end, this
Country Report also provides an in-depth review
(IDR) of Portugal's economy in line with the scope
of the surveillance under the Macroeconomic
Imbalances Procedure.
The main findings from the IDR analysis as
regards imbalances and macroeconomic risks are:
• Portugal tackled thoroughly its external
imbalances but, starting from deep-seated
external weaknesses, the rebalancing is still
ongoing. The traditionally high structural
current account deficit has been closed, exports
increased, helped also by improved efficiency
and product quality, and the tradables sector
gained in importance. However, the net
international investment position is still very
negative and rebalancing through sustained
current account surpluses will not only take
time but requires stronger economic growth,
higher exports, and more attractiveness for
foreign direct investment.
• The high debt of Portuguese firms still
weighs on firms' performance and impedes
new investments, one of the key priorities of
the new Commission, while households'
indebtedness
declined
markedly.
Deteriorating growth prospects and changing
attitudes towards risk have prompted nonfinancial corporations to adjust their balance
sheets, although to a lesser extent than
households.. The high corporate debt ratio
represents also a concern for banks’ balance
sheets and Portugal's wider financial stability.
• General government debt has reached very
high levels, also by bringing off-budget
operations on record. While the increasing
path in gross public debt is expected to reverse
in the short term, government debt dynamics
remain vulnerable to adverse shocks and
impose a high interest burden on public
finances.
• The economic crisis has led to a sharp
decline in employment. Although the labour
market situation has recently improved,
unemployment remains high and the labour
market segmented. However, the economy
experienced a substantial real wage adjustment
in recent years, and Portugal's real effective
exchange rate trends are conducive to falling
unemployment and the necessary further
external rebalancing. Yet there is a risk that
unemployment stabilises at high levels in a low
growth environment.
The Country Report also analyses other
macroeconomic and structural issues, and the main
findings are:
• Portugal is advancing reforms of the fiscal
system. This applies for strengthening the
fiscal framework and implementing new
measures to fight tax fraud and evasion and
reforms of the public administration, including
at the local and regional level. Initiatives to
improve the operating balance of state-owned
enterprises continue and renegotiations of
several Public-Private Partnerships are near
conclusion. The sustainability of state-owned
hospitals is being addressed, but their stock of
arrears is still high.
1
Executive summary
• Portugal is making some progress with
structural reforms. In the energy sector,
excessive rents and the electricity tariff debt are
being addressed. Several infrastructure projects
listed in Portugal's long-term transport plan are
progressing. Reforms of product markets,
services and regulated professions are
advancing, although not in a comprehensive
way. However, the lack of a systematic
approach to monitoring and evaluating reforms
makes it difficult to assess their full impact on
the functioning of the economy.
Overall, Portugal has made some progress in
addressing
the
2014
country-specific
recommendations. Decisive measures have been
taken to stabilise the financial sector and to
overhaul the corporate insolvency and debt
restructuring framework. Active Labour Market
Policies have been strengthened. The assessment
of recent reforms of collective bargaining is mixed,
as not all of them promote the alignment of wages
and productivity at firm level. No progress has
been achieved on strengthening social assistance,
including the minimum income scheme. Education
and training have undergone important reforms
and implementation is now crucial to prove their
effectiveness in improving students' performance.
Network industries are still facing efficiency and
sustainability challenges. Housing, product and
services markets reforms are facing delays,
especially the full implementation of the European
Services Directive. While the competition and
regulatory framework is being improved, no
progress has been made in reducing the late
payment of commercial debts by the
administration. Some progress has been made to
increase transparency in public procurement and
the judiciary.
The country report reveals the policy challenges
stemming from the analysis of macro-economic
imbalances:
• Low competition in product markets and low
responsiveness of wages to productivity at the
firm level impact on the competitiveness of
exports and thus on external imbalances.
• Slow restructuring of highly indebted but
viable companies and slow orderly exit of those
2
firms that have no viable operating models
keep the corporate debt levels high.
• Relying on cyclical effects does not facilitate
compliance with the medium-term budget
framework or help to reduce the high public
debt level in a sustainable manner.
• Labour market policies and the functioning of
the collective bargaining system influence the
risk that unemployment stabilises at its current
high level.
Other challenges are:
• Coverage of social assistance is low.
• Education and training outcomes are not
clearly aligned with the labour market and links
between public research organisations and
business are weak.
• In the transport sector, the new transport
regulatory authority is not operational yet.
Liberalisation measures in ports concessions,
railways and metropolitan public transport are
slow, thus not stimulating investment.
1.
SCENE SETTER: ECONOMIC SITUATION AND OUTLOOK
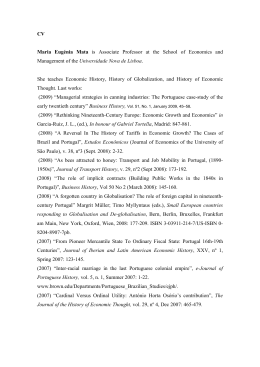
After a prolonged recession, the Portuguese
economy started to recover in 2013. Real GDP
has been growing in year-on-year terms since the
fourth quarter of 2013, following eleven
consecutive quarters of negative growth. Recently,
economic growth has been driven by accelerating
private consumption and investment. The latest
economic sentiment data and confidence indicators
suggest that domestic demand is continuing to
recover, with imports growing faster than exports.
Economic expansion is expected to accelerate
slightly in the medium term as a result of gradually
improving financing conditions and external
demand.
Graph 1.1:
8
Real GDP growth and its components
%, pps
6
employment reduction. Looking ahead, job
creation is set to slow down and employment
growth is expected to become more aligned with
GDP growth.
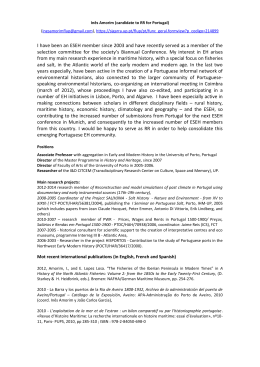
Poverty indicators are traditionally very high in
Portugal compared to the EU average and have
deteriorated further in the wake of the financial
and economic crisis. The number of people
threatened by poverty or social exclusion rose by
220,000 between 2007 and 2013. This represents
an increase to 27.4% of the total Portuguese
population in 2013 (see Graph 1.2). The gap
between Portugal and the rest of the euro area
(23%) has thus widened. Low-work-intensity
households and households with children have
been particularly badly affected by poverty and
social exclusion.
Graph 1.2:
Poverty indicators in Portugal
4
30
2
%
25
0
-2
20
-4
15
-6
10
-8
99 00 01 02 03 04 05 06 07 08 09 10 11 12 13 14 15 16
Inventories investment
Consumption
Real GDP growth
Investment (GFCF)
Net exports
Source: European Commission
5
0
04
05
06
07
08
09
10
11
12
13
AROPE
Inflation is projected to rise moderately in the
medium term. As measured by the Harmonised
Index of Consumer Prices (HICP), it fell to -0.2%
in 2014, mainly as a result of sharp fall in energy
prices. Positive figures are expected by the second
half of 2015 as wages rise and oil prices stabilise.
However, high unemployment levels, subdued
domestic demand and low oil prices are expected
to contain inflationary pressures in the near future.
The labour market situation has been
improving since the spring of 2013. In the first
three quarters of 2014, employment growth
averaged 2% year-on-year, thereby outpacing GDP
growth. However, the decline in unemployment
has recently come to a halt and the unemployment
rate has stabilised since October 2014 with the
AROP
Severe material deprivation
(1) AROPE: People at-risk-of poverty or social exclusion, i.e.
individuals who are at-risk-of poverty and/or suffering from
severe material deprivation and/or living in household with
zero or very low work intensity.
(2) AROP: At-risk-of poverty rate, i.e. share of people with
an equivalised disposable income below 60% of the
national equivalised median income.
(3) Severe material deprivation: Share of people who
experience at least 4 out of 9 type of deprivations: people
cannot afford to i) pay their rent or utility bills, ii) heat their
home adequately warm, iii) cope with unexpected
expenses, iv) eat meat, fish, or a protein equivalent every
second day, v) take a week's of holiday away from home
once a year, vi) have a car, vii) have a washing machine,
viii) have a colour TV, or ix) have a telephone.
Source: European Commission
3
Poor labour market performance has been a
key factor in the increase in poverty. The
proportion of low work intensity households rose
by 5.9 pps between 2008 and 2013. In the same
period the number of jobless poor (at risk of
poverty and living in low work intensity
household) went up by almost 50%. The disparity
between the top and bottom 20% of the income
distribution grew bigger in 2013 and the Gini
coefficient remains above 34%, compared to a
EU28-average level of 30.5% in 2013. The 7.6
pps. increase in the poverty gap(1) between 2008
and 2013 was the second largest in the EU after
Greece and the poverty gap now stands at 31.2%.
Fiscal consolidation continued in 2014, while
the accumulation of arrears has been halted
and the stock of arrears reduced. The general
government deficit reached an estimated 4.6% of
GDP at the end of 2014 (3.6% of GDP without
one-offs), down from 4.9% of GDP in 2013 (5.2%
of GDP without one-offs). Risks to the projection
relate to cash-accrual adjustments and to the oneoff operation related to Novo Banco. The arrears
strategy has halted the accumulation of new arrears
and begun to reduce the outstanding stock (by
about 0.3% of GDP over 2014). According to the
Commission's winter forecast, the plans
underpinning the 2015 budget are not sufficient to
reach the deficit target, revised by the government
to 2.7% of GDP, but would instead lead to a deficit
of 3.2% of GDP. Under the no-policy-change
assumption, the deficit is forecast to stand at 2.8%
of GDP by 2016. Risks around the projections
relate to macroeconomic developments, continued
efficiency gains in revenue collection, budgetneutral implementation of the envisaged tax
reforms, and possible spending slippages.
The consolidation effort has been slackening
since the end of the economic adjustment
programme. In 2014, the Constitutional Court
overturned key provisions on public wage and
pension cuts in the initial 2014 budget and the
budgetary plans for 2015. There were no measures
of similar quality and scale to compensate for the
resultant shortfalls, which have been offset mainly
(1) The poverty gap is defined as the difference between the
median equivalised total net income of persons below the
at-risk-of-poverty threshold and the at-risk-of-poverty
threshold, expressed as a percentage of the at-risk-ofpoverty threshold. It provides an indication of the severity
of poverty for those experiencing it.
4
by additional revenue from the economic recovery.
Thus, the scale of the discretionary measures
underpinning the recent budgetary strategy has
been substantially reduced over time and the
projected improvements in headline deficit derive
mainly from the ongoing cyclical recovery. The
structural balance is forecast to decline by 0.1% of
GDP over 2014-2016, with a procyclical loosening
of the fiscal stance of around 0.6% of GDP in
2015. The current budgetary strategy is hence
considered to be less sustainable than the one in
place at the end of the Programme. Given the high
level of public debt and financing needs,
significantly more ambitious reforms - especially
on the expenditure side - will be needed to comply
with the medium-term budget framework.
The gross debt-to-GDP ratio is forecast to have
reached about 129% of GDP by the end of 2014
and to fall to 125% of GDP in 2015. Higher
deposits and the depreciation of the euro are the
main reasons for the recent upward revisions in the
projected debt stock at the end of 2014, while the
net debt is estimated to have reached 121% of
GDP at the end of 2014 (lower than previously
anticipated). The downward path expected from
2015 should be supported by debt-reducing
operations, the projected economic recovery and
primary budget surpluses if fiscal discipline is
maintained.
After Portugal joined the European Monetary
Union, competitiveness was undermined by
rapidly rising nominal unit labour costs and
deep-seated structural problems in the product
and labour markets. As a consequence of
persistent current account deficits, Portugal
accumulated a high external debt, which was
mirrored domestically in the rising indebtedness of
both the private and the public sectors. Portugal
started to address these imbalances when the
financial and economic crisis broke out in 2008.
Gradual deleveraging in the private sector and
some rebalancing of production from the nontradable to the tradable sector have since helped to
improve external sustainability and contain macrofinancial risks. After its peak in 2013,
unemployment has been reduced but remains at
high levels.
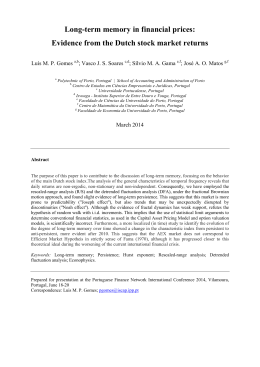
Portugal's deep-seated structural problems
have set potential growth on a downward
trajectory since the late 1990s. This was
aggravated by an inefficient allocation of
resources, as investment was mainly channelled to
the non-tradable sectors. During the 2000s,
potential growth showed a downward trend mainly
due to negative growth contributions of labour
supply and investment, while the growth
contribution of total factor productivity (TFP) has
been fairly stable. Between 2009 and 2013, strong
increases in unemployment and a slump in
investment activity accelerated the decline in
potential growth. In the medium term, potential
growth is expected to be supported by a recovery
in investment and further improvements of the
labour market (Graph 1.3).
Graph 1.3:
2
Contributions to potential growth in 2003-19
%, pps
forecast
1
0
-1
-2
03
05
07
09
11
13
15
17
19
TFP Contribution (pps)
Capital Accumulation Contribution (pps)
Total Labour (Hours) Contribution (pps)
PF Potential Growth (%)
Source: European Commission
However, potential growth is not projected to
resume the growth rates it experienced before
the economic and financial crisis. The main
impediments to a further acceleration of potential
output are ongoing deleveraging pressures in the
corporate sector (holding back investment), an
unfavourable
demographic
outlook
and
persistently high unemployment (dampening
labour supply), as well as the workforce's low
average skill levels combined with outstanding
inefficiencies in product and labour markets
(dragging on TFP growth). Structural rigidities
keep the potential growth rate from returning to
around 2%, which would be necessary to ensure
public debt sustainability.
5
Box 1.1: Economic surveillance process
The Commission’s Annual Growth Survey, adopted in November 2014, started the 2015 European
Semester, proposing that the EU pursue an integrated approach to economic policy built around
three main pillars: boosting investment, accelerating structural reforms and pursuing responsible
growth-friendly fiscal consolidation. The Annual Growth Survey also presented the process of
streamlining the European Semester to increase the effectiveness of economic policy coordination
at the EU level through greater accountability and by encouraging greater ownership by all actors.
In line with streamlining efforts this Country Report includes an In-Depth Review — as per
Article 5 of Regulation no. 1176/2011 — to determine whether macroeconomic imbalances still
exist, as announced in the Commission’s Alert Mechanism Report published on November 2014.
This Country Report includes an assessment of progress towards the implementation of the 2014
Country-Specific Recommendations adopted by the Council in July 2014. The Country-Specific
Recommendations for Portugal concerned public finances, labour market and social policies, the
financial sector and access to finance, network industries, housing, product and services markets,
the modernisation of public administration and the evaluation of structural reforms.
6
7
Table 1.1:
Key economic, financial and social indicators for Portugal
Real GDP (y-o-y)
Private consumption (y-o-y)
Public consumption (y-o-y)
Gross fixed capital formation (y-o-y)
Exports of goods and services (y-o-y)
Imports of goods and services (y-o-y)
Output gap
2008
0.2
1.4
0.4
0.4
-0.3
2.5
0.2
2009
-3.0
-2.3
2.6
-7.6
-10.2
-9.9
-3.3
2010
1.9
2.4
-1.3
-0.9
9.5
7.8
-1.9
2011
-1.8
-3.6
-3.8
-12.5
7.0
-5.8
-3.5
2012
-3.3
-5.2
-4.3
-15.0
3.1
-6.6
-6.1
2013
-1.4
-1.4
-1.9
-6.3
6.4
3.6
-6.4
2014
1.0
2.1
-0.5
2.4
3.8
5.9
-4.9
Forecast
2015
1.6
1.8
-0.3
2.9
5.0
4.9
-3.1
2016
1.7
1.5
0.2
3.1
5.4
4.8
-1.4
Contribution to GDP growth:
Domestic demand (y-o-y)
Inventories (y-o-y)
Net exports (y-o-y)
1.1
0.1
-1.1
-2.8
-1.2
0.9
1.1
0.9
-0.1
-5.7
-0.4
4.3
-7.0
0.1
3.6
-2.3
0.0
1.0
1.6
0.2
-0.8
1.6
0.0
0.1
1.4
0.0
0.3
.
.
1.8
.
.
.
.
.
1.6
.
.
.
.
.
0.4
.
.
.
.
.
.
.
Current account balance (% of GDP), balance of payments
Trade balance (% of GDP), balance of payments
Terms of trade of goods and services (y-o-y)
Net international investment position (% of GDP)
Net external debt (% of GDP)
Gross external debt (% of GDP)
-12.1
-10.4
-10.1
-6.2
-2.1
0.7
-9.4
-6.7
-7.1
-3.5
0.1
2.1
-2.3
4.8
-1.3
-2.0
0.2
1.6
-95.1 -107.9 -104.3 -101.0 -113.8 -116.2
75.2* 84.8* 83.2* 85.9* 103.0*
.
202.67 225.51 226.73 218.8 235.3 226.6
Export performance vs advanced countries (% change over 5 years)
-1.1
-0.3
0.7
-0.2
-6.8
1.5
.
Export market share, goods and services (%)
0.4
0.4
0.4
0.4
0.4
0.4
.
Savings rate of households (net saving as percentage of net disposable
income)
Private credit flow, consolidated, (% of GDP)
Private sector debt, consolidated (% of GDP)
-1.1
2.7
1.3
-0.9
1.1
1.7
.
15.9
196.2
5.3
204.1
5.3
201.5
0.4
204.2
-2.7
207.8
-2.4
202.8
.
.
.
.
.
.
.
.
Deflated house price index (y-o-y)
1.2
1.4
-0.5
-7.2
-8.4
-2.2
.
.
.
Residential investment (% of GDP)
4.7
4.1
3.6
3.3
2.7
2.3
.
.
.
Total financial sector liabilities, non-consolidated (y-o-y)
Tier 1 ratio1
Overall solvency ratio2
Gross total doubtful and non-performing loans (% of total debt
instruments and total loans and advances)2
3.0
.
.
6.7
.
.
6.3
.
.
-8.8
.
.
-3.1
.
.
-4.2
.
.
.
.
.
.
.
.
.
.
.
.
.
.
.
.
.
.
.
.
Change in employment (number of people, y-o-y)
Unemployment rate
Long-term unemployment rate (% of active population)
0.5
8.7
4.1
-2.9
10.7
4.7
-1.4
12.0
6.3
-2.3
12.9
6.2
-4.0
15.8
7.7
-2.7
16.4
9.3
1.8
14.2
.
0.7
13.4
.
0.7
12.6
.
Youth unemployment rate (% of active population in the same age group)
21.5
25.3
27.9
30.3
37.9
38.1
34.7
.
.
Activity rate (15-64 year-olds)
Young people not in employment, education or training (%)
73.9
10.2
73.4
11.2
73.7
11.4
73.6
12.6
73.4
13.9
73.0
14.1
.
.
.
.
.
.
People at risk of poverty or social exclusion (% of total population)
26.0
24.9
25.3
24.4
25.3
27.5
.
.
.
At-risk-of-poverty rate (% of total population)
Severe material deprivation rate (% of total population)
Number of people living in households with very low work-intensity (%
of total population aged below 60)
18.5
9.7
17.9
9.1
17.9
9.0
18.0
8.3
17.9
8.6
18.7
10.9
.
.
.
.
.
.
6.3
7.0
8.6
8.3
10.1
12.2
.
.
.
GDP deflator (y-o-y)
Harmonised index of consumer prices (HICP) (y-o-y)
Nominal compensation per employee (y-o-y)
Labour productivity (real, person employed, y-o-y)
Unit labour costs (ULC) (whole economy, y-o-y)
Real unit labour costs (y-o-y)
REER3) (ULC, y-o-y)
REER3) (HICP, y-o-y)
1.7
2.7
2.6
-0.2
2.8
1.0
0.5
-1.4
1.1
-0.9
2.4
-0.3
2.7
1.6
0.0
-0.4
0.6
1.4
2.1
3.4
-1.2
-1.9
-2.5
-3.5
-0.3
3.6
-1.8
0.1
-2.0
-1.7
-2.1
1.4
-0.4
2.8
-2.1
0.8
-2.9
-2.5
-5.5
-1.4
2.3
0.4
3.5
1.6
1.9
-0.4
2.4
0.0
1.0
-0.2
-0.5
.
0.2
-0.8
-0.5
0.7
1.0
0.1
0.7
.
-0.2
-1.2
-2.5
-1.0
1.4
1.1
0.8
.
-0.2
-1.5
-0.9
-0.9
General government balance (% of GDP)
Structural budget balance (% of GDP)
General government gross debt (% of GDP)
-3.8
.
71.7
-9.8
.
83.6
-11.2
-7.5
96.2
-7.4
-5.5
111.1
-5.5
-2.3
124.8
-4.9
-2.0
128.0
-3.2
-2.8
-4.6
-1.2
-1.7
-2.1
128.9 124.5 123.5
(1) Domestic banking groups and stand-alone banks.
(2) Domestic banking groups and stand-alone banks, foreign-controlled (EU and non-EU) subsidiaries and branches.
(3) Real effective exchange rate.
(*) Indicates BPM5 and/or ESA95
Source: European Commission, 2015 winter forecast; ECB
8
Table 1.2:
The MIP scoreboard for Portugal
Thresholds
2008
2009
2010
2011
2012
2013
3 year average
-4%/6%
-10.8
-10.8
-10.9
-8.9
-6.1
-2.5
p.m.: level year
-
-12.1
-10.4
-10.1
-6.2
-2.0
0.7
-35%
-95.1
-107.9
-104.3
-101.0
-113.8
-116.2
±5% & ±11%
2.0
1.0
-3.1
-3.0
-4.0
-0.6
-
0.6
-0.6
-3.1
0.7
-1.6
0.3
-6%
-12.6
-8.8
-7.8
-8.9
-15.7
-5.3
-
-4.1
0.7
-9.3
0.9
-4.6
7.7
9% & 12%
4.5
6.6
4.2
-0.6
-6.0e
-3.0e
-
2.8
2.7
-1.2
-2.0
-2.9e
1.9e
Deflated House Prices (% y-o-y change)
6%
1.0b
1.0
-1.0
-6.5
-8.3
-2.5
Private Sector Credit Flow as % of GDP, consolidated
14%
15.9
5.3
5.3
0.4
-2.7e
-2.4e
Private Sector Debt as % of GDP, consolidated
133%
196.2
204.2
201.5
204.2
207.8e
202.8e
General Government Sector Debt as % of GDP
60%
71.7
83.6
96.2
111.1
124.8
128.0
3-year average
10%
8.7e
9.3e
10.4e
11.8e
13.6e
15.0
p.m.: level year
-
8.5e
10.6e
12.0e
12.9
15.8
16.4
16.5%
4.4
8.9
11.5
-4.6
-3.7
-5.3
Current Account
Balance (% of GDP)
Net international investment position (% of GDP)
Real effective exchange % change (3 years)
rate (REER)
External imbalances (42 industrial countries p.m.: % y-o-y change
and competitiveness HICP deflator)
% change (5 years)
Export Market shares
p.m.: % y-o-y change
Nominal unit labour
costs (ULC)
Internal imbalances
% change (3 years)
p.m.: % y-o-y change
Unemployment Rate
Total Financial Sector Liabilities (% y-o-y change)
Flags: b: break in time series. e: estimated.
Note: Figures highlighted are the ones falling outside the threshold established by EC Alert Mechanism Report. For REER and
ULC, the first threshold concerns Euro Area Member States. (1) Figures in italic are according to the old standards
(ESA95/BPM5). (2) Export market shares data: the total world export is based on the 5th edition of the Balance of Payments
Manual (BPM5).
Source: European Commission
9
2.
IMBALANCES, RISKS AND ADJUSTMENT
2.1. EXTERNAL SUSTAINABILITY AND COMPETITIVENESS
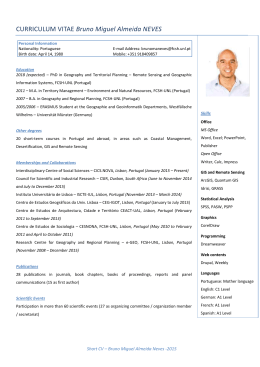
Portugal's Net International Investment
Position (NIIP) remains very negative,
notwithstanding the recent substantial current
account adjustment.(2) The NIIP deteriorated
sharply in the first decade after the introduction of
the euro, but its decline slowed down after 2010,
reaching about -115% of GDP in 2014 (Graph
2.1.1). A high level of net external debt makes the
economy vulnerable to reversals of capital flows or
sudden hiatuses. To improve the NIIP in the long
term, persistent and sizeable current account
surpluses are needed. The problem is aggravated
by the fact that past current account deficits fuelled
inefficient spending on private consumption and
investment in construction and property, rather
than increasing the productive capital stock, which
would have improved the economy's ability to
repay foreign debt. Indeed, low investment
efficiency appears to be a particular problem in
Portugal as its 'incremental capital-output ratio'
(ICOR)(3) is relatively high, pointing to low
investment productivity (Table 2.1.1).(4)
Graph 2.1.1: Breakdown of Portugal's Net International
Investment Position (NIIP)
50
% of GDP
Table 2.1.1:
ICOR (average growth in %)
Ireland
Greece
Spain
Italy
Portugal
1994-1998
2.2
6.5
7.3
10.4
8.0
1999-2003
3.8
5.6
6.9
50.9
6.8
2004-2008
2.0
-2.9
11.3
8.3
35.2
2009-2013
-3.4
-2.9
91.6
4.7
-4.5
Source: European Commission
Low investment efficiency may be the
consequence of Portugal's lost attractiveness as
an investment location. Since the mid-1990s,
other investment, mostly through banks, has been
the most important source of current account
financing, fuelling the credit booms which
preceded the economic and financial crisis (Graph
2.1.2). At the same time, inward FDI dried up,
partly as a result of Asia and Eastern Europe's
emergence as competitors for FDI, and partly
because of home-made problems such as rigid
labour and product markets and a difficult business
environment. The recent pick-up in the inflow of
FDI is related to privatisation. Portfolio investment
became increasingly important in financing the
current account between 2007 and 2009 reflecting
to some extent a hunt for yield.
Graph 2.1.2: Current account financing
20
0
ICOR (5-year average growth) in selected
euro area countries
% of GDP
15
10
-50
5
0
-100
-5
-10
-150
97 98 99 00 01 02 03 04 05 06 07 08 09 10 11 12 13 14*
Net portfolio investment, equity and investment fund shares/units
Net portfolio investment, debt securities
Other investment (net)
Net direct investment
Net financial derivatives and employee stock options
Net external debt (neg. sign)
Net Int'l investment position (NIIP)
Marketable debt (portfolio debt instr. and other investment, net)
Source: European Commission
-15
-20
97 98 99 00 01 02 03 04 05 06 07 08 09 10 11 12 13 14*
Portfolio investment, equity and inv. fund shares (net)
Net errors and omissions
Official reserves (net)
Other investment (net)
Portfolio investment, debt securities (net)
Direct investment (net)
Current account balance
Net lending/borrowing (CA+KA)
Source: European Commission
2
( ) Greece and Cyprus are the only EU countries reporting a
more negative International Investment Position than
Portugal.
(3) The inverse of the ICOR = (I/Y)/(ΔY/Y) is a measure of
output growth associated with any given investment. Other
things being equal, a lower ICOR indicates higher quality
or efficiency of investment.
(4) Baldi et al. (2014), 'Weak Investment Dampens Europe's
Growth', DIW Economic Bulletin, DIW.
Sustained sizeable current account surpluses
would be required in order to halve the very
negative NIIP within ten years. The
Commission estimates that Portugal would need to
run average current account surpluses of around
2.5% of GDP over the next decade to halve the
negative NIIP (currently about -115% of GDP) by
11
2024. Average current account surpluses of around
0.5% of GDP would reduce the NIIP to -80% of
GDP by 2024 (Graph 2.1.3). However, Portugal's
external debt position is sensitive to
macroeconomic shocks. For instance, a
simultaneous 1 pp. permanent drop in the increase
of real GDP and the GDP deflator, combined with
a fall in the trade balance of 2 pps of GDP, would
stop the decline in the negative NIIP from falling
further. Conversely, a positive growth, inflation
and trade balance shock of similar size would lead
to a substantial improvement in the NIIP to around
-47% of GDP by 2024.
Graph 2.1.3: NIIP sensitivity to macroeconomic shocks
0
% of GDP
-20
-40
-60
-80
-100
-120
-140
12
13
14 15* 16* 17* 18* 19* 20* 21* 22* 23* 24* 25* 26* 27* 28* 29* 30*
Net IIP for PT, Baseline
Net IIP for PT, Scenario (+1 pp real GDP growth, +1 pp inflation, +2 pps. trade balance)
Net IIP for PT, Scenario (-1 pp real GDP growth, -1 pp inflation, -2 pps. trade balance)
Net IIP for PT, Scenario (-0.5 pps real GDP growth, -0.5 pps inflation, -1 pp trade balance)
Net IIP for PT, Scenario (+0.5 pps real GDP growth, +0.5 pps inflation, +1 pp trade balance)
Source: European Commission
The sustainability of Portugal's external
position also depends on the structure of its
financing. The composition of the NIIP has
changed significantly since 2004 with the share of
other investment now clearly predominant (Table
2.1.2).(5) This shift from portfolio investment to
debt in financing the NIIP increases external
vulnerabilities.(6) NIIP financing through FDI,
which can be viewed as the most sustainable
option, as it not only allows risk sharing with
foreign investors but also brings technology and
entrepreneurial spirit to the economy, has
improved recently as a result of the privatisation
process.
(5) Other investments include the financing received during
the economic adjustment programme, which accounted for
about 40% of total NIIP in 2013.
(6) It is riskier to finance the current account through loans
than through equity as equity flows allow risk sharing
between domestic and foreign investors, while debt flows
do not.
12
Table 2.1.2:
Structure of the NIIP
Portfolio Investment (%)
FDI (%)
Other Investment (%)
2004
21
22
56
2009
34
18
48
2013
9
21
70
Source: European Commission
Portugal had a substantial current account
deficit for many years which started to reverse
with the onset of the economic and financial
crisis. Starting from a deficit of around 12% of
GDP in 2008, the current account is expected to
have posted a surplus for the second consecutive
year, at around 1% of GDP in 2014 (Graph
2.1.4).(7) The positive trajectory of the current
account has been mainly due to the remarkable
improvements in the trade balance, reflecting both
import compression due to weak domestic demand
and improved external competitiveness. This
contrasts with the persistently negative primary
income balance, which is linked to the past strong
increase in net external debt and includes interest
payments linked to portfolio and other
investments. The deficit in the primary income
balance will be a drag on the current account
balance for some time to come. However, owing to
a reversal in migration flows and additional
support from family members abroad in times of
crises, remittances from Portuguese citizens
working abroad have risen significantly in recent
years (reaching 1.6% of GDP in 2013), thereby
contributing to a substantial increase in the balance
of transfers. Traditionally positive, the balance of
capital transfers, mainly from the EU, is also likely
to remain stable in the coming years. The
improvement in the current account is reflected in
Portugal's net external lending position, which
turned positive in 2013 as a result of the gradual
deleveraging in the household and non-financial
corporations sectors and the fiscal consolidation
leading to reduced general government deficits
(Graph 2.1.5).
(7) The current account and net lending/ borrowing
components are reported in accordance with the BoP
methodology under the reviewed ESA2010 and BPM6.
The measurement of the current account using National
Accounts provides a similar picture of a marked turnaround
of the current account balance since 2008, although it is
estimated to have remained negative still in 2014.
Graph 2.1.4: External position and its components
15
% of GDP
10
5
0
estimated to have contributed about 10% to the
current account rebalancing in 2010-13, while the
fall in private sector debt, the slump in
construction activity and the slowdown in private
sector borrowing each contributed around 5% to
the total adjustment of the current account.
Graph 2.1.6: Portugal's headline and structural current
account balance
-5
-10
2
-15
% of GDP
0
-20
97 98 99 00 01 02 03 04 05 06 07 08 09 10 11 12 13 14*
Capital account (KA)
Secondary income balance
Primary income balance
Trade balance - services
Trade balance - goods
Trade balance
Current account balance (CA)
Net lending/borrowing (CA+KA)
Source: European Commission
-2
-4
-6
-8
-10
Graph 2.1.5: Net lending/ borrowing by sector
10
-12
-14
% of GDP
00
02
04
06
08
10
12
14
16
Current account as % of GDP
Cyclically adjusted CA as % of GDP
5
Source: European Commission
0
Graph 2.1.7: Breakdown of Portugal's current account into
cyclical and structural components
-5
-10
-15
99 00 01 02 03 04 05 06 07 08 09 10 11 12 13 14 15 16
Households and NPISH
Corporations
General government
Total economy
Source: European Commission
The adjustment of the current account has been
largely
structural.
Despite
the
import
compression during the recession, cyclical drivers
played a limited role in the current account
adjustment between 2010 and 2013 (Graph 2.1.6),
accounting for only about 18% of the 10 pps. of
GDP total increase in the current account balance
(Graph 2.1.7).(8) Structural fiscal consolidation is
(8) About 54% of the swing in the current account in 2010-13
is presumably due to "residual" structural factors, such as
improved product and geographical specialisation of
exports.
6
4
2
0
-2
-4
-6
-8
-10
-12
-14
-16
% of GDP
92 93 94 95 96 97 98 99 00 01 02 03 04 05 06 07 08 09 10 11 12 13
RESIDUAL
REER
Social expenditure (health)
Structural fiscal bal.
Reserves
Demographics
Relative GDP/worker
Intercept
CA explained by 'deep' fundamentals
Cycle
Credit/construction
Expected growth
Global financial conditions
Manufacturing
Resources
Net foreign assets
Current Account % of GDP
explained by fundamental & financial conditions
Source: European Commission
Despite the substantial structural improvement
of the current account, Portugal's external
position remains vulnerable. In particular, the
highly negative net foreign asset position has
become a major drag on the current account, in
itself implying a structural deficit of around 3.5%
of GDP.
13
A robust export performance contributed to the
external rebalancing of the Portuguese
economy. Export growth was subdued in the
2000s. Since 2008, however, this trend has been
reversed by significant improvements in external
competitiveness, and exports' share in GDP rose
from 27% in 2009 to around 40% in 2013 (see
Graph 2.1.8). This is still a relatively low level
compared with other small and open economies in
the euro area. It is a reminder that the rebalancing
towards export-led growth needs to continue in
order to sustain the improvement in the current
account.(9) Export growth was driven mainly by
exports of goods, which increased their share in
GDP from 19% in 2009 to 29% in 2013. In the
same period, Portugal's export market share
increased as annual export growth outpaced
growth in foreign demand for Portuguese exports
products by 3.7% on average, In National
Accounts terms.
Graph 2.1.8: Imports and exports of goods and services as
a proportion of GDP
50
% of GDP
40
30
20
10
GDP remained fairly constant at around 38%
between 2010 and 2013 (Graph 2.1.8). However,
this share is set to increase as the economic
recovery is increasingly led by domestic demand
(see Section 1).
The recent upswing in exports was supported
by favourable trends in nominal unit labour
costs (ULCs) developments. In the first decade
after the introduction of the euro, nominal unit
labour costs rose faster than in other euro area
countries, due to faster increases in nominal
compensation per employee and lower growth
rates in productivity. This was particularly the case
in the first years of the euro. The upward trend in
ULCs in the tradable sector reversed in 2010 and
ULCs fell by an average of almost 7% by the end
of 2013, owing to productivity increases coming
along with job cuts (Graph 2.1.9). However, the
fall in ULCs in the tradable sector seems to have
reversed recently, highlighting the challenge of
generating employment while containing price
pressures in the tradable sector. The correction of
nominal ULCs in the non-tradable sector did not
get under way until 2011, and this adjustment was
dampened at the end of 2013 by a reinstatement of
a part of the wages in the public sector that had
been cut to support fiscal consolidation.
Graph 2.1.9: Nominal ULC trends in tradable and nontradable sectors
0
-10
-20
140
-30
135
-40
index Q1-1999=100
130
-50
96
98
00
02 04 06 08 10 12
Imports of services (negative)
Imports of goods (negative)
Exports of services
Exports of goods
Trade balance
14* 16*
Source: European Commission
125
120
115
110
105
Imports have been compressed by falling
domestic demand during the economic and
financial crisis. Falling expenditure on investment
and consumption weighed on import demand
during the economic downturn and compensated
for the additional boost to imports provided by the
recovery in exports. As a result, the import share in
(9) Exports still account for a small proportion of GDP in 2013
in comparison with other countries in the euro area such as
Ireland (105%), The Netherlands (83%), Belgium (83%) or
Austria (54%).
14
100
95
90
99Q1 01Q1 03Q1 05Q1 07Q1 09Q1 11Q1 13Q1
Total NULC
Tradables
Source: European Commission
Non-Tradables
Successful rebalancing of the economy from the
non-tradable sector to the tradable sector also
requires flexibility in product markets. Further
product market reforms are necessary to tackle
structural weaknesses and rigidities in the nontradable sector, especially the network industries.
This would cut production costs for exporters and
boost competitiveness in general. Relative prices
rose until the onset of the economic crisis but
adjusted markedly in 2010-12 (Graph 2.1.10) as
structural reforms dampened the rising prices of
non-tradables; another even more significant factor
was the shift in the export product mix to higher
value-added exports with higher price tags. Both
trends are conducive to the further rebalancing
towards the tradable sector.
Graph 2.1.11: Real effective exchange rates in relation to
the EA-17
110
index 1999=100
108
106
104
102
100
98
96
94
99 00 01 02 03 04 05 06 07 08 09 10 11 12 13 14
Graph 2.1.10: Relative prices of tradables and nontradables in Portugal
REERulc
REERgdp
REERexp
Source: European Commission
1.1
ratio
Graph 2.1.12: Average growth rate in profit margins (201013)
1
5
LV
0.9
0.8
0.7
99Q1 01Q1 03Q1 05Q1 07Q1 09Q1 11Q1 13Q1
Non-tradable
4
In addition, the real effective exchange rate has
adjusted significantly in recent years. The
stronger adjustment occurred in the ULC-based
real effective exchange rate (Graph 2.1.11). That
adjustment was particularly marked between 2010
and 2012, when unit labour costs fell with
productivity growing faster than the nominal wage.
The significant drop in employment contributed to
productivity growth, while nominal wage rigidities
limited the extent of nominal wage adjustment,
which might only have occurred at the margin, i.e.
for new contracts.
IE
2
EL
1
IT
Relative prices Non-Tradable/ Tradable
Source: European Commission
3
-2
ES
CY
EE
LT
PT
LU
FR BE SK
0
AT 0
2
FI DE NL SI
-1
Tradable
4
6
Source: European Commission
The adjustment in both real wages and unit
labour costs is consistent with the challenges of
unemployment absorption and external
rebalancing. The adjustment achieved needs to be
preserved in view of the internal and external
equilibria.(10) In addition, wage differentiation
may facilitate the reallocation of resources towards
(10) See European Commission, 'The Economic Adjustment
Programme for Portugal tenth review', European Economy,
Occasional Paper 171, 2014', pp. 41-43.
15
tradable sectors, contributing to productivity
growth and higher export capacity. Graph 2.1.11
shows that the sharp downward adjustment in
ULC-based real effective exchange rate (REER)
was accompanied by a more muted decline in the
REER based on the GDP deflator. This is
consistent with the adjustment of real wages to the
labour market slack, but may indicate a more
limited responsiveness of price-cost margins to
weak
economic
conditions.
Nonetheless,
developments in unit labour costs alone could play
an important role in boosting the export sector as
long as profit margins are higher in the tradable
sectors, so that resources are shifted to tradable
industries. Graph 2.1.12 shows that profit margins
in the tradable sectors grew somewhat faster than
in the non-tradable sectors between 2010 and
2013.
Graph 2.1.13: PULCs, quality and prices of Portuguese
exports, by comparison with the EU28
average
1.1
fall, however, has not been matched by a similar
fall in relative export prices, which suggests that
Portuguese exporters have managed to extract
higher profit margins from their exports, possibly
by 'upgrading' their export product portfolio.
Indeed, there is evidence of continued
improvement in the quality of Portuguese exports
by comparison with the EU average. This is
captured by the 'Quality Index' (Graph 2.1.13),
which measures the capacity of exporting
companies to charge higher prices. However, while
the quality of Portuguese exports has outperformed
the rest of the EU in some specific sectors,
Portugal's export sector still specialises in products
with lower average prices and quality.
Graph 2.1.14: Geographical and sectoral breakdown of
export market share growth in Portugal
6
4
Annual
arithmetic
average
mean (%)
2
EU28 = 1
0
-2
1
-4
-6
2008-2010
0.9
2010-2012
2012-2013
Initial geographical specialisation
Initial product specialisation
Market share gains in geographical destinations
Market share gains in product markets
Source: European Commission
0.8
02
03
04
PULC
05
06
07
08
Export price
09
10
11
12
13
Quality index
Source: European Commission, Joint Research Centre, IPTS
institute
Portugal has improved its capacity to compete
in export markets by improving in production
efficiency and product quality. Relative physical
unit labour costs (PULCs)(11) in Portugal
fluctuated at about 90% of the EU average until
2011, but have since dropped markedly,
highlighting the competitiveness gains resulting
from lower production costs (Graph 2.1.13). This
(11) Physical unit labour costs (PULCs) are defined as the unit
labour cost, in euros, of producing a given quantity of an
export product.
16
Both product and geographical specialisation
have contributed to the increase in export
market shares since 2010. The unfavourable
geographical specialisation and product mix of
Portugal's exports led to falling export market
shares between 2008 and 2010. However, this
trend has since reversed and export market shares
are now being boosted as Portugal's exporters
make inroads into faster growing export markets
with export products that are in greater demand.
Due to the recovery in the main European trading
partners,(12) the initial geographical specialisation
(12) The three main Portuguese trading partners belong to the
euro area, i.e. Spain, Germany and France. They account
for about 50% of total exports.
has recently boosted Portugal's export market
shares (Graph 2.1.14).
Despite recent improvements in the structure of
its exports, Portuguese firms are still specialised
in relatively cheap and low-quality products.
Since 2006, the share of capital goods in
Portuguese exports has only increased by 1.4 pps,
while the share of consumer goods fell by 1.3 pps.
Capital goods are generally high value added
products which compete through good quality. In
2013, the share of capital goods in Portuguese
exports was still markedly lower than their share in
aggregate EU28 exports (see Table 2.1.3).
Portugal's higher proportion of consumer goods in
total exports signals the need to strengthen higher
value-added production.
Table 2.1.3:
Structure of goods exports by broad
economic category (in %)
Portugal
2006
2009
2013
Intermediate goods
56.0
52.8
55.9
8.4
9.9
9.8
35.6
37.3
34.3
Capital goods
Consumption goods
2006
2009
2013
Intermediate goods
EU28
53.0
51.2
54.2
Capital goods
Consumption goods
18.7
28.3
17.6
31.2
17.1
28.8
Source: European Commission
Portuguese exports of services have remained
broadly constant as a proportion of worldwide
service exports over the last decade. Growing
exports of transport services were broadly offset
by the decline in tourism and other services (Table
2.1.4). Transport sector services are characterised
as high value added and their expansion may
reflect significant productivity gains. Overall,
exports of services have been growing in
importance in the Portuguese economy. Portuguese
exports of services accounted for 27% of total
exports of goods and services between 2007 and
2013 - 3 pps. higher than between 2000 and 2006.
The ratio of Portuguese exports of services to GDP
also rose from an average of 6.5% (2000-06) to
8.9% between 2007 and 2013. Despite this
increase, Portuguese exports of services as a
proportion of GDP are still lower than in other
small and open European countries, such as
Belgium, Ireland or the Netherlands.
Table 2.1.4:
World market shares for services (in %)
Total Services
Transportation
Travel
Other services
2000-2001
0.6
0.4
1.1
0.3
2012-2013
0.6
0.8
1.0
0.3
Source: European Commission
So far, Portugal has made significant progress
to date in adjusting its external and internal
imbalances.
However,
despite
major
improvements, the adjustment is not complete and
large external liabilities still represent a major
source of vulnerabilities. The NIIP position has
worsened further, as recent improvements in the
current account are not sufficient to counterbalance
the negative changes in the NIIP. In the past,
substantial improvements in cost developments,
particularly in the non-tradable sector, along with
the improved quality of exported goods, have
boosted competitiveness and exporters' capacity to
participate successfully in international markets.
Further improvements of cost developments will
have to take place in a low inflation environment
and may be hampered by existent inefficiencies
and rigidities in the domestic market. Wideranging reforms in product and services markets
could help ensure that capital is allocated
efficiently to where it is most productive and
would produce higher productivity and long-term
growth.
17
2.2. DEBT OVERHANG AND DELEVERAGING
Portugal has undergone a severe recession
characterised by corporate financial distress, a
struggling banking sector and accelerating
public debt. In the post-Programme context, the
high financial leverage of Portuguese firms
continues to be a critical factor constraining firms'
performance and impeding economic recovery.
This section first looks at trends in household and,
in particular, non-financial corporate sector
indebtedness and at key policy measures taken to
improve the financial situation of non-financial
corporations (NFCs). The second part of this
section highlights public debt sustainability issues.
Graph 2.2.1: Household indebtedness as a percentage of
GDP
140
% of GDP
120
100
80
60
40
Deleveraging dynamics in the private sector
Portugal has made significant progress with
reforming its economy in the context of a deep
economic crisis. Three years of determinated
efforts have enabled the country to successfully
exit the economic adjustment programme in June
2014. Undeniably, Portugal has come a long way
in improving its private sector imbalances, one of
the Programme's key areas. In recent years, the
households' savings rate rose considerably to about
10% of disposable income (from 7% in 2008),
while indebtedness fell from nearly 95% of GDP
in 2009 to just over 80% of GDP in the final
quarter of 2014. This allowed the highly leveraged
financial sector to significantly lower its loans-todeposit ratio which resulted from a higher stock of
deposits and decreasing stock of loans. The
household sector adjustment is even more
remarkable as it occurred in the midst of a panEuropean financial crisis and against the
background of declining disposable income.
Nonetheless, the difficult financial situation of
Portuguese households is reflected in the large
number of insolvent borrowers, which started to
rise as far as back in 2008. Between January and
November 2014, the number of individuals filing
for bankruptcy reached 12,979, over three times as
much as in 2010, according to Instituto Informador
Comercial (IIC). However, 2014 marks a 2%
improvement when compared with the same period
in 2013. According to Banco de Portugal, the ratio
of non-performing household loans continues to
rise, reaching 4.9% in the third quarter of 2014 (up
by 0.2 pp. quarter-on-quarter), and around
660,000(individuals – representing about 15% of
all individual borrowers – had overdue loans.
18
20
0
04
05
06
DE
07
08
IE
09
10
ES
11
12
FR
13
PT
Source: European Commission
Graph 2.2.2: Private NFC indebtedness as a percentage of
GDP
200
% of GDP
180
160
140
120
100
80
60
40
20
0
04
05
DE
06
07
IE
08
09
ES
10
11
12
FR
13
PT
(1) Excluding trade finance and intercompany lending.
Source: European Commission
Deteriorating growth prospects and changing
attitudes to risk have prompted non-financial
corporations to adjust their balance sheets,
although to a lesser extent than households. The
very high indebtedness of non-financial
corporations, both by historical standards and
compared to other euro area economies, remains a
major vulnerability of the Portuguese economy.
There is a vast literature confirming the
importance of liquidity, financial structure and
financial distress on firm performance. Recent
empirical studies, often based on experience from
previous economic and financial crises, suggest
that corporate debt levels above 90% of GDP(13)
can act as a major drag on economic growth, as
higher indebted companies are less likely to invest
and hire. Portuguese private corporate debt stood
at 149.2%(14) of GDP in September 2014, which is
some 18 pps. lower than the peak level of 167.4%
in 2012. Accounting for the total NFC sector debt
including public corporations and all intercompany lending, the stock of debt amounts to a
staggering 172% the GDP, which is close to
double the above mentioned threshold. For a
significant set of corporations the balance sheet
adjustment has been rather disappointing on
average, and Portugal's corporate sector remains
one of the most indebted in Europe. This high level
of corporate indebtedness hinders corporate
profitability and has a negative impact on the
investments required to stimulate growth in the
tradable sector.(15) Moreover, the high debt ratio of
Portuguese non-financial corporations represents a
major concern for the banks’ balance sheets and
the country's wider financial stability, through the
large number of non-performing loans (NPLs) and
corporate bankruptcies.
Pursuing orderly deleveraging in the various
highly indebted sectors of the Portuguese
economy, while at the same time stimulating
economic growth, remains a key challenge. The
banking sector plays a crucial role in this context
by reallocating of resources to the most productive
and innovative segments of the economy. A
selective approach to corporate credit is essential
to ensure the long-term viability and
competitiveness of private sector firms. The
internal rebalancing of the Portuguese economy
depends on striking the right balance between
deleveraging on the one hand and reallocating
resources on the other. This is further complicated
by a low-growth and low-inflation environment in
(13) E.g., Cecchetti et al. (2011), 'The Real Effects of Debt', BIS
Working Papers No 352.
(14) Non-consolidated. The consolidated debt level was about
120% of GDP, Ministry of Economy.
(15) Goretti, M. and M. Souto (2013), 'Macro-Financial
Implications of Corporate (De)Leveraging in the Euro Area
Periphery', IMF Working Paper No. 13/154.
Portugal, representing a challenge to the operations
and profitability of Portuguese firms and to the
domestic banking sector, which is highly exposed
to low interest rates through a large stock of legacy
mortgages.(16)
Graph 2.2.3: Breakdown by sector, total debt-to-GDP
ratios
30
% of GDP
25
20
15
10
5
0
08
09
10
11
12
13
14Q3
Manufacturing, mining and quarrying
Electricity, gas and water
Construction
Trade and repair of motor vehicles
Transportation and storage
Accommodation and food service activities
Real estate activities
Administrative activities
Source: Banco de Portugal
Table 2.2.1:
Debt-to-equity and return on equity ratios,
broken down by sector
Debt-to-Equity
Return-on-Equity
2008
2013
2008
2013
Agricultural and Fishing
2.2
1.6
-1.2%
-0.6%
Manufacturing and Energy
2.1
2.2
5.7%
7.3%
Construction and Real Estate
3.5
3.1
-2.6%
-4.0%
Distributive Trade
2.7
2.3
4.5%
Transportation and Storage
6.2
12.1
-6.4%
6.1%
Accommodation and Food Services
2.5
3.5
-6.1%
-20.1%
Information and Communications
2.0
1.3
12.6%
1.5%
Other Services
2.8
2.2
8.0%
5.6%
2.7%
Source: INE
The leverage picture is quite mixed across
different
economic
sectors.
Measuring
indebtedness against the level of economic activity
conceals the major differences that exist between
sectors. Breaking figures down by sectors and key
corporate ratios – such as debt-to-equity and
return-on-equity (ROE) – is far more telling from
an analytical perspective. The optimal debt-toequity ratio may be considered to be about 1, i.e.
when a firm's liabilities are equal to its equity, but
the ratio is very industry-specific as it depends on
the proportion of current and non-current assets.
(16) Most mortgages have a very low but fixed mark-up on the
Euribor.
19
Table 2.2.2:
Importance of SMEs in the Portuguese economy
Number of enterprises
Number of employees
Portugal
Portugal
Number
EU28
Proportion
Proportion
Number
Value added
EU28
Portugal
EU28
Proportion
Proportion
EUR bn
Proportion
Proportion
21.6%
Micro
739,555
95.4%
92.4%
1,230,990
42.8%
29.1%
15
22.4%
Small
30,732
4.0%
6.4%
588,424
20.4%
20.6%
15
22.6%
18.2%
Medium-sized
4,547
0.6%
1.0%
444,610
15.4%
17.2%
14
21.6%
18.3%
SMEs
774,834
99.9%
99.8%
2,264,024
78.7%
66.9%
44
66.5%
58.1%
Large
722
0.1%
0.2%
613,790
21.3%
33.1%
22
33.5%
41.9%
Total
775,556
100.0%
100.0%
2,877,814
100.0%
100.0%
66
100.0%
100.0%
Source: EC Enterprise and Industry, 2014 Small Business Act for Europe (SBA), Portugal factsheet
The optimal ratio also varies according to the size
and ownership structure of the business.
Nevertheless, for most companies the maximum
acceptable debt-to-equity ratio is 1.5-2. In
Portugal, the NFC debt-to-equity ratio, defined as
total liabilities over total equity, was recorded as
2.82 in 2008, falling to 2.51 by the end of 2013.
For SMEs this ratio reached almost 3 in 2008 and
declined to 2.48 in 2013. Looking at individual
sectors, the largest financial imbalances in the
economy at the end of 2013 were to be found in
the construction and real estate sector, with a debtto-equity ratio of 3.1, accommodation and food
services (3.48), and transport and storage (12.11).
The corporate sector's difficult economic situation
is also highlighted by the return on equity (ROE).
The ROE (Table 2.2.1) for the construction and
real estate sector (-4% in 2013) has remained
negative since 2008. Accommodation and food
services fared even worse with a ROE of -20.1% in
2013. Generally, close to half of private-sector
firms have been burning their equity or posting
negative profits over the past 5 years.
SMEs have traditionally played a much bigger
role in the Portuguese economy than in other
EU Member States and are the most vulnerable
companies. According to the 2014 Small Business
Act for Europe (SBA), in 2013, they accounted for
79% of jobs and 66% of value added, both of
which are considerably higher proportions than the
EU average. Moreover, 95% of firms in Portugal about three percentage points above the EU
average - are microenterprises. They also generate
more than 40 % of private sector jobs. Most SMEs
are active in services, manufacturing and trade,
and in all of these areas they provide the majority
of jobs.
20
Given
their
size,
SMEs
(especially
microenterprises) are heavily dependent on the
domestic banking sector. This makes them
vulnerable to the sharp tightening in credit
conditions that has occurred in recent years, as
banks have experienced funding pressures and
rapidly deleveraged their balance sheets.
Typically, microenterprises have far less power
than larger firms to negotiate debt rescheduling
with banks. The high refinancing needs linked to
short-term liquidity for financing current
operations have only aggravated microenterprises'
liquidity constraints. As most Portuguese SMEs
entered the crisis already highly leveraged (with
debt-to-equity ratios approaching 3, or financial
debt amounting to 12 times EBITDA,(17) rolling
over debt became difficult as profits fell. High
leverage has forced Portuguese SMEs to dismiss
staff and engage in rapid deleveraging. Not
surprisingly, between 2008 and 2013 Portuguese
SMEs shed over 350,000 jobs, a 13.5% cut in their
total workforce in 2008. Value-added and the total
number of SMEs also declined, the latter to a much
lesser extent. Most of deleveraging by NFCs after
the peak in June 2011 (some EUR 18 billion in
nominal terms) was attributable to SMEs. Their
share in the debt-to-GDP ratio dropped from
94.5% in 2012 to 84.8% in the third quarter of
2014. In general, over 20% (Table 2.2.3) of
Portuguese firms were finding it difficult in 2013
to cover their debt service expense from EBITDA
and were encountering some solvency problems.
This suggests that there will be more deleveraging
and, probably, insolvencies in future.
(17) EBITDA: Earnings before interest, taxes, depreciation, and
amortisation; source: BACH Database.
Table 2.2.3:
Corporate solvency risk heat map
Debt/ Capital employed
< 0.7
Debt/ EBITDA
0.7 to 0.9
> 0.9
> 12x
10.9
5.6
21.1
6x to 12x
20.5
16.2
2.9
< 6x
17.5
4.2
1.2
Source: European Commission, ORBIS Database
Graph 2.2.4: Distribution of corporate solvency risk by
sector
100
80
60
40
20
0
Low
Medium
High
Source: European Commission, ORBIS Database
Debt can pose systemic risk to the banking
sector. Recent years have been marked by the
worst financial crisis that has ever faced the
Portuguese banking sector. Portuguese banks'
funding structure and business model based on a
reliance on wholesale funding, an oversized branch
network and generous financing of mortgages and
non-tradable sector activities, are currently
undergoing major changes. Most banks have
sought to boost market confidence by reducing
their loans-to-deposits leverage and raising capital,
despite the low profitability environment. But
many credit institutions remain fragile on the asset
side, as non-performing loans (NPLs) have
continued to rise until recently. Portuguese banks'
exposure to NFCs has been a major challenge
since the onset of the economic crisis. The nonperforming loan ratio in this segment reached
18.7% by the third quarter of 2014, with some
banks facing corporate NPL at well above 20%.
About 90% of credit to the NFC sector is
concentrated in 10% of the firms with bank
credit.(18) Among these firms, overdue credit as a
proportion of the total shot up to nearly one third
by mid-2014. This mainly reflects the position of
the over-leveraged construction sector, in which
around half the debtors with big bank exposures
have credit overdue.
While coverage ratios (loan loss provisions as a
percentage of NPLs) in the NFC segment have
improved (currently standing at about 60%),
the capacity of the banking sector to withstand
losses from a wave of NPLs appears to be
limited without additional capital injections. In
a worst-case scenario where all NPLs were fully
written off and without taking the collateral into
account, banks’ capital would be cut by about a
third. Nonetheless, the results of the
Comprehensive Assessment of Portugal's three
biggest banks,(19) which the European Central
Bank finalised in published in autumn 2014,
suggest that the top-three Portuguese banks
covered in the test are adequately capitalised under
the baseline assumptions.(20) Even though, at the
current juncture, risks to the banking sector's
capital position appear to be contained, financial
stability could be strengthened by adopting a more
pro-active approach to cleaning up specific large
and risky corporate loan exposures. Granting credit
to viable projects and not compromising nonfinancial sector deleveraging remains a key
challenge for banks. This means that the criteria
for granting and monitoring credit must be
appropriate to the current situation, so that new
credit is used efficiently to finance profitable and
productive projects. Furthermore, in a scenario of
prolonged low interest rates, it remains paramount
to ensure that incentives are not created to delay
recognition of losses by the banks.
(18) Financial Stability Report, November 2014, Banco de
Portugal.
(19) Before the decision by Banco de Portugal to apply a
resolution measure to Banco Espírito Santo, Espírito Santo
Financial Group had been subject to the comprehensive
assessment carried out by the ECB and it had concluded
the Asset Quality Review (AQR) phase of the
Comprehensive Assessment, which had focused on the
review of the loan portfolio, in line with the procedure
applicable to all the Portuguese banks. However, Novo
Banco was excluded from the disclosure of the AQR
results, published on the 26th October 2014 due to the fact
that its opening balance sheet was not available and thus it
was not possible to conclude on the impacts on the bank’s
solvency ratios.
20
( ) Banco Comercial Português, which failed the stress test's
adverse scenario, submitted a capital plan to the ECB. The
plan was subsequently accepted by the ECB.
21
The policy response has been appropriate
although its impact has been slow. Most
Portuguese NFCs are chronically short of capital,
and the country in general would benefit greatly
from more foreign direct investment. Action has
been taken at various levels to address the multiple
and challenging aspects of the complex high
corporate indebtedness issue. It is imperative to
accelerate restructuring by corporations that,
although indebted, are still viable. Equally
authorities must enable firms that have no viable
operating models to make an orderly exit from the
market.
Portugal has taken major steps to overhaul its
corporate
insolvency
and
restructuring
framework, giving it a stronger focus on the
recovery of firms rather than their liquidation.
A new debt restructuring mechanism inspired by
US Chapter 11 provisions has been added to the
bankruptcy code to allow fast-track restructuring
before an insolvency proceeding begins. One of its
features is the possibility for courts to enforce outof-court agreements between the debtor and a
majority of creditors. For micro and small firms, a
specific out-of-court mechanism (SIREVE) has
introduced more rapid mediation by a new public
mediator agency with electronic platforms to
reduce paperwork and guarantees to companies
and creditors during the negotiation phase.
SIREVE and PER (special revitalisation process)
have both been recently revamped; SIREVE
becoming leaner and now has a financial
assessment system, financial filters and improved
seniority rules for new money and investors. The
number of businesses starting insolvency
proceedings fell by 7.6% in 2013, the first drop in
five years, one reason for this being the efficient
use of PER that covered 985 companies, according
to 2014 Small Business Act for Europe (SBA). In
general, the authorities have stepped up efforts as
regards corporate debt rescheduling since the
launch in May 2014 of the Strategic Plan for
Corporate Debt Restructuring. Changes to the
Commercial Code now promote the issuance of
quasi-equity/hybrid instruments such as non-voting
shares, while also allowing for easier and fast-track
procedures to issue company bonds, thus
promoting restructuring rather than company
liquidation. Portugal also continues to offer
relatively good conditions (in comparison with its
European peers) for entrepreneurs who, despite
past failure, wish to start a new business. Changing
22
social attitudes towards insolvency are reducing
the stigma of business failure.(21) Banco de
Portugal is promoting debt rescheduling among
NFCs and has continued to introduce tighter
supervision of credit institutions. In addition to
cross-cutting inspection programmes, Banco de
Portugal has recently implemented an 'Early
Warning System' for supervisory purposes, to
identify firms (including SMEs) that are very
likely to default because their debts are too high.
This may indirectly promote early corporate debt
rescheduling. Moreover, Banco de Portugal has
issued a set of recommendations on procedures to
identify and manage credit at risk (Special
Assessment Programme). This will encourage
more conservative impairment standards across the
banking sector. All these initiatives have had a
positive impact on reducing financial difficulties
and indebtedness in the corporate sector. Debt
rescheduling tools have been made available to
highly leveraged corporations and incentives to
capitalise have been set up, but an arduous task
still lies ahead. According to the IMF, episodes of
high growth in corporate indebtedness are
generally followed by deleveraging processes, in
which approximately two thirds(22) of the original
increase in debt is subsequently reduced. Applying
this percentage to Portuguese firms, debt reduction
would still have to shave off some 40 percentage
points of private corporations' indebtedness.
Public debt sustainability
General government debt has reached very high
levels. In the context of the global financial crisis
and subsequent recession, the very high fiscal
deficits, the reclassification of off-balance items
and entities in the general government perimeter
and the stabilisation interventions in the financial
system have put general government debt on a
(21) EC Enterprise and Industry, 2014 Small Business Act for
Europe (SBA), Portugal factsheet. Despite the
unfavourable economic environment for SMEs in Portugal,
2.4 new businesses were set up in 2013 for every one that
closed. The number of new companies created — 35,296
— was 12.8 % higher than in 2012, and growth was
consistent throughout the year and in all sectors, except for
electricity, gas and water. Most new businesses were
created in the services sector (accounting for almost one
third of all new firms), trade (16 %) and accommodation
and food services (11 %).
22
( ) Bornhorst, F. and M. Ruiz-Arranz (2013), 'Indebtedness
and deleveraging in the euro area', Euro Area Policies:
2013 Article IV Consultation, Selected Issues Paper, IMF
Country Report No. 13/232.
steeply rising trend. From 2010 to 2013 the gross
debt-to-GDP ratio increased by over 30 pps and it
may have approached 129% of GDP by the end of
2014, one of the highest public debt levels in the
euro area. Higher deposits and the depreciation of
the euro are the main reasons for recent upward
revisions in the projected gross debt stock at the
end of 2014. The level of net debt reached an
estimated 121% of GDP at the end of 2014,
slightly lower than previously anticipated, as a
result of recent cash management operations. The
primary balance, which records surpluses since
2013, reached an estimated 0.4% of GDP in 2014
and should be above 1.5% of GDP in 2015 and
2016, moderating future financing needs.
public debt ratio out of control. An unsustainable
debt trajectory would potentially have a very
adverse impact on Portugal's economic stability
and could have negative outward spillovers via the
sovereign risk channel.
Graph 2.2.5: Macroeconomic risk - growth and interest
rates
140
% of GDP
130
120
110
100
90
80
While the the gross public debt-to-GDP ratio is
expected to reverse its current rising trend in
the short term and public debt is considered
sustainable under plausible scenarios, debt
dynamics are vulnerable to adverse shocks.
Supported by the projected economic recovery,
expected primary surpluses and debt-reducing
operations, the debt-to-GDP ratio is expected to
fall to 125% of GDP in 2015 and to continue
falling gradually after that. Furthermore, model
simulations of debt sustainability have been carried
out that incorporate the scenario of the 2015 winter
forecast until 2016 and other technical assumptions
for the medium term (i.e. structural primary fiscal
balance at 2.1% of GDP surplus as of 2018;
nominal interest rates at around 4-4.5% of GDP;
nominal GDP growth rate of 3-3.5%; ageing costs
in line with the Commission's 2012 Ageing
Report). For the baseline scenario, the results point
to a gradual fall in the debt ratio in the long term.
Nevertheless, given the very high starting point,
the debt ratio is projected to remain above its precrisis level (66% of GDP in 2008) for many years
to come, not falling below 100% of GDP before
2030.
Sensitivity analysis suggests that the declining
debt-to-GDP trajectory is sensitive to financial
market volatility and vulnerable to adverse
economic developments. Overall, the debt
sustainability analysis reveals that the debt
reduction path of the baseline is robust across a
number of reasonable scenarios, but plausible
shocks could considerably worsen the dynamics of
Portugal's public debt (see graphs 2.2.5 and 2.2.6).
Shortfalls in nominal growth, sharp interest rate
rises or slackening fiscal efforts could put the
70
60
12
13
14 15 16 17 18 19 20 21 22 23 24 25 26 27 28 29
Baseline
Negative growth shock : -1p.p. GDP growth from 2016
Positive growth shock : +1pp GDP growth from 2016
Interest rate shock : +1p.p. from 2016
Interest rate shock : +2p.p. from 2016
Combined growth and interest rate shock (growth -1 pp, interest +1pp) from 2016
Combined growth and interest rate shock (growth +1 pp, interest -1pp) from 2016
30
Source: European Commission
Graph 2.2.6: Fiscal consolidation and ageing costs
140
% of GDP
130
120
110
100
90
80
70
60
12
13
14
15
16
17
18
19
20
21
22
23
24
25
26
27
28
29
30
Baseline
2019 scenario: SPB constant at 3 percent level beyond the programme horizon
Consolidation scenario to achieve alternative MTO (0% of GDP) from 2019
Scenario with extra 20% increase (by 2060) in ageing cost compared to the baseline
Scenario to reach MTO in 2017
Source: European Commission
The very high level of government debt places a
heavy burden on public finances. High public
debt implies less fiscal room for manoeuvre in the
event of adverse shocks, with potential detrimental
implications for growth and jobs. This highlights
the need for continued stabilisation of public
finances.
23
Budgetary discipline and fiscal and growthenhancing structural reforms are needed to
safeguard fiscal sustainability and achieve a
significant reduction in the debt path. The
current very high debt ratio implies a significant
adjustment burden, requiring the conditions
underpinning falling debt to be steadfastly
maintained in the coming decades. In particular,
sustainability is attainable only if budgetary
discipline is maintained over time, with continued
progress towards the medium-term budgetary
objective. Achieving the deficit targets and
lowering the primary expenditure-to-GDP ratio in
the medium term would generate fiscal space for
growth-enhancing public expenditure and further
tax reforms. In addition to making progress with
fiscal adjustment, it will be essential to strengthen
fiscal responsibility through stronger control over
government expenditure and to improve revenue
collection, if budget promises are to be kept. In
particular, fiscal structural reforms designed to
strengthen the framework for public financial
management and continued reforms of the revenue
administration must be firmly implemented in the
years that lie ahead (see further details under
Sections 3.1.2 and 3.1.1). Finally, a sound path to
reduction depends on medium and long-term
economic growth. This means perseverance with
structural reforms will be essential (further details
under Section 3).
24
2.3. LABOUR MARKET
The Portuguese labour market is showing signs
of recovery as of 2013, following the deeprooted adjustment in recent years. Recent wage
developments have been conducive to the
adjustment process and the overall labour market
performance is starting to benefit from reforms
implemented during the adjustment programme.
Nonetheless, several challenges remain, the most
important being the prompt absorption of the large
pool of unemployed, which weighs heavily on both
economic growth and the social situation. For
economic growth to be sustainable and with a view
to strengthening the export sector and contributing
to external rebalancing, a substantial part of the
unemployment needs to be absorbed by the
tradable sector. A well-functioning labour market
is key to achieve this goal, while contributing to
lift Portugal's growth potential.
in th
Graph 2.3.2: Employment and unemployment rates and
long-term unemployment
80
%
%
75
in th
5,000
4,800
1,000
17
15
4,600
55
11
50
800
40
500
400
4,200
13
45
600
4,400
60
900
700
19
70
65
Graph 2.3.1: Employment and unemployment
5,200
The labour market situation has recently
improved, but unemployment rates remain
high, while employment rates are far below
their 2008 peak. The employment rate among 2064 years old - traditionally high in Portugal - has
fallen significantly since the start of the economic
crisis, from 73.1% in 2008 to 65.6% in 2013
(Graph 2.3.2). However, it has been rising since
the first quarter of 2013 and, according to the most
recent data, stood at 68.3% in the third quarter of
2014 (72.3% for men and 64.6% for women).
9
7
35
5
07Q1 08Q1 09Q1 10Q1 11Q1 12Q1 13Q1 14Q1
Employment rate (20-64)
Long-term unemployment
Unemployment rate (rhs)
Source: European Commission
300
4,000
07Q1 08Q1 09Q1 10Q1 11Q1 12Q1 13Q1 14Q1
Employment
200
Unemployment (rhs)
Source: European Commission
The economic crisis has had a drastic impact on
employment. Total employment fell by about
730,000 (14.5%) between the peak in the second
quarter of 2008 and the trough in the first quarter
of 2013 (Graph 2.3.1). Unemployment rose by
525,000 in this period. The construction sector
alone lost 244,000 jobs, almost halving
employment in the sector. Manufacturing also lost
about 180,000 jobs (about 20%); however,
employment in the sector has risen in the recent
quarters. A key facet of Portugal's economic
recovery will be absorbing of the large pool of
unemployed people.
After a steep rise between 2008 and 2013, the
unemployment rate has been falling since the
second quarter of 2013. However, it was still high
at 13.7% in the third quarter of 2014 (13% for men
and 14.5% for women). Long-term unemployment
as a proportion of total unemployment stands at
over 60% (Graph 2.3.2). It has risen significantly
in the last year, reflecting a fall in the separation
rate and a slow pick-up in the hiring rate. The large
proportion of people unemployed for more than
one year, in turn, can create difficulties with
absorbing unemployment (i.e. "hysteresis"
effects).(23)
(23) The unemployment gap in 2014 (difference between the
NAWRU and the unemployment rate) is about 2.4%.
However, the NAWRU itself varies with the cycle leading
to overestimation of structural unemployment in crisis
periods. Estimations of the NAWRU for Portugal,
controlling for its determinants (TFP growth, growth in net
25
Youth unemployment is particularly high, but
is on a decreasing trend. The youth
unemployment rate stood at 32.2% in the third
quarter of 2014 (34.5% among women).
Nonetheless, joblessness is declining, down from a
peak of 42.5% in the first quarter of 2013. The
percentage of under-30s currently not in education,
training and employment (NEETs) has been rising
since 2009, reaching 16.7% in 2013.
Graph 2.3.3: Unemployment rate, actual and predicted
based on Okun's law
20
the labour market reforms, including the
substantial adjustment in real wages that has
occurred in recent years and the stepping up of
active labour market policies.(25)
The economy has undergone a substantial real
wage adjustment over the past few years. Real
wages had already been growing below
productivity before the economic crisis (Graph
2.3.4). This trend became more pronounced after
2010, owing to a moderation in nominal wages
growth and a sustained growth in labour
productivity.
%
Graph 2.3.4: Real compensation per employee and
labour productivity
18
16
14
120
12
index 1999=100
10
115
8
6
110
4
2
105
0
08Q1
09Q1
10Q1
11Q1
12Q1
13Q1
14Q1
Unemployment rate
Forecast based on Okun's law
100
Source: European Commission
95
99 00 01 02 03 04 05 06 07 08 09 10 11 12 13 14
Over the past year, the fall in unemployment
outpaced GDP growth. The drop in the
unemployment rate has been much more
pronounced than expected on the basis of the
historical relationship between unemployment and
GDP (Graph 2.3.3). This suggests that specific
factors might have played a role, such as the
decline in active population(24) and the effect of
capital stock, tax wedge and active and passive labour
market policies), hint at structural unemployment that is
considerably lower than the NAWRU (ECFIN's Labour
Market Developments 2013, pp. 84-89). Nonetheless, the
same report shows a sharp increase in skill mismatches
after the crisis (p. 76).
(24) Population projections suggest that the working–age
population would shrink by 4.9% over the period 20132020 and a further 14.6% over the period 2020 to 2060
(Ageing Report 2015). Active population aged 25-54
already declined by more than 200 000 people between
2010 and 2014. Outward migration may have played a role.
While outward migration could have functioned as an
adjustment channel during the crisis, the loss of active
population will weigh on potential growth, unless Portugal
26
Real compensation per employee
Productivity
Source: European Commission
In addition, nominal unit labour costs adjusted
significantly. Also in this case, the adjustment was
more relevant after the crisis, after a period when
unit labour costs in Portugal grew significantly
faster than the euro area average (Graph 2.3.5).
During the period 2010-2012, unit labour costs
declined (see also Section 3.1).
succeeds in creating the conditions to attract the population
it lost due to emigration during the recent crisis.
( ) Between the first and the third quarter of 2014,
employment rose by 120,000 people. The number of
people in employment programmes rose from 65,900 in
January 2014 to 151,000 in September 2014 (85,000
people).
25
Graph 2.3.5: Nominal unit labour costs
135
130
increase in numbers of young people not in
employment, education or training (NEETs) is
particularly worrying. The skills composition of
the Portuguese labour market is a factor explaining
the very wide gap in value added per worker
between Portugal and the rest of the euro area.(26)
125
Graph 2.3.6: Gap between employment growth in the
tradable and in the non-tradable sectors:
2010-13
120
115
4
110
cumulative (%)
2
105
0
100
99 00 01 02 03 04 05 06 07 08 09 10 11 12 13 14
PT
-2
EA18
-4
Source: European Commission
-6
The adjustment carried out so far has increased
the share of employment in tradable sectors.
Between 2010 and 2013, employment growth in
the tradable sector outpaced that in the nontradable sector; indeed, the difference was the
highest among the euro area countries (Graph
2.3.6). However, these data also reflect the fact
that more jobs have been lost in the non-tradable
sector. Once employment has recovered, there will
be a need to assess whether labour has been
actually reallocated across sectors (see also Section
3.1).
The skills composition of the labour force
weighs on productivity and on the reallocation
of labour to higher value-added sectors. In 2008,
low-skilled workers accounted for some 68% of
total employment, compared with a euro area
average of just 27% (Graph 2.3.7). The proportion
of highly skilled workers has since increased,
owing to rising workforce education levels and
higher unemployment rates among low-skilled
workers. In 2014, low-skilled workers accounted
for 50% of the total (against a euro area average of
about 21%), while the share of highly skilled
workers in the labour force rose to 25% (7
percentage points below the average in the euro
area). The share of middle-skilled workers remains
relatively low. That underlines the importance of
quality and attractiveness of vocational and
educational training as well as the prevention of
early school leaving. In this regard, the recent
-8
-10
-12
LV MT EE BE FI LU CY FR AT IT SI DE SK LT EL NL IE ES PT
(1) The tradable sector comprises: i) agriculture, forestry
and fishing; ii) industry (excluding construction); iii)
wholesale and retail trade, transport, accommodation and
food service activities. The non-tradable sector comprises:
i) construction; ii) financial and insurance activities; iii) real
estate activities; iv) professional, scientific and technical
activities; v) administrative and support activities; vi) public
administration, defence, education, human health and
social work activities; vii) arts, entertainment and
recreation; other service activities; activities of household
and extra-territorial organizations and bodies.
Source: European Commission
Job-matching has become less efficient during
the crisis, but shows signs of improvement. The
estimated Beveridge curve (Graph 2.3.8), plotting
the unemployment rate against the job vacancy
rate, has shifted outwards since 2008. In particular
it showed a significant leap after the end of 2011,
indicating less efficiency in job-matching (both
unemployment and the number of job vacancies
rose), along with a general deterioration of labour
market indicators. However, the situation seems to
(26) Varga et al. (2013), 'Growth effects of structural reforms in
Greece, Italy, Portugal and Spain', European Economy,
Economic Papers 511, show that decreasing the share of
low-skilled workers and increase the share of high-skilled
workers can contribute substantially for GDP growth in
Portugal.
27
have been improving since the end of 2013, as the
unemployment rate has started to decline alongside
a roughly constant job vacancy rate.
Graph 2.3.7: Employment by education level
80
%
70
60
50
40
30
20
10
0
08
14
08
PT
14
EA-18
ISCED 0_2
ISCED 3_4
ISCED 5-8
(1) ISCED 0_2: less than primary and lower secondary
education; ISCED 3_4: upper secondary and postsecondary non-tertiary education; ISCED 5_8: tertiary
education.
The proportion of employees on temporary
contracts remains high, although a substantial
share of new contracts are being concluded on a
permanent basis. Legislation enacted during the
Programme aimed at aligning incentives for
employers to hire on open-ended contracts for
permanent posts. The share of fixed-term contracts
has dropped during the crisis, as they are the first
to be hit by economic downturns. More recently,
with rising employment, the share of people on
temporary contracts has risen again (Graph 2.3.9).
Nonetheless, a very significant fraction of
employment is being created on permanent
contracts, which could be evidence of an improved
balance in employment protection between
permanent and fixed-term contracts. An effective
reduction in labour market segmentation could
contribute to enhance labour productivity. In
addition, the share of self-employed people
without employees in total employment fell,
possibly indicating lower use of self-employment
contracts in situations where work is being done by
employees.
Graph 2.3.9: Temporary employmen tand selfemployment
Source: European Commission
25
Graph 2.3.8: Beveridge curve
23
21
Job
vacancy
rate
0.50
0.45
19
13Q4
0.40
%
17
09Q4
15
0.35
10Q4
08Q4
13
0.30
11
0.25
9
12Q4
0.20
08Q1
11Q4
09Q1
10Q1
11Q1
12Q1
13Q1
14Q1
Self-employment (without employees)
0.15
Temporary employment (% employees)
0.10
5
10
15
20
(1) Self-employment as a proportion of total employment.
Source: European Commission
Unemployment rate (%)
(1) Job vacancy rate = total number of vacancies/ (total
number of vacancies + total employment).
Source: European Commission
28
The labour market needs to support the
economy's adjustment challenges. Substantial
adjustment needs remain: (i) the employment rate
is a long way below the 2008 peak and there is a
risk of unemployment stabilising at high levels,
given the low growth and the increase in labour
market mismatch, reducing potential growth and
entailing a negative impact in terms of poverty and
social exclusion; (ii) the external adjustment
carried out so far needs to be sustained, given the
sizeable level of negative net foreign assets.
Portugal implemented a comprehensive labour
market reform agenda during the economic
adjustment programme. To encourage job
creation in open-ended contracts and address
duality, severance payments for permanent
contracts have been reduced, while the definition
of fair dismissals has been eased. Working time
has become more flexible to contain employment
fluctuations over the cycle, accommodate
differences in work patterns across sectors and
firms better, and enhance firms’ competitiveness.
To facilitate wage adjustment, measures have been
taken to increase scope for bargaining at firm
level. Unemployment insurance benefits have been
revised to increase incentives for a rapid return to
work, while guaranteeing a sufficient level of
protection and easing eligibility. Active labour
market policies have been streamlined to make
them more effective in supporting job creation,
strengthening activation and providing more
effective training opportunities. The remainder of
this chapter provides an overview of the most
recent measures.
Three measures have been taken recently in the
area of collective bargaining, but not all of them
favour the alignment of wages and productivity
at firm level. Law 55/2014, adopted on 25 August
2014, encompasses two measures. First, it reduces
the survival of collective agreements that have
expired and not been renewed; second, it
introduces the possibility of temporarily
suspending sectoral collective agreements at firm
level. The reduction of the survival period of
expired collective agreements, by curbing
automatisms in their renewal, has the potential to
induce
greater
dynamism
in
collective
bargaining.(27) The possibility of temporarily
suspending sectoral collective agreements might
make contractual adjustment more flexible at firmlevel, but it requires the intervention of the original
signatories of the sectoral agreement, which is
(27) The changes in the survival regime reduced the duration of
collective agreements after their expiration from 18 months
to one year. In addition, the law reduced from five to three
years the time needed for a collective agreement that make
its expiry depend on the existence of a new agreement to
enter in a period of survival.
likely to limit its effective application.(28) A third
recent additional legislative measure alters the
criterion for extending(29) collective agreements.
According to this measure, a decision to extend an
agreement no longer has to take into account the
representativeness of signatories in the sector, as
was required since 2012. A less stringent criterion
based on the composition of signing employers'
associations has been introduced instead.(30) The
consequent potential renewed generalisation of
extensions of collective agreements is likely to
hinder efficient wage adjustment at firm level.
During the crisis collective bargaining has
declined substantially. The number of sectoral
collective agreements fell from 172 in 2008 to 36
in 2012, while the number of extensions fell from
137 to 12 in the same period. Firm-level collective
agreements also declined considerably (Graph
2.3.10). The number of employees covered by
collective agreements fell from almost 1.9 million
in 2008 to some 225,000 in 2014. These
developments show the difficulty social partners
were facing in reaching agreements during the
crisis. However, collective bargaining is slowly
picking up. Differentiation of wages, including a
broader scope for adjusting wages at firm level, is
necessary in order to facilitate job creation in the
tradable sectors and to avoid a situation where the
burden of adjustment falls entirely on new
contracts. In this regard, scarce diffusion of work
councils poses a limit to the take-up of firm-level
bargaining.(31)
(28) According to PT authorities, this requirement is justified in
view of the Constitution, which attributes the worker
representation’s monopoly to trade unions.
(29) That is to make collective agreements legally binding for
all employees and employers in a certain sector.
(30) In May 2011, the government temporarily suspended the
common practice of extending sectoral collective
agreements to all firms in the sector. In November 2012, it
introduced a quantitative criterion for extensions of
collective agreements which established that sectoral
collective agreements could be considered for extension
only if the employers' associations' signing the agreements
employed at least 50% of workers in the sector. In June
2014, a new legislative change made extension possible if
SME's accounted for at least 30% of the employers'
associations signing the agreement.
(31) Firm-level collective agreements prevail over higher level
agreements, as no favourability clause exists. However, the
number of collective agreements at firm level is limited.
Various measures have been taken to boost firm-level
bargaining or the adaptability of sectoral collective
agreements at firm-level: (i) the 2009 Labour Code
revision introduced the possibility for unions to delegate to
29
Graph 2.3.10: Number of collective agreements and
workers covered
2,000
600
1,800
500
1,600
1,400
400
1,200
1,000
300
800
200
600
400
100
covered by the minimum wage rising from 5% in
2005 to 12.9% in 2014. That proportion reaches
21% in the accommodation and food service
activities sector and in the other service activities
sector. The expected immediate effects of the latest
increase on employment and competitiveness are
relatively small. A continued monitoring of the
possible effects on the employment prospects of
the most vulnerable groups is envisaged.(33) At the
same time, this measure contributes to preserving
labour incomes for those at the bottom of the wage
scale.
200
0
0
00 01 02 03 04 05 06 07 08 09 10 11 12 13 14*
Oct
Sectoral
Group of firms
Firm-level
Extensions
Workers covered (rhs)
Source: MSESS - DG for Employment and Industerial
Relations
Graph 2.3.11: Nominal compensation per employee and
the minimum wage
140
index 2006=100
130
120
110
Having been frozen during the economic
adjustment programme, minimum wages were
raised in October 2014. During the programme,
the minimum wage would have been raised only if
justified by economic and labour market
developments. This implied its freeze during the
programme. The Council of Ministers decided in
September 2014, following an agreement with
social partners, and effective from October 2014
until December 2015, to increase the monthly
minimum wage (paid 14 times per year) from EUR
485 to EUR 505 (i.e. by 4.1%) and to cut
employers' social security contribution (TSU) for
workers already receiving the minimum wage by
0.75pp. to 23%.(32) Despite the freeze in recent
years, the minimum wage has risen significantly
faster than the average wage in nominal terms
since 2008 (by 18.5% vs. 3.5% between 2008 and
2014, see Graph 2.3.11). Consequently, it became
more binding, with the proportion of workers
works councils the possibility of concluding firm-level
collective agreements in firms employing 500 or more
workers; (ii) the 2012 Labour Code revision lowered the
threshold for delegation to 150 workers; (iii) the 2012
Labour Code revision also introduced the possibility of
sectoral collective agreements setting the conditions under
which the agreement could be changed at firm level. No
use has ever been made of these options.
32
( ) A detailed description of the recent developments relating
to the minimum wage in Portugal can be found in: 'PostProgramme Surveillance for Portugal', European Economy.
Occasional Paper 208, December 2014, pp. 32-34.
30
100
90
80
70
60
95 96 97 98 99 00 01 02 03 04 05 06 07 08 09 10 11 12 1314f
Compensation per employee
Minimum wage
Source: European Commission
(33) Two empirical studies produced in 2011 found (small)
negative employment effects of the increases in the
minimum wage between 2006 and 2011, before the latest
package of labour market reforms: Carneiro et al. (2011)
'Estudo sobre a Remuneração Mínima Mensal Garantida
em Portugal – Relatório Final'; and Centeno et al. (2011),
'The Impact of the Minimum Wage on Low-wage Earners',
Banco de Portugal – Economic Bulletin. Further
information and data can be found in a report produced by
the Ministry of Economic Affairs and Employment at the
end of 2012 (available at http://www.portugal.gov.pt/pt/osministerios/ministerio-da-economia-e-doemprego/documentos-oficiais/20121216-salario-minino2013).
The reform of the employment protection
legislation implemented during the economic
adjustment programme eased the definition of
dismissal
based
on
redundancy
and
unsuitability and lowered severance payments.
Severance payments for open-ended contracts
were cut from 30 to 12 days per year of work. For
temporary contracts, severance payments were cut
from 36 (or 24 for contracts longer than 6 months)
to 18 days during the first three years of the
contract. One of the objectives of this reform was
to align incentives for employers to hire on an
open-ended contract for permanent posts, reducing
segmentation. Continued monitoring of the impact
of this reform is needed to analyse both job
creation involving permanent contracts and
transition rates from temporary to permanent
contracts. Aggregate data show a decline in the
share of temporary employment during the crisis,
explained by more intensive job shedding among
temporary contracts. More recently, the proportion
of temporary contracts is rising with the growth in
employment. As the macro data hide labour market
flows, detailed analysis is needed, based on data on
employment creation by type of contract.
During the economic adjustment programme,
Active Labour Market Policies (ALMPs) were
streamlined to make them more effective in
supporting job creation, strengthen activation
and offer more effective training opportunities.
Over the same period, the Public Employment
Services (PES) were also reformed to improve
their efficiency. In January 2015, Portugal adopted
a new framework law for employment policy,(34)
which aims at further rationalising the set of
ALMPs and the role of PES, as well as at
establishing the principle of systematic evaluation
of the different ALMP programmes in the
Standing Committee for Social Dialogue. Portugal
continues to make progress in this area. Overall,
the total number of unemployed people covered by
employment measures(35) rose from 141,335 in
2013 to 205,247 in 2014, while numbers of
participants in training measures, according to
(34) Decree-Law No. 13/2015, 26 January 2015
(35) Employment measures such as hiring incentives and
traineeships were aggregated in two groups: "Stimulus
Employment
Programme";
and
"Employment
Traineeships", making it easier for the unemployed to
know which measures are available. Short term trainings
targeted at employability created in 2013 - "Transversal
Training" module and "Vida Ativa" measure – have
increased their implementation in 2014.
IEFP data, went up from about 466,547 to 524,821
in the same period. ALMPs seem to have played a
key role in reducing unemployment over the past
year with a 25% increase in the number of
placements, from 84,402 in 2013 to 105,518 in
2014. However, the measures need careful
monitoring to ensure that they are effective. In
particular, transition rates from employment
subsidies into regular employment need to be
analysed, as already happens with traineeship
measures. The same applies to the effectiveness of
the training programmes in making the groups
concerned more employable.
Despite improvement throughout the Public
Employment Services (PES) reform, the PES
caseload remains very heavy. Efficiency can be
improved further by taking a bolder approach to
the digitalisation of services, including automated
matching, and by further specialising staff to deal
with more difficult cases. In addition, the PES's
role - in profiling, providing appropriate job
counselling and job search assistance, and
enforcing sanctions where job search requirements
have not been met - needs ongoing monitoring.
The diploma(36) which frames the cooperation
between public and private employment services
has been approved and there are plans for two pilot
projects involving of partnership between the
public and private employment services.
Measures have been taken to fight the upsurge
of youth unemployment and NEETs, notably
through the implementation of the Youth
Guarantee (YG). Implementation of the Youth
Guarantee started on 1st January 2014 and
progress is underway. Between March and
December 2014, 67,317 people aged under 30 and
not in employment, education or training (NEET)
took part in measures classed as a 'Youth
Guarantee quality offer' once they had been
registered by the Public Employment Services for
a maximum of four months. These included, on the
basis of IEFP data, work placements, vocational
training and traineeships.
(36) Decree-Law No. 13/2015, 26 January 2015
31
Portugal is making substantial efforts to put the
Youth Guarantee into practice(37) and involve
all
relevant
governmental
and
nongovernmental partners in implementing it. The
PES – Youth Guarantee Coordinator Entity – is
conducting awareness-raising campaigns to
involve partners better able to reach out to young
people not in employment, education or training,
namely NGOs and social institutions. An IT Youth
Guarantee platform has been set up to enable
monitoring of the young people benefitting from
the programme. In spite of these progresses, there
are substantial challenges to be addressed,
including the PES' capacity as Youth Guarantee
coordinator to engage the Youth Guarantee
network's various partners, and the need to reach
all non-registered NEETs. Additionally, there is
little evidence that future skills needs are identified
before youth guarantee offers are designed.
(37) Two new measures, covered by the Youth Guarantee
Implementation Plan, were adopted in July 2014: Active
Youth Employment Programme (offering socioprofessional integration of young people with low
qualifications and furthest from the labour market, within a
work project of limited time duration) and Investe Jovem
Programme (a financial and technical support granted to
young unemployed, between 18 and 30 years old, who
present a viable business idea). The Retomar programme,
another new measure, consists of a yearly financial support
for students who have dropped out of education, providing
incentives for them to complete their studies.
32
3.
OTHER STRUCTURAL ISSUES
3.1. TAXATION, FISCAL FRAMEWORK AND OTHER FISCAL
STRUCTURAL POLICIES
Taxation
The tax policies adopted recently imply a slight
shift towards a more growth-friendly tax
structure. Under the 2015 budget, the corporate
income tax (CIT) reform initiated in 2014 is to be
continued by cutting the standard rate by a further
2 percentage points. The CIT reform was designed
to promote competitiveness and investment, to
help make Portuguese companies more
international and to simplify the complex CIT
system. It also addressed the high debt-bias in
corporate taxation by strengthening the limits for
the deductibility of net financial expenses. The
burden-reducing reform of personal income tax
introduced in 2015 is designed to address
demographic issues (e.g. by introducing a family
quotient system and reforming tax credits for
family expenses), simplify the taxation system
(e.g. by introducing simplified pre-filled tax
statements) and help entrepreneurs (e.g. by
reducing their taxable income during the first two
years of activity, to help start-ups). In parallel, the
green taxation reform is designed to help promote
a more sustainable economic development model.
New green taxation measures include raising the
rate of tax on the purchase of polluting vehicles,
depending on CO2 emissions, and introducing a
tax on plastic bags. The additional revenue raised
by this green taxation reform is to be allocated to
reduce the tax burden on labour (i.e. assumed
revenue-neutrality of the above-described personal
income tax and the green taxation reforms). Higher
revenue is also expected in 2015 from recurrent
property taxation (from the non-continuation of a
safeguard clause that impeded too sharp increases
in the property tax bill), while the transaction tax
has not yet been phased out. Some excise duties
and indirect taxes (e.g. on tobacco) will also rise
under the 2015 budget. Overall, these reforms
mark some progress towards the goal of improving
the growth-friendliness of the tax structure. The
scope for further shifting taxation towards less
distortionary taxes should be explored on the basis
of a comprehensive evaluation of recent tax
reforms. The yields from a relatively growthfriendly but little used source, such as inheritance,
estate and gift taxes, could be improved.
The action taken by Portugal in recent years to
broaden its VAT base and improve VAT
efficiency needs to be assessed. The country has
34
reduced the scope of application of reduced and
intermediate rates.(38) Although the VAT policy
gap was estimated at 52% for 2009-2012 (the
arithmetic average for the EU is 41.4%,(39) the
indicator may not yet reflect the base-broadening
measures introduced in 2011 and 2012. Instead of
introducing further legal changes, Portugal could
consider comprehensively assessing whether
efforts to broaden the VAT base have actually
made the VAT system more efficient.
The full budgetary and economic impact of
recent tax reforms will need to be monitored. In
particular, close attention should be paid to
ensuring that the personal income tax and green
taxation reforms are implemented budgetneutrally. The impact of these reforms on the
progressive nature of the tax system must also be
closely monitored, as there is a risk that highincome households may benefit more than lowincome households. The impact of the green
taxation reform on the Portuguese economy should
also be closely monitored, to make sure that
competitiveness and investments are not adversely
affected. The impact of the CIT reform on
productive investment and on the high level of
corporate debt (as detailed in section 3) is a key
issue for the Portuguese economy. In 2014, the gap
between the effective marginal tax rate on
investment financed with equity and debt in
Portugal was still one of the highest in the EU.(40)
The CIT reform included a number of measures
designed to boost investment, such as revamping
the R&D tax credit (SIFIDE II) and extending the
carry-forward period for tax losses from 5 to 12
years. Portugal lags behind the EU average as
regards gross domestic expenditure on R&D (1.4%
of GDP in 2013) and it had a foreign direct
investment inflow of only 1.4% of GDP in 2013.
Effectiveness of the patent box system also needs
to be monitored.
(38) Electricity and natural gas were shifted from the reduced
rate (6%) to the standard rate (23%) in late 2011;
foodstuffs and restaurants have been taxed at the standard
rate (23%) since 2012, having previously been subject to
the intermediate rate (13%). VAT rates for cultural services
and sporting events were also raised in 2012.
(39) '2012 Update Report to the Study to quantify and analyse
the VAT Gap in the EU27 Member States', p. 64:
http://ec.europa.eu/taxation_customs/resources/documents/
common/publications/studies/vat_gap2012.
40
( ) ZEW (2014), 'Effective tax levels using Devereux/Griffith
methodology', Project for the European Commission.
Portugal has continued to improve tax
compliance and combat tax evasion by making
the tax administration more efficient. Over the
past few years, the country has been investing in
tax-related IT systems, such as the e-invoice
system, which has proven successful in improving
tax compliance and yielded significant additional
revenue. According to available statistics, around 9
billion invoices were registered and communicated
to the tax administration in 2013-2014, with a 10%
increase in the last year over 2013. The resources
allocated to auditing have also been increased with
the recruitment of 1,000 additional tax auditors.
The 2015 budget announced further measures to
increase efficiency in curbing tax fraud and
evasion, including the reinforcement of the Large
Taxpayer Office and the recently adopted 20152017 Strategic Plan to combat tax and customs
fraud and evasion. Some of these measures mainly
imply further exploiting the potential of einvoicing and the unified monthly returns, by
strengthening existing procedures and better crosschecking all relevant information. Other recent
measures (e.g. the mandatory communication of
inventories for taxpayers with turnover above EUR
100,000) can also be fairly effective, especially
those targeting sectors where fraud is likely to be
high, such as the rental market. Overall, given the
high reliance of the revenue projections
underpinning the budget on yields from anti-fraud
measures,
implementing
these
measures
effectively is a top priority. For the plan to be
effective in yielding additional revenue, critical
capacity must be developed within the tax
administration to handle the vast amount of
relevant data gathered through the e-invoice
system.
The revenue administration needs to pursue its
reform agenda, and more must be done to
improve taxpayer compliance. Organisational
reforms are under way in the tax administration,
including the planned integration of local tax
offices into the Aproximar programme, the
progress made by the Risk Management Unit, and
the recently created Taxpayers' Services
Department. Yet there is ample scope for further
reforms to modernise the revenue administration
and further improve taxpayer compliance. These
include more efforts to combat tax fraud in the
housing market, improving information-sharing
arrangements with financial institutions, and
strengthening
the
anti-money-laundering
framework. Interaction between the judicial system
and tax collection also remains an issue, with a
high level of litigation, whereas a high level of
undisputed tax debt as a percentage of the annual
net revenue collection remains. The special task
forces of judges assigned to tribunals dealing with
high value cases are no longer in place. Although
some efforts have been made to increase the
availability of IT systems, and thresholds for tax
appeals have been raised so as to reduce the
burden on the tax courts, the present situation
suggests that a more thoroughgoing reform of
litigation procedures for taxation is needed.
Fiscal framework
The reform of the Budget Framework Law and
other Public Financial Management reforms
will further improve the domestic fiscal
framework. The proposed Budget Framework
Law reform, based on an analysis of outstanding
fragilities in the system and recommendations by
relevant stakeholders, is designed to: improve the
formulation of numerical fiscal rules; streamline
budget
appropriations;
reduce
budget
fragmentation, which remains high; make the
various budget units more accountable; improve
the budgetary cycle calendar and strengthen the
medium-term budgetary framework, which
includes defining more stringent expenditure
ceilings. Technical complexities have delayed the
reform process by comparison with initial plans,
and the legislation is now expected to be put in
place in the first quarter of 2015. Once the
legislative process is completed, the focus should
move to implementation under the strong
leadership of the Ministry of Finance. Another
major improvement in the fiscal framework is the
recently concluded reform of the Commitment
Control Law (CCL), which should further
strengthen discipline and budgetary control and
prevent any new accumulation of arrears.
Efforts should continue to improve The
accounting and reporting framework needs
further improvement. The October 2014 IMF
Fiscal Transparency Evaluation(41) identified
further challenges to be met to achieve advanced
levels of fiscal transparency and suggested that
Public Financial Management be strengthened
further. The Ministry of Finance and the standard(41) IMF Country Report No 14/306, October 2014.
35
setting body are preparing a new public-sector
accounting framework based on internationally
accepted standards. Following public consultation,
the plan is to submit the project for Government
approval and draft the implementation manual in
2015, while practical implementation will extend
into 2017.
Challenges related to structural-fiscal policies
in the fields of pensions and the health system
The budgetary impact of population ageing poses a
challenge to Portugal's medium and long-term
sustainability, especially as regards pensions and
healthcare policies. A challenge in these areas was
identified in the 2014 European Semester (CSR1).
Pensions
Portugal's recent pension reforms have made
the system more financially sustainable, but the
impact on future pension adequacy is less
certain. According to ESSPROS data, pension
expenditure rose from 11.3% of GDP in 2007 to
13.9% of GDP in 2012 (EU-28 in 2012: 12.8%).
The recent reform measures were designed to cut
pension system costs in the short, medium and
long term. Measures to improve the financial
situation of the pension system include suspending
pension indexation (except for the lowest benefits);
introducing disincentives to early retirement;
cutting the highest pensions; raising the
pensionable age from 65 to 66 for both sexes, and
linking future increases to life expectancy at age
65. Updated calculations of ageing costs based on
the reform measures and the latest available
demographic projections will be made available in
the first half of 2015.
Lower
pensions
have
been
protected
comparatively well during the crisis. Between
2011 and 2012 (last data available from the
Institute for Social Security), the average annual
old-age pension (all schemes included) fell from
EUR 4,907 to EUR 4,748. There are substantial
differences between the average pension
entitlements of (i) men and women; and (ii)
pensioners under the general statutory scheme and
the scheme for public employees (CGA, now
closed).(42) Overall, however, the economic crisis
(42) According to Bettio et al. (2013), women's mean monthly
pension income in Portugal was EUR 512, compared with
36
has affected pensioners' income less than that of
the rest of the population. The median relative
income ratio rose from 92% to 94% between 2012
and 2013 (EU-28: 93% in 2013), showing
convergence between the median equivalised
disposable income of the over-65s and that of
persons up to the age of 64.(43) Further, recent
trends in poverty and social exclusion among the
elderly suggest that the incomes of the most
disadvantaged have been relatively well protected
during the crisis (see Section 3.2).
In the medium and long run, the adequacy of
pensions will crucially depend on longer and
less interrupted working lives for both men and
women, given that the Portuguese population is
set to age substantially over the next few
decades. Based on Eurostat data, the old-age
dependency ratio is expected to increase from
29.4% in 2013 to 63.9% in 2060 (EU-28 in 2060:
50.2%), posing a threat to both the adequacy and
the sustainability of the pension system. The
labour market participation of older workers,
however, has tended to fall over the past decade.
The employment rate of men aged 55 to 64 fell
from 62.1% in 2003 to 58.5% in 2008, and a low
53.2% in 2013 (EU-28 in 2013: 57.5%), while the
employment rate of older women has stagnated
slightly above 40% (EU-28 in 2013: 43.3%).
Currently, only 4.1% of 55-64-year-olds are
engaged in life-long learning. There are hiring
incentives in place that target unemployed people
over the age of 45.
The rise in the legal retirement age and the link
with changing life expectancy in the future is
expected to improve the medium-term
sustainability of the pension system. The fact
that the mechanism is automatic makes the pension
system more transparent and may also signal to
individuals and to the social partners that
retirement practices must change. If pensions are
to cover pensioners' needs, people will need to
EUR 766 for men. According to the Social Security
statistics and the CGA annual report for 2012, average
monthly pensions under the general statutory scheme and
the CGA were EUR 402 and EUR 1287 respectively.
43
( ) This relative improvement in the income situation of the
elderly may be explained by shrinking wage incomes,
rather than by any actual improvement in pensioners’
incomes.
retire later in the future.(44) This is why the recent
pension reforms must be accompanied by
measures to incentivise longer working lives,
support the employability of older workers, and
allow for a more gradual transition from work to
retirement.
Health system
The Portuguese health system faces a fiscal
sustainability challenge as, according to the 2012
Ageing Report, public health expenditure is
projected to rise more than the EU average.(45) In
2012, health expenditure accounted for 9.5% of
Portugal's GDP. Portugal has one of the lowest
shares of public expenditure in total health
spending (63%, compared with the EU average of
73%). Out-of-pocket payments as a share of total
health expenditure increased between 2007 and
2012 by 4.5 pp (the highest increase in the EU).
The fact that some 14% of the population have no
family doctor continues to pose problems. Waiting
times for selected types of planned surgery
lengthened between 2010 and 2013, reversing the
previous trend and confirming the recent rise in
unmet medical needs. This indicates that there is a
need to step up efforts to maintain existing levels
of access to healthcare.
Health system reforms in Portugal continue to
produce results. Hospital-sector reforms and cost
optimisation have contributed in recent years to
savings in the healthcare sector. Arrears in the
hospital sector remain a challenge, although they
have been significantly and steadily reduced since
2012. Total debt was reduced by EUR 150 million
in 2014, and EUR 250 million are still available
from the equity injections in state-owned hospitals
earmarked to further reduce the stock of arrears
during 2015 (around EUR 560 million, in
December 2014). The National Health Service
budgets for 2015 and 2016 will probably include
significant increases in staff costs, as there are
plans to reverse public officials' wage cuts.
However, the 2015 budget is still set to cut overall
(44) The
2015
Pension
Adequacy
Report
(forthcoming) provides a projection of replacement rate
levels for 2053, pointing to a fall from 92.3% of average
earnings in 2013 to 79.5% in 2053; for low earners (66% of
average wage) the fall is steeper, from 90% to 77.6%.
(45) These projections will be updated in the first half of 2015
when the new Ageing Report 2015 is published.
health
spending,
showing
commitment to reform.
a
continuing
Progress has been made on hospital reform and
other healthcare-related reforms. A report on
establishing reference centres has been adopted,
and the Portuguese authorities are in the process of
reclassifying hospitals, an important task.
Centralised procurement continues to save the
National Health Service money. Generics eligible
for public reimbursement in the outpatient sector
have continued to expand their market share,
resulting in less spending on medicines. Similarly,
spending on pharmaceuticals can be cut by
negotiating pharmaceuticals prices with the
industry. The new role of Family Nurse should
improve prevention and health promotion in
Primary Care Centres. The authorities have also
launched initiatives to increase and incentivise the
supply of health professionals in areas where
access to healthcare is particularly problematic.
Other fiscal-structural policies
Thanks to the restructuring of operations in
state-owned enterprises (SOEs), their operating
performance continued to improve in 2014. A
further EUR 309 million was allocated to stateowned hospitals to halt new arrears, improve their
operating balance and provide additional
healthcare services. The 2015 budget provides for
state-owned hospitals to reach an operating
balance on their own in 2015. As with transport
sector SOEs, the restructuring of operations that
started during the Programme continued
throughout 2014. The adjusted EBITDA is close to
positive for the third year in a row. The operating
improvements, mainly stemming from a general
rise in commercial revenue, combined with further
personnel cost compressions (despite the
Constitutional Court ruling) have more than offset
the drop in public compensation of EUR 50
million (from the 2013 level) or EUR 250 million
(from 2010). Downsizing continued successfully in
2014, with some 3,400 jobs shed by comparison
with 2010 levels.
Mergers of several SOEs and urban passenger
transport concessions continued in 2014 and
will be concluded this year. The mergers between
the railway (REFER) and the road (EP)
infrastructure operators, and between the water and
sewerage branches of Águas de Portugal are
37
progressing. As regards the latter, the consultation
of the municipalities involved in the merger of 19
companies into 6 was concluded. The legislative
process will follow and is expected to be finished
during the first half of the year. The urban
transport concessions in Porto are expected to
close in January, bringing about EUR 150 million
savings to the public exchequer during the 10-year
length of the contract. Similarly, the Lisbon
services are to be put out to tender at the beginning
of February, just after the public service obligation
(PSO) contracts have been finalised. It is expected
that contracts will be awarded by the end of the
second quarter of 2015. The purpose of the tender
is to further cut that part of taxpayers' costs that
relates to public compensation.
Public-private partnership relating to roads
saved more money than expected in 2014.
Savings from renegotiating concessions, lower toll
collection costs, fewer financial rebalances, and
more toll revenue resulted in savings of over EUR
370 million in relation to the base case, exceeding
the latest Government forecast by 10%.
Privatisations continue with a view to freeing
additional capital and refocusing SOEs on their
core business. Taking advantage of improved
financing conditions for the sovereign, the
Government began to refinance bank loans of
SOEs inside the general government and outside it
(notably CP, Carris, STCP, Parque Expo,
Empordef and EDIA), as their debt has matured to
replace the more expensive bank loans by cheaper
Treasury funds. The Treasury covered EUR 5.7
billion of SOEs' financing needs in 2014, thereby
alleviating their interest burden. To further
strengthen the financial position and refocus
several SOEs on their core business, the plan to
privatise some subsidiaries is being pursued,
including EGF, CP Carga, EMEF and Carristur.
Given the TAP airline's need for an equity
injection, the Government relaunched a
privatisation process after a failed attempt in 2012.
These privatisations are all expected to be
concluded by mid-2015.
Public administration reforms designed to
improve the efficiency and quality of public
expenditure have continued, but more slowly
and with a smaller budgetary impact than
initially expected. Employment in the public
administration is expected to continue falling,
38
mainly through attrition, but probably at a much
slower rate than in recent years. The termination of
fixed-term contracts, the implementation of the
requalification scheme and the termination of
contracts by mutual agreement are contributing
much less to reductions in the number of jobs than
previously planned. The introduction of the single
wage-scale and the single supplement-scale in
2015 will make the remuneration system fairer and
more transparent, but is not expected to save any
expenditure.
3.2. SOCIAL POLICIES
Portugal experienced a sharp increase in
poverty and social exclusion in 2013. The
number of people living at risk of poverty or social
exclusion increased by 210,000 between 2012 and
2013, making it more difficult to reach the national
2020 target. The increase in the percentage of
people at risk of poverty or social exclusion was
the highest in the EU (2.1 p.p. from 25.3% in 2012
to 27.4% in 2013). Severe material deprivation
increased by 2.3 p.p., affecting 10.9% of the
population in 2013. The poverty gap for the
working age population(46) stood at 31.2% in
2013, marking the second largest increase in the
EU compared to beginning of the crisis.(47)
The increasing levels of poverty and social
exclusion have been affected by the rising levels
of unemployment up to 2013. The sharp increase
in
both
unemployment
and
long-term
unemployment translated into worsening poverty
indicators. Between 2008 and 2013, the share of
low work intensity households increased by 5.9
percentage points (the fourth largest increase in the
EU), while the number of jobless poor (at risk of
poverty and living in low work intensity
households) reached 564,000 in 2013.
A weakened social protection system and policy
measures adversely affecting disposable income
had a negative impact on the social situation.
The impact of social transfers (excluding pensions)
in reducing poverty decreased by 2.5p.p in 2013
(26.7% in 2013 compared with 29.2% in 2012),
suggesting that the inadequate social protection
system was unable to cope with the sudden rise in
joblessness and the consequent increase in poverty.
Additionally, some of the recent policy measures
had a negative impact on disposable income. Cuts
in non-pension benefits disproportionately affected
the very poor (bottom decile). Policy changes also
adversely affected children under the age of 10.(48)
(46) The poverty gap is defined as the difference between the
median equalised total net income of people below the atrisk-of-poverty threshold and the at-risk-of-poverty
threshold, expressed as a percentage of the at-risk-ofpoverty threshold. It gives an idea of the severity of
poverty for those experiencing it.
(47) The increase amounted to 7.6 percentage points with
respect to 2008.
(48) See De Agostini et al. (2014), 'The effect of tax-benefit
changes on the income distribution in EU countries since
the beginning of the economic crisis', EUROMOD
Working
papers
9/14.
Households
with
children
have
been
particularly affected by poverty and social
exclusion, also owing to a reduced impact of
family benefits and social transfers.(49) In 2013,
children were at greater risk of poverty or social
exclusion than the rest of the population – 31.6%
against 27.4% of the overall population – and
Portugal had the largest increase in the EU. These
figures follow a major reduction in childcare
benefits, with two series of cuts implemented
respectively in November 2010 and January 2012.
Between October 2010 and August 2014, 591,971
beneficiaries lost access to child benefits, i.e. one
in every three beneficiaries. In total, the state
reduced spending for the support of families with
children by 30% between 2010 and 2011.(50)
Older people have been relatively sheltered
from the risk of poverty and social exclusion
during the crisis, although the incidence of
severe material deprivation has increased. The
proportion of over-65s at risk of poverty and social
exclusion decreased from 27.7% in 2008 to 20.3%
in 2013 (EU-28 in 2013: 18.3%). Since 2011,
however, the severity of poverty and levels of
severe material deprivation increased slightly in
this age-bracket.
While some measures were taken to protect the
most disadvantaged groups,(51) no key policy
changes have been implemented or planned
recently to ensure an adequate coverage of
social assistance. According to the most recent
national data, unemployed people not covered by
unemployment protection or by the minimum
income scheme (RSI) accounted for 47.9% of all
jobless people, on the basis of September 2014
https://www.iser.essex.ac.uk/research/publications/working
-papers/euromod/em9-15
(49) Decree-Law 133/2012.
(50) Baptista et al. (2014). Portugal Country Profile, European
Social Policy Network.
(51) The minimum pension was adjusted by more than the
inflation rate and the minimum wage was increased from
EUR 485 to EUR 505 in October 2014, contributing to
protecting lower pensions and low income earners. The
temporary 10% increase in unemployment benefits for
couples where both partners are unemployed and have
dependent children was maintained. Active Labour Market
Policies have been streamlined and take into account the
(re)integration of vulnerable groups in the labour market.
The Solidarity Complement for the elderly with low
pensions was also maintained, having a positive impact on
the lowest incomes of the elderly.
39
IEFP IP data. The unemployment benefit coverage
rate of the long-term unemployed dropped
significantly between 2010 and 2012 (from 39% to
26%), while slightly rising to 29% in 2013.(52)
Similarly, the coverage rate for the short-term
unemployed went down from 45% in 2010 to 39%
in 2012, then increasing to 41% in 2013.(53) The
figures on the Minimum Income Scheme show a
steady decrease since new rules took effect in July
2012. In October 2014(54) there were
approximately 207,000 beneficiaries, meaning that
nearly 131,000 people had lost their benefit
entitlement since June 2012 - over 38% of the
total.
(52) Commission services calculations based on the OECD tax
and benefit model.
(53) The slight increase in 2012-13 might reflect the reforms
introduced on unemployment benefits (reducing the period
necessary to become eligible) in 2012.
(54) Available at: http://www4.seg-social.pt/estatisticas.
40
3.3. EDUCATION AND VOCATIONAL TRAINING POLICIES
Portugal has undertaken a comprehensive
reform of its education system, but effective
implementation remains key to bring positive
outcomes. National and international assessments
show that students' performance level is stagnating
with a share of low achievers exceeding the EU
average.(55) The revision of curricula in primary
and secondary education and the definition of new
learning outcomes are expected to improve
students' performance in basic skills, such as maths
and Portuguese. However, it disregards several
cross-cutting key competences such as learning to
learn and entrepreneurial skills. Increased
autonomy for schools and the introduction of a
new funding formula based on schools'
performance encourages quality programmes. Inservice training for teachers is being addressed
through a new system of trainings and credits.
However, this critical part of the reform is
jeopardised by the lack of resources, trade union
support and social ownership.
Disparities in education performance and early
school leaving (ESL) linked both to the socioeconomic and migrant background of students
are high. PISA data show that equity in education
outcomes worsened significantly between 2003
and 2012. Grade retention is often used as
response to low performance, but has shown to be
inefficient and to increase the risk of ESL. The
new education monitoring tool should help
implement preventive actions by identifying
students at risk of school failure. Several initiatives
such as the TEIP (programme for schools in
socially vulnerable areas) have proven to be
efficient and the 2015 budget provides for extra
support for early childhood education and care
which should help mitigate social disadvantages at
an earlier stage. However, difficulties facing low
performers must be targeted and schools must be
helped to effectively develop quality programmes
if disparities are to be reduced.
Recent reforms are designed to upgrade the
vocational education and training system, but
making it more attractive is also a challenge. As
part of the strategy to address early school leaving
Portugal has introduced more, and more diverse,
(55) PISA 2012 results and Preliminary analysis of the 2013
national final exams: GAVE. Análise Preliminar dos
Resultados — Provas finais de ciclo: Exames finais
nacionais 2013.
vocational courses in secondary education, such as
the new basic vocational course for the 14-yearsolds, which offers new opportunities to students at
risk of retention. To upgrade vocational education
and training (VET) and make it more relevant to
the labour market, much more training is now at
the work place and specific indicators have been
introduced for monitoring the quality of
apprenticeships. The creation of the Centres for
Qualification and Vocational Education has also
helped boost VET enrolment rate. The new short
tertiary education cycle superior technical
professional courses (TeSP) aims at developing
close links with regional businesses; 94 courses are
registered covering a total of 2.775 students in 40
different locations. 65% of the existing TeSP focus
on business administration, ICT and services.
However, a shortage of funds is holding back
implementation. The same applies to the
professional schools of reference, the legal
framework for which was approved in April 2014,
but which have not been opened yet.
While tertiary educational attainment keeps
increasing the employment rate of graduates
has decreased significantly since 2008.(56) In
order to improve the skills synergies between the
education system, the labour market and economic
growth policies, the Ministry of Education is
working, together with the OECD and the
European Commission, on a National Skills
Strategy. A diagnosis report on how to improve the
quality and labour market relevance of education
outcomes is set to be presented during the first
quarter of 2015.
Portugal is making progress toward more
efficient and targeted public expenditure in
education. The reorganisation of the public
schools network, in tandem with the new funding
formula, if effectively implemented and
monitored, should help make more efficient use of
teachers and ultimately make education spending
more efficient, especially if the level of
performance is improved. The 2015 budget
foresees a 9.6% reduction of the education
spending in primary and secondary schools
compared with the 2014 estimate, mainly by
cutting the number of teachers engaged in non(56) According to Eurostat data, tertiary education attainment
rate increased 10 pp from 2008 to 2013 and employment
rate of graduates decreased 15 pp during the same period.
41
teaching activities. However, the capacity of the
teaching force to implement effectively new
quality programme deserves attention.
Portugal has made significant progress in
improving its education system but the upgrade
of its human capital and educational outcome
remains a challenge to ensure competitiveness
and growth capacity. Early school leaving and
disparities
in
performance
hamper
the
development of high level skills, and tertiary
attainment remains low(57) compared with other
EU countries. The shortage of digital skills in the
Portuguese population as a whole and in the work
force in particular(58) is a brake on performance in
the country's competitiveness in the digital
economy. Efforts to improve digital literacy and
regular internet use are necessary to promote
digital inclusion. Unemployment rates also show
that there is a need to make education and training
more adaptable and responsive to emerging needs.
Education should therefore remain high up on the
policy agenda over the coming years, as a major
driver of sustainable economic growth and
productivity.
(57) In 2014, the number of applications to higher education
rose for the first time since 2008 and the number of
students placed in vocational courses at polytechnic
institutes, increased by 18% compared to 2013. The
employment rate of graduates is well below the EU average
and only very marginally higher than that that of young
people having completed only lower secondary education.
(58) In 2012, over half (55%) of the Portuguese population had
low digital skills or none at all, and only 24% of
individuals were empowered with above basic digital
skills. As for the workforce, 48% of individuals had none
or low digital skills (39% in the EU). Only 1.7% of
employed people were ICT specialists, whereas the EU
average is 2.8% of ICT specialists in the workforce.
42
3.4. STRUCTURAL MEASURES TO IMPROVE COMPETITIVENESS
Reforms have been adopted in order to improve
competitiveness, increase flexibility and
improve the business environment, but further
action is needed in a number of areas. A wide
range of reform measures have been adopted to
alleviate nominal rigidities, facilitate adjustment,
reduce excessive rents and encourage the
reallocation of resources to the tradable sector.
Significant measures have also been taken to cut
red tape and make the judicial system more
efficient.
However,
significant
structural
weaknesses remain in key areas, including services
and regulated professions, public administration
and network industries (particularly energy and
transport). In addition, robust and systematic
monitoring and impact assessment tools are needed
to assess the impact of reforms.
The national competition and regulatory
framework has been improved, but actual
implementation must be carefully monitored.
The Competition Authority Decree Law, published
in August 2014, provides the Competition
Authority with a new financing model for 2015
and beyond. This will address the problem of
annual executive orders to provide funding for the
Authority on a one-off basis for each calendar
year. This financing model must be carefully
monitored, to ensure that it is appropriate and that
the Portuguese Competition Authority performs its
duties effectively. The range of transfers for which
the bylaws provide may not be sufficient to cover a
scenario of modest growth in and after, 2016, once
the public service salary cuts are progressively
reinstated and bearing in mind that important new
tasks will need to be carried out, including more
advocacy.
The national regulatory authorities' new
framework has not been fully implemented yet.
Under the economic adjustment programme, a new
framework law setting out the main principles
underpinning the functioning of the principal
national regulatory authorities (NRAs) and the
competition authority was adopted. Following this
adoption, the bylaws of the respective NRAs were
amended to reflect the principles of the new legal
framework. The bylaws concerning the Securities
Market Commission (CMVM), the Insurance
Regulator (ISP) were published at the beginning of
January 2015, while the Communications
Regulator (ANACOM) and the Civil Aviation
Authority (ANAC) were approved by the Council
of Ministers at the end of December 2014 and are
now awaiting for presidential promulgation and
publication. The Transport Regulator (AMT) is not
fully operational yet, despite the recommended
deadline of the end of September 2014, since
amended provisions, notably as regards directors'
cooling-off period, were only recently published to
ensure consistency with the framework legislation.
Reforms of Portuguese services markets and
regulated professions have yet to be completed.
For Portugal, the impact of barrier reductions from
the implementation of a sub-set of services
covered by the Services Directive will increase the
overall GDP by 0.8% in line with the EU 27
average.(59) Some important pieces of legislation
remained unchanged after the termination of the
macroeconomic adjustment programme, limited
progress has been made in aligning the outstanding
sector-specific legislation with the Service
Directive and there is no political will to amend
legislation on universities. Laws on construction
services and copyright collective management
societies are delayed in Parliament. In addition,
limited progress has been made towards improving
access to a number of highly regulated professions.
To this end, a framework law reforming
professional services governed by professional
associations was adopted in 2012 under the
programme, introducing rules and principles. This
was to be followed by amendments of the statutes
and internal rules of these professional bodies, to
bring them into line with the principles laid down
in the framework law. 18 such statutes needed
amendment. None of the 18 bylaws has been
approved yet: nine draft bylaws for highly
regulated professions are reportedly finalised but,
not yet approved by the Council of Ministers; the
remaining nine draft bylaws are experiencing
delays, mainly due to non-compliance with the
framework law for highly regulated professions
and with EU law.
The reform of the licensing regime continues to
progress but with experiencing some delay.
Limiting the number of procedures to follow and
the time and cost required to start a business is
important to achieve a competitive environment
(59) Monteagudo et al. (2012), 'The economic impact of the
Services Directive: A first assessment following
implementation', European Commission Economic Papers
456, June 2012, p.30. The 0.8% increase was estimated for
a reform effort until 2011.
43
for firms. The European Commission has
estimated the potential impact of changes in entry
costs between 2011 and 2014 on entry dynamics in
Portugal on the basis of its own calculations. The
predicted increase of the entry rate due to the
decrease in the cost to start a new firm would be
from 12.4% to 13.1%, whereas the potential
combined effect of the reduction in the number of
procedures needed to start a new business and in
the time needed to start exporting could increase
the Portuguese entry rate from 12.4% to 13.6%.
Licensing regimes are being streamlined to
establish the overall principle of ex-ante
declarations with ex-post control. The Portuguese
authorities have adopted some of the outstanding
decrees on licensing, particularly a new law on
commercial licensing, but a number of them are
delayed
Work is ongoing, although with some delay, to
reduce administrative burden. Authorities are
carrying out inventories of the most burdensome
regulations and drafting roadmaps to tackle them.
A first inventory was completed in 2014. Portugal
is to complete a new inventory by March 2015
which will cover sectors not addressed in the
former. Another key measure to reduce
administrative burden is the "one-in, one-out"
principle which was adopted in May 2014 but its
effective implementation is yet pending on the
approval of the relevant methodology. An InterMinisterial
Network
for
Administrative
Modernisation (RIMA), is expected to play a
pivotal role in beefing up the governance
framework for administrative simplification,
although its main focus is on the central
administration.
Access to financing remains costly and difficult
for most SMEs, even though credit conditions
have been gradually improving over the past
two years. This is a result of the size and
organisational features Portuguese SMEs that,
similarly to their European counterparts, are
largely dependent on bank funding. All other
funding sources such as capital market financing
remain rather an exception than a general pattern.
Moreover, the ongoing deleveraging of the
corporate sector continues and one of its aspects is
the strong differences between companies, which
is reflected in the interest rates applied to corporate
lending. These have slightly eased since the end2012, mainly for loans below EUR 1 million, but
44
remain elevated (on average at 4.83%in November
2014) when compared to the Euro area average of
1.83%.(60).The high lending rates for local SMEs
are correlated to a large extent with the banks’
(still elevated) own financing costs and their risk
perception regarding the outlook for domestic
SMEs in general. Nonetheless, both the ECB
lending survey and the Portuguese Bank Lending
Survey mention that fewer Portuguese business
owners report a fall in banks’ willingness to
lend.(61) The government is looking for solutions
to ease the current constraints by strengthening
existing instruments and fostering the use of
alternative financing mechanisms.(62) Among
others, Portugal is setting up a specialised
development financial institution (DFI) to promote
greater efficiency and effectiveness in the
management of financial instruments for
supporting SMEs. The DFI is also expected to
address market failures which hamper some SMEs
to access funding. The set of financing tools that
the DFI will provide to the local SME segment
will include both debt and equity (or quasi-equity)
funding. Despite its formal establishment, the DFI
is not operational yet as there are significant legal
and operational requirements to be settled. As the
DFI was created to manage the financial
instruments supporting SMEs under the ESI Funds
(European
Structural
Investment
Funds),
significant delays in finalising its operations could
hinder the deployment of the ESIF-funded
programmes to finance SMEs projects.
The liquidity of businesses continues to be
aggravated by long delays in payments, in
particular by the public sector. No new measures
have been taken or commitments made to tackle
late payments by the public sector. The European
Commission has initiated an infringement
procedure against Portugal for failure to fully
transpose the Late Payment Directive, excluding
the healthcare sector.
Portugal lags behind the EU average as regards
the involvement of business in science and
innovation, in terms of public-private
cooperation in R&D activities and in the
(60) Banco de Portugal and ECB Lending Survey, November
2014.
(61) Survey on the access to finance of enterprises in eth euro
area, European central Bank, November 2014.
(62) 2014 SBA factsheet Portugal, European Commission,
2014.
transfer
and
commercialisation
of
knowledge.(63) It has stepped up investment in
research and innovation investments over the past
decade with a remarkable average annual real
growth rate of 7% between 2000 and 2007.
Despite this, its performance is still below the EU
average.(64) Portugal's overall R&D intensity fell
from 1.58% in 2009 to 1.36% in 2013. Public
R&D intensity diminished by an average annual
growth of 0.4% from 2008 to 2013, reaching
0.59% in 2013. Business R&D intensity has also
fallen since 2009; by 2013 it was only about half
of the EU average in 2013 (Portugal: 0.65%, EU:
1.29%).
Policy incentives for cooperation between
public bodies conducting research and
businesses remain weak. Given the weak and
scattered policy incentives for the cooperation
between public research organisations and
businesses, and the lack of adequate innovationfriendly framework conditions for business
investment in research and innovation, Portugal
has been unable to overcome its companies'
structural orientation towards activities that are not
knowledge-intensive. The Innovation Agency
(AdI) that promotes cooperation projects between
research and industry has been given a stronger
role and its governance streamlined, which is
expected
to
improve
productivity
and
competitiveness. A new scheme for PhD
studentships in industry has been established by
the Foundation for Science and Technology (FCT)
to leverage productivity and competitiveness.
However, there is still a need to effectively
implement stronger incentives for public-private
cooperation, more effective mechanisms for
knowledge transfer and efficient investment in
research and innovation. To help Portugal make
the transition to a more knowledge-intensive
economy, the following are needed: an investmentfriendly environment for business investment in
research and innovation, to avoid a situation in
which researchers face different conditions in the
(63) In 2012 public expenditure on R&D financed by business
enterprises was very low (0.007% of GDP), pointing to a
very low level of cooperation between business and
science, with Portugal among the bottom five EU
countries. In 2011 the number of public private scientific
co-publication per million people stood at 17 in Portugal
(EU average: 53).
(64) Portugal scores 19 in the Innovation Union Scoreboard
2014 and 24 in the European Innovation Output Indicator
2014.
public and the private sector, closer links between
higher education and the business sector and
further improvements in the allocation of funding
on the basis of performance criteria. It is also very
important to increase the broadband take-up, by
tackling the reasons underlying low rates of
broadband subscription and internet use. Portugal
lags behind significantly in fixed and mobile
broadband take-up and in internet use.(65) The
Digital Agenda Strategy for Portugal, approved in
2012, does not specify improving the actual
broadband take-up as one of its goals nor does it
mention the affordability of internet.
Reforms have been carried out to modernise the
Portuguese justice system, but close monitoring
is needed. The new Judicial Organization Act was
implemented in 2014. It aims to improve the
efficiency and professionalism of court
management with significant benefits in the
organisation and management of the judiciary,
performance accountability and service provision.
The new code of civil procedure, which became
effective in September 2013, introduced significant
changes to expedite the resolution of cases.
However, according to the 2015 EU Justice
Scoreboard, proceedings in civil and commercial
cases continue to be lengthy (386 days). The
number of enforcement cases is still falling slightly
whilst disposition time remains long (1045 days in
2014).(66) In general, there is scope to strengthen
measures promoting evaluation of courts'
activities, use of online tools (e.g. for online
publication of judgements) and conducting surveys
among court users or legal professionals. Reforms
relating to the Tax and Administrative Tribunals
are proceeding more slowly than other judicial
reforms. A better use of operational tools such as
annual work programmes, performance targets and
IT systems to support tax courts appears necessary
to improve the current situation. The rise in
insolvency cases has highlighted the need to
increase resources and training for first instance
courts in this field. As regards highly regulated
professions in the justice sector, draft laws show
(65) As regards the five main drivers of the digital economy,
Portugal ranks 13th out of 28 Member States for
connectivity, 20th for human capital, 15th for use of internet
services, 12th for integration of digital technologies by
business, and 7th for digital public services.
(66) Estatísticas trimestrais sobre ações executivas cíveis (20072014),
Bulletin
20,
http://www.dgpj.mj.pt/sections/siej_pt/destaques4485/estati
sticas-trimestrais9480/, Q2 2014 data, p. 2
45
that the Government intends to limit the ambition
of reforms previously agreed upon during the
economic adjustment programme.
Transparency in monitoring and reporting of
public procurement procedures is being
improved, but challenges remain. Portugal is
reviewing the BASE portal, an online platform that
provides a detailed data on all public procurement
contracts. This enables the Court of Auditors and
the Inspectorate for Finances (IGF) to step up and
streamline their scrutiny. Remaining gaps concern
the transparency of concessions and delays in
publishing data on contracts awarded by local and
regional authorities. A dedicated and skilled
taskforce (UTAP) at the Ministry of Finance is
working to improve fiscal transparency and
reporting on PPPs, but the regional and local levels
are outside its remit and there is no consistent
framework for establishing equivalent structures.
In the area of conflict of interests, incompatibilities
and revolving doors, where legislation is largely in
place, significant shortcomings remain in terms of
maximizing the impact of transparency in
preventing corruption by effective monitoring,
implementation and sanctions. Since the
publication of public procurement codes in 2012,
all public administrations are obliged to have plans
for tackling corruption on the basis of risk
assessment, but progress in monitoring and
analysing such risks has been slow and has not
resulted in an integrated strategy for the prevention
of corruption. According to the EU AntiCorruption Report, published in 2014, the reasons
for such shortcomings also include weaknesses in
the law enforcement, prosecution allegations of
corruption, preventive action on party funding and
in control systems in urban planning decisions.
Overall, much remains to be done to prosecute
high-level corruption and complex corruption and
economic and financial crimes effectively and to
improve rates of final convictions and sanctions.
Progress in effectively implementing the urban
lease reform and comprehensively monitoring
the Portuguese housing sector has been limited.
The Portuguese Government has recently enacted
amendments to the urban lease law which risk
undermining the soundness and effectiveness of
the overall framework. In particular, changes to the
commercial lease framework have enlarged the
universe of companies covered by the transitional
46
period(67) to micro enterprises (about 95% of
Portuguese companies) and to non-profit
institutions which cover areas of ‘national
interest’. The transitional period, already relatively
long, has also been extended by one additional
year. These two changes might create legacy
privileges and dual markets and prevent the
Portuguese housing market from becoming more
dynamic. The legal arrangements covering works
in lease buildings have been changed so that
landlords can terminate a lease contract only in
case of structural works that are validated by the
local authority. By the recommended deadline (the
end of December 2014), the authorities had not
done anything to develop more comprehensive and
reliable monitoring procedures, which are essential
to overcome the lack of data and for a systematic
analysis of the impact of recent reforms on the
housing market and on trends in that market. The
authorities announced their intention of stepping
up efforts to combat tax evasion in the rental
market. However, by the recommended deadline (
the end of December 2014), they had not provided
the comprehensive study to identify the shadow
economy in the rental market, which had been
requested under the programme. At the end of
January 2015, the authorities issued a decree
setting up a working group tasked with
implementing a monitoring model of the housing
market. The authorities confirmed their
commitment to providing a study on the shadow
economy in the Portuguese rental market
according
to
the
following
roadmap:
implementation of the tax measures to curb
(January-May 2015); data compilation and
assessment (June-July 2015); report finalisation
(end of August 2015)
The lack of a comprehensive and systematic
approach to monitoring and evaluation makes
it difficult to assess the full impact of reforms
on the functioning of the economy. Portugal's
government effectiveness is close to the EU
average (68), yet Portugal is less effective in using
(67) The 2012 urban lease law envisaged a 5 year transitional
period for the existing open-ended lease contracts signed
before 1990 (around 30% of the total contracts), taking into
account social criteria for vulnerable households and micro
entities for commercial leases. An additional 2 year
transitional period was foreseen for the commercial lease
regime under certain circumstances.
(68) The government effectiveness indicator is developed by the
World Bank as part of its Worldwide Governance
evidence-based instruments than most other
countries (69), as the consistency and quality of
impact assessments is not systematically checked
and the related methodology is not formalised.
Relevant external stakeholders are not always able
to provide meaningful and timely input into
regulatory processes, and the results of impact
assessment are not systematically published.
Moreover, as attention is now shifting to the
implementation of the several reforms adopted
under the macro economic adjustment programme,
it is essential to assess whether they effectively
contributed to boosting competitiveness, output
and employment growth. The government is
planning to contract in 2015 an evaluation on the
overall impact of structural reforms.
Portugal continues to implement further
measures to cut the electricity tariff debt and to
help keep end-user energy costs in check,
although these appear insufficient to achieve the
targeted outcomes. In April 2014, the Portuguese
authorities presented a third package of measures
designed to tackle remaining excess rents in the
energy sector, further reduce the electricity tariff
debt and achieve a more balanced distribution of
economic surplus between different stakeholders.
Some of these measures have been taken during
the past year, including a major expansion of the
social electricity tariff (intended to be effectively
financed by reducing excess rents enjoyed by
generators) and an extension to 2015 of the special
levy on energy operators (which should contribute
EUR 50mm to reducing tariff debt. Other
announced measures, including legislation
designed to redistribute windfall profits enjoyed by
the incumbent on natural gas take-or-pay contracts,
are in advanced stages of preparation. However,
the incremental impact of these initiatives is
expected to remain fairly modest, and clearing the
tariff debt by 2020, while limiting price increases
for end users as targeted, will likely remain a
major challenge. According to the latest updated
projections (October 2014), the tariff debt will
peak at EUR 4.8 billion in 2015, before gradually
Indicators
(WGI)
project
(http://info.worldbank.org/governance/wgi/index).
(69) European Commission, Member States' Competitiveness
Report
2014:
Reindustrialising
Europe
(http://ec.europa.eu/DocsRoom/documents/6748/), chapter
2.
falling to EUR 1 billion by 2020. This new
estimate is about EUR 400 million higher than
previous projections, which implies that the
proposed headline electricity tariff increase of
3.3% for 2015 will not be sufficient to achieve the
overall target for the electricity tariff debt by 2020.
In parallel, this negative development poses a risk
to the authorities' original target of limiting annual
price increases to 1.5-2.0% above inflation. This
means that meeting the 2020 debt target may call
for persistently higher tariffs than those originally
projected. One important factor underlying these
adverse tariff debt developments is a significant
rise in fraudulent electricity consumption in recent
years; it will thus be of key importance that the
authorities address this problem propmptly and
robustly. In addition, the authorities should also
continue identifying further ways of cutting
remaining rents in the energy sector, so as to
reduce the tariff debt faster while minimising
energy price increases for households and firms.
Further work is also needed to address
environmental issues and weaknesses in a number
of areas, especially waste and water management.
It thus remains essential to adopt and implement
initiatives such as the green growth strategy,
announced in 2014, to encourage a transition to a
more efficient and low-carbon economy in
Portugal.
Portugal is taking action to improve the crossborder integration of its energy networks, but
investment activity needs to be accelerated
Portugal is quite well-connected with the Spanish
energy networks and is working to improve these
electricity and gas interconnections further.
However, the current low level of electricity and
gas interconnection capacity between the Iberian
Peninsula and the rest of the EU is a major
obstacle to establishing a regional market in the
south-western region. In January 2015, the
transmission system operators of Spain, France
and Portugal signed a joint strategy paper on
developing interconnections between the Iberian
Peninsula and the internal electricity market. This
paper lists shared goals and indicates which
options for projects would increase the current
interconnection capacity. This strategy is essential
to reach the minimum interconnection level of
10% agreed by the European Council in October
2014. The need to improve cross border integration
of the energy networks and to speed up the
implementation of the electricity and gas
47
interconnection require
investment activity.
an
acceleration
of
Portugal remains on track to meet EU 2020
renewable energy targets. The share of
renewables has been rising steadily in recent years,
thanks to the Portuguese energy policy of reducing
the country's reliance on fossil fuels. According to
the National Renewable Energy Action, Portugal
has made a commitment to increasing the share of
renewables to 31% by 2020. In 2013 the renewable
energy production accounted for 25,7% of the final
energy consumption, exceeding the interim target
(23,7 %) for the same year.
Portugal is on track to meet the EU 2020 energy
efficiency target. The national energy efficiency
target of 25% by 2020 is being fulfilled. However,
further policies should be pursued to ensure that a
sustainable and durable decrease of energy
consumption builds on structural changes and not
only on cyclical factors such as the slowdown of
the economic activity. This is particularly
important for the building and housing sectors
where
the
effective
transposition
and
implementation of the energy performance of
buildings directive (EPBD-recast) deserves close
monitoring.
Portugal has made little progress in making its
new regulatory framework for the transport
sector fully operational and in refining its longterm transport plan. In late spring 2014, Portugal
adopted the legal framework for its new transport
regulatory authority (AMT), which replaces three
former transport regulators (rail, ports and road).
This initiative was designed to ensure stronger and
better coordinated regulatory monitoring, improve
competition and reduce end-user costs. After
passing AMT's bylaws, the Portuguese authorities
were required to make the new regulator fully
operational by September 2014. However, as a
result of repeated delays in appointing AMT's
Board and of recently published amendments to
the bylaws, this essential step towards
strengthening the transport sector's regulatory
framework has been delayed and the AMT is not
fully operational yet. In addition, Portugal has
adopted an integrated strategic plan for its
transport system (PETI 3+), with a view to
prioritising infrastructure investments in a
rationalised and cost-effective manner, coordinated
across different transport modes and based on a
48
well-defined long-term vision. EU Structural
Funds are expected to support some of the
investment projects under this plan. However, it
still needs to be refined further. In particular, it
could benefit from more focus and better
prioritisation, underpinned by a sound analysis of
transport demand; moreover a realistic and mature
project pipeline has yet to be presented. Project
preparation must therefore be a matter of priority,
in particular for the larger infrastructure rail and
port investments.
Although earlier reforms in Portugal's ports
system are gradually producing benefits,
limited progress has been made with important
further measures to boost competition and costeffectiveness. In early 2013, a new law on port
labour took effect, which was intended to tackle
key bottlenecks and significantly improve the
competitive position of Portuguese ports. This new
law required re-negotiation of collective
agreements in force in Portuguese ports, and
together with the gradual elimination of port use
fees (TUP-Carga), it allowed a significant
downward adjustment of port operating costs. In
order to ensure that shippers benefit fully from
these cost savings, a key next step involves
renegotiating a number of port concession
contracts, particularly those with a long remaining
term left, in order to reduce end-user costs, to align
incentives, to boost competition and to encourage
investments while achieving appropriate risksharing between port authorities and private-sector
operators. However, the legal terms and conditions
underpinning these renegotiations are still unclear,
throwing into question their compliance with EU
public procurement rules and their effectiveness in
boosting competition, investments and the overall
port operations in general. Moreover, these
negotiations have proceeded slowly and in a
piecemeal fashion, with little concrete progress
made so far; in addition, focus seems to have
shifted somewhat away from the original goal of
reducing port usage costs for shippers. Part of the
underlying problem appears to be a lack of
resources within UTAP, the Ministry of Finance
body overseeing the concession renegotiations. A
number of other smaller-scale reforms in the ports
sector (summarised in a "chronogram" published
by the Portuguese authorities in 2014 have not
seen significant overall progress either.
The merger of the railway and road
infrastructure managers is anticipated to
deliver significant additional cost savings, but
liberalisation measures in railways and urban
public transport continue to proceed at a slow
pace. Achieving operational balance of the rail
infrastructure manager (REFER) by 2015 remains
a major railway policy objective. After taking
various measures to this end over the course of
2013 and early 2014 (including cost
rationalisation, closure of loss making lines and
staff cuts), the Portuguese authorities have
announced that REFER will be merged with road
infrastructure manager EP in order to achieve
further cost-savings. A Planning Commission to
supervise the merger was appointed in August
2014, and both the legal and operational aspects of
the merger are expected to be completed over the
course of 2015. Synergies from the merger are
projected to be sufficient to structurally bring
REFER to operational balance. In addition,
Portugal is expected to launch the privatisation of
CP Carga, the state-owned freight operator, after
the unbundling of its terminals, which would
contribute to improving the governance of the
company and attracting more customers to the
railway freight market. The process of transferring
the terminals to REFER started in April 2014 (after
repeated postponements) and is currently still
under way while the privatisation process itself has
yet to start. Similarly, the introduction of
competition on the commercial sub-urban railway
lines (Lisbon and Porto) could create new business
or investment opportunities for potential entrants,
but this measure has incurred significant delays as
well. The tender process for the Porto public
transport concessions was launched over the
summer and wound up in January 2015, several
months later than planned. The tender for Lisbon is
expected to be launched by the end of the first
quarter of 2015, just after the PSO contracts are
signed.
49
ANNEX A
Overview Table
Commitments
Summary assessment(70)
2014 Country specific recommendations (CSRs)
CSR1: Implement the necessary fiscal consolidation
measures for 2014 so as to achieve the fiscal targets
and prevent the accumulation of new arrears. For the
year 2015, implement a revised budgetary strategy in
order to bring the deficit to 2.5 % of GDP, in line
with the target set in the Excessive Deficit Procedure
Recommendation, while achieving the required
structural
adjustment.
Replace
consolidation
measures which the Constitutional Court considers
unconstitutional by measures of similar size and
quality as soon as possible. The correction of the
excessive deficit should be done in a sustainable and
growth-friendly manner, limiting recourse to oneoff/temporary measures. After the correction of the
excessive deficit, pursue the planned annual
structural adjustment towards the medium-term
objective, in line with the requirement of an annual
structural adjustment of at least 0,5 % of GDP, more
in good times, and ensure that the debt rule is met in
order to put the high general debt ratio on a
sustainable path. Prioritise expenditure-based fiscal
consolidation and increase further the efficiency and
quality of public expenditure. Maintain tight control
of expenditure in central, regional and local
administration. Continue the restructuring of the
state-owned enterprises. Develop by the end of 2014
new comprehensive measures as part of the ongoing
pension reform, aimed at improving the medium-term
sustainability of the pension system. Control
healthcare expenditure growth and proceed with the
hospital reform. Review the tax system and make it
more growth friendly. Continue to improve tax
compliance and fight tax evasion by increasing the
efficiency of the tax administration. Review the tax
system and make it more growth friendly. Continue
to improve tax compliance and fight tax evasion by
increasing the efficiency of the tax administration.
Strengthen the system of public financial
management by swiftly finalising and implementing
the comprehensive reform of the Budgetary
Framework Law by the end of 2014. Ensure strict
Portugal has made some progress in
addressing CSR 1 (this overall assessment of
CSR 1 excludes an assessment of compliance
with the Stability and Growth Pact):
• Some progress
measures.
in
fiscal
structural
• Limited progress in developing new
comprehensive measures as part of the
ongoing pension reform, while some
progress in proceeding with hospital
reforms.
• Some progress in reviewing the tax
system. The PIT reform, the green taxation
reform and additional measures associated
with the CIT reform were adopted. Further
improvements have been observed in the
operationalisation of the e-invoice system,
tax administration reform and other antifraud measures announced in the 2015
budget.
• Some progress in improving the fiscal
framework. The Budgetary Framework
Law reform is expected in Q1-2015. A
revision of the Commitment Control Law
was approved in January, further
strengthening budget control.
•
Some progress in implementing the single
wage and supplement scales. The Law on
Single Wage Scale (TRU) was published
in September 2014 and has to be applied
from January 2015. The Decree-law on the
Single Supplements Scale (TUS) is under
preparation.
(70) The following categories are used to assess progress in implementing the 2014 CSRs of the Council Recommendation: No
progress: The Member State has neither announced nor adopted any measures to address the CSR. This category also applies if
a Member State has commissioned a study group to evaluate possible measures. Limited progress: The Member State has
announced some measures to address the CSR, but these measures appear insufficient and/or their adoption/implementation is
at risk. Some progress: The Member State has announced or adopted measures to address the CSR. These measures are
promising, but not all of them have been implemented yet and implementation is not certain in all cases. Substantial progress:
The Member State has adopted measures, most of which have been implemented. These measures go a long way in addressing
the CSR. Fully addressed: The Member State has adopted and implemented measures that address the CSR appropriately.
50
A. Overview Table
compliance with the Commitment Control Law.
Effectively implement single wage and supplements'
scales in the public sector from 2015 onwards.
CSR2: Maintain minimum wage developments
consistent with the objectives of promoting
employment and competitiveness. Ensure a wage
setting system that promotes the alignment of wages
and productivity at sectoral and/or firm level.
Explore, in consultation with the social partners and
in accordance with national practice, the possibility
of mutually agreed firm-level temporary suspension
of collective agreements. By September 2014,
present proposals on mutually agreed firm-level
temporary suspension of collective agreements and
on a revision of the survival of collective agreements.
Portugal has made
addressing CSR 2:
some
progress
in
• Limited progress in minimum wage
developments. In October 2014 the
government raised the minimum by 4.1%
to be effective between 1 October 2014
and 31 December 2015. The increase
occurred after agreement with the social
partners. At the same time employers'
social security contributions were cut from
23.75% to 23% for employees who had
been on minimum wage without
interruption, since May 2014.
• Some progress in ensuring a wage setting
system that promotes the alignment of
wages and productivity at sectoral and/or
firm level: specific measures are described
below.
• Limited progress as regards the
introduction of mutually agreed firm-level
temporary suspension of collective
agreements. Legislation was adopted in
August 2014 and enacted in September
2014: however, new rules require
agreement from the original signatories of
the
sectoral
agreement,
making
implementation more difficult.
• Full implementation regarding the
presentation of proposals on the survival of
collective agreements. In August 2014 the
authorities have passed legislation
reducing the survival period of collective
agreements expired and not renewed.
• No progress concerning criteria for the
extension of collective agreements: in June
2014 less stringent criteria for the
extension of collective agreements have
been introduced compared to those
required since 2012. The potential
generalisation of extensions of collective
agreements is likely to hinder efficient
wage adjustment at firm level.
51
A. Overview Table
CSR3: Present, by March 2015, an independent
evaluation of the recent reforms in the employment
protection system, together with an action plan for
possible further reforms to tackle labour market
segmentation. Pursue the ongoing reform of active
labour market policies and Public Employment
Services aimed at increasing employment and labour
participation rates, specifically by improving job
counselling/job
search
assistance
and
activation/sanction systems with a view to reducing
long-term unemployment and integrating those
furthest away from the labour market. Address the
high youth unemployment, in particular by effective
skills anticipation and outreach to non-registered
young people, in line with the objectives of a youth
guarantee. Ensure adequate coverage of social
assistance, including the minimum income scheme,
while ensuring effective activation of benefit
recipients.
Portugal has made
addressing CSR 3:
some
progress
in
• No progress in presenting, by March 2015,
an independent evaluation of the recent
reform
in
employment
protection
legislation.
• Some progress in terms of active labour
market policies implementation. However,
the effectiveness of employment and
training measures need to be carefully
monitored. As regards the PES, despite
progress achieved with the PES reform,
the caseload remains very high.
• Some progress in implementing the Youth
Guarantee (YG) and engaging all relevant
governmental
and
non-governmental
partners in its implementation. However,
substantial challenges remain, notably the
capacity of PES as coordinator of the YG
to engage the YG network partners and the
need to reach out to all non-registered
young people, not in employment,
education or training (NEETs).
• No progress in ensuring adequate coverage
of social assistance, including the
minimum income scheme.
CSR4: Improve the quality and labour-market
relevance of the education system in order to reduce
early school leaving and address low educational
performance rates. Ensure efficient public
expenditure in education and reduce skills
mismatches, including by increasing the quality and
attractiveness of vocational education and training
and fostering cooperation with the business sector.
Enhance cooperation between public research and
business and foster knowledge transfer.
Portugal has made
addressing CSR 4:
some
progress
in
• Some progress in improving the quality
and labour-market relevance of the
education through: the reform of curricula;
the reform of teachers statutes; the
development of the monitoring tool: the
further development of the evaluation
system for teachers and schools; the
diversification of pathways implemented
with new Vocational Education Training
(VET) programs; an increased number of
hours of on the job training in VET
options; a National skills Strategy; the
creation of TESPs courses (more than 90
authorisations so far but most of the
beneficiaries have not yet started the
programmes in practical terms).
• Some progress towards a more efficient
52
A. Overview Table
public spending through the rationalisation
of the schools network and a new funding
formula to provide more incentives to
better performing schools.
• Limited progress in improving cooperation
between public research and business and
encouraging knowledge transfer. There are
still weak and scattered policy incentives
for the cooperation between public
research performing organisations and
businesses. The role of the Innovation
Agency has been reformulated and its
governance
has
been
streamlined.
However, the announced action plan has
not been implemented yet.
CSR5: Monitor banks' liquidity position and
potential capital shortfalls, including by on-site
thematic inspections and stress-testing. Assess the
banks' recovery plans and introduce improvements to
the evaluation process where necessary. Implement a
comprehensive strategy to reduce the corporate debt
overhang and reinforce efforts to widen the range of
financing alternatives, including for early stages of
business developments, by enhancing the efficiency
of the debt restructuring tools (particularly PER and
SIREVE) for viable companies, introducing
incentives for banks and debtors to engage in
restructuring processes at an early stage and
improving the availability of financing via the capital
market. Ensure that the identified measures support
the reallocation of financing towards the productive
sectors of the economy, including to viable SMEs,
while avoiding risks to public finances and financial
stability. Implement, by end September 2014, an
early warning system mainly with supervisory
purposes, to identify firms, including SMEs, with a
high probability of default due to an excessive level
of indebtedness, and which can, indirectly, promote
early corporate debt restructuring.
Portugal has made substantial progress in
addressing CSR 5:
• Substantial progress in monitoring banks'
liquidity and capital position and assess
banks' recovery plans. Portugal has
announced the following measures:
− Follow-up by Banco de Portugal to the
Comprehensive Assessment exercise
− Analysis of pillar 1 and 2 regulatory
measures to promote corporate debt
restructuring or sale/transfer of underlying
exposures
• Substantial progress in implementing
measures to reduce corporate debt
overhang. Portugal has adopted the
Strategic plan for Corporate Debt
Restructuring (published)
•
Some progress in widening the range of
financing alternatives for corporates:
formal establishment of Development
Financial Institution (DFI), intended to
help address market failures which hamper
SME access to finance (company licence
issued in September 2014)
• The early warning system is fully
implemented. Portugal has implemented
the following measures:
53
A. Overview Table
− early warning system for defaults;
− overhaul of corporate insolvency and
restructuring framework, with stronger
focus on recovery of firms rather than
liquidation
CSR6: Implement the second and third packages of
measures in the energy sector aimed at reducing
energy costs for the economy, while eliminating the
electricity tariff debt by 2020, and closely monitor
implementation. Improve the cross-border integration
of the energy networks and speed up implementation
of the electricity and gas interconnection projects.
Implement the comprehensive long-term transport
plan and the ‘chronogram’ setting out the ports sector
reforms. Complete the transports concessions for the
metropolitan areas of Lisbon and Oporto. Ensure that
the renegotiations of the existing port concessions
and the new authorisation schemes are performanceoriented and in line with internal market principles, in
particular procurement rules. Ensure that the national
regulatory authority for transport (AMT) is fully
independent and operational by the end of September
2014. Ensure the financial sustainability of the stateowned enterprises in the transport sector. Strengthen
efficiency and competition in the railways sector, by
implementing the plan for the competitiveness of CP
Carga, after the transfer of the freight terminals while
ensuring the management independence of the stateowned infrastructure manager and railway
undertakings.
Portugal has made
addressing CSR6:
some
progress
in
• Some progress in implementing the second
and third packages in the energy sector.
Portugal has implemented the enhanced
electricity social tariff (part of the third
package of energy sector measures) and
approved the extension of the special
energy levy (included in the 2015 budget).
Despite some progress, excessive rents still
exist and also the electricity tariff deficit
needs to be further addressed, through a set
of credible additional measures. Taxes on
electricity have risen for customers in
recent years, mitigating progress made
through interconnections that lower prices
thanks to competition. Overall the real
cost of energy has fallen in Portugal. Some
progress has been made in improving the
cross-border integration of the energy
networks. On 6 January 2015 in Brussels,
the Spanish, French and Portuguese
transmission system operators signed a
joint
strategy
paper
to
develop
interconnection between the Iberian
Peninsula and the internal electricity
market. The joint strategy paper lists
shared goals and indicates which options
for projects have the potential to increase
the current interconnection capacity. This
strategy will be important in reaching the
minimum interconnection level of 10%
agreed by the European Council in
October 2014.
• Limited progress in implementing the
long-term transport plan and ports sector
chronogram. These measures are longerterm so they are likely to be only partially
completed by the summer of 2015.
Limited progress has been observed in
transports concessions for the metropolitan
areas of Lisbon and Porto. These measures
have incurred significant delays as well.
54
A. Overview Table
The tender process for the Porto public
transport concessions was launched over
the summer and has been concluded in
January 2015, several months later than
planned. The tender for Lisbon is expected
to be launched by the end of first quarter
of 2015, just after the PSO contracts are
signed. Limited progress has been made in
the port concession renegotiations that
have proceeded at a slow pace and will
likely continue to do so; as a result,
completion by the summer of 2015 is
unlikely. No progress has been made in
ensuring that the Transport regulator is
fully operational (the recommended
deadline was the end-September 2014). On
2 February 2015, a new amendment to the
AMT bylaw was published. The amended
legislation
extends
the
AMT’s
establishment period (due by the end of
September 2014). The new provision states
that AMT is legally able to carry out its
assignments from February 2015. Limited
progress has been observed in the railways
sector. The merger between EP/REFER is
ongoing. Further progress was made with
staff reductions in transport sector SOEs;
this will continue in 2015. The planning
commission for the EP-REFER merger
was nominated in August 2014 (intended
to improve transport SOEs' financial
sustainability).
CSR7: Further improve the evaluation of the housing
market, including by setting up, by the end of 2014, a
more systematic monitoring and reporting framework
and issue a comprehensive report on the shadow
economy in that market. Continue efforts to carry out
further inventories of regulatory burden with a view
to including, by March 2015, sectors not yet covered.
Adopt and implement, by the end of September 2014,
the outstanding licensing decrees and sectoral
amendments. Remove, by the end of September
2014, remaining restrictions in the professional
services sector and enact the professional bodies'
amended bylaws which have not yet been adopted
under the macroeconomic adjustment programme.
Eliminate payment delays by the public sector.
Ensure adequate resources of the national regulators
and competition authority.
Portugal has made limited progress in
addressing CSR 7:
• No progress by the end of 2014
(recommended deadline) in further
improving the evaluation of the housing
market, including by setting up, by the end
of 2014, a more systematic monitoring and
reporting framework and issue a
comprehensive report on the shadow
economy in that market. At the end of
January 2015, the authorities published a
decree establishing a working group tasked
with implementing a monitoring model of
the housing market. The study on the
shadow economy in the Portuguese rental
market is now expected to be issued at the
end of August 2015
55
A. Overview Table
• Some progress in continuing efforts to
carry out further inventories of regulatory
burden with a view to including, by March
2015 sectors not yet covered. Under the
SIMPLIFICAR initiative, Portugal is
implementing a road map to reduce
regulatory burdens. Work is ongoing,
although with some delay, to further
improve the business-friendliness of the
regulatory environment. This includes
approving the methodology for impact
assessment of legislation which includes
the "one-in/one-out" rule and broadens the
scope of the existing inventory of the most
burdensome regulations to include new
sectors, such as tourism, construction and
agriculture. To this end, a governance
framework for centralised regulatory
simplification activities is being set up,
based on inter-ministerial coordination and
stakeholder engagement mechanisms.
• No progress by the end-September 2014
(recommended deadline) in adopting and
implementing all outstanding sectoral
amendments. Some outstanding sectoral
amendments, precious metals, mining and
some legislation on territorial planning,
have not yet been implemented. There is
no political will to approve a new law on
universities. Some progress was made after
the recommended deadline:
− the law on land registration experts was
published on 9 January 2015;
− the new commercial licensing regime was
published on 16 January 2015;
− the legal framework for the single
environmental license was approved by the
Council of Ministers at the end of January
2015.
− copyright collective management societies,
electricians, bullfighters, gas installation
services and professionals, general law on
construction, general law on construction
professionals were all approved by the
Council of Ministers and sent to
Parliament during in 2014. All were
approved by the Parliament at first
56
A. Overview Table
reading.
• No progress by the end of September 2014
(recommended deadline) in removing, the
remaining restrictions in the professional
services sector. However, limited progress
has been made recently on removing
restrictions in the professional service
sector. The general law on professional
partnerships was approved in the Council
of Ministers of 18/12/2014 and sent to
Parliament for enactment. No progress by
the end of September 2014 (recommended
deadline) in enacting the professional
bodies' amended bylaws. None of the
outstanding 18 bylaw of highly regulated
professions has been implemented. 9 draft
bylaws for highly regulated professions are
reportedly finalised but have not yet been
approved by the Council of Ministers. The
remaining 9 draft bylaws are experiencing
delays, mainly due to non-compliance with
the framework law for highly regulated
professions and with EU law (particularly
the bylaws from the Ministry of Justice for
lawyers, solicitors, enforcement agents,
notaries)
• No progress in eliminating payment delays
by the public sector.
• Some progress in ensuring that the national
regulators and competition authority have
adequate resources.
The Competition
bylaw was published in August 2014. As
regards the outstanding NRAs bylaws, the
CMVM and ISP statutes were published
on 6 January 2015; ANAC and ANACOM
bylaws were approved by the Council of
Ministers at the end of December 2014. A
new amendment to the AMT bylaw was
published on 2 February 2015.
CSR8: Continue to rationalise and modernise central,
regional and local public administration. Implement
the reforms to enhance the efficiency of the judicial
system and increase transparency. Step up efforts to
evaluate the implementation of reforms undertaken
under the macroeconomic adjustment programme as
well as planned and future reforms. In particular,
insert mandatory systematic ex ante and ex post
assessments in the legislative process. Set up a
Portugal has made
addressing CSR 8:
some
progress
in
• Some progress in rationalising and
modernising central, regional and local
public administration. Portugal announced
a global strategic plan to rationalize and
reduce ICT costs in public administration
(at early stages of defining scope and
57
A. Overview Table
functionally independent central evaluation unit at
government level, which assesses and reports every
six months on the implementation of these reforms,
including consistency with the ex-ante impact
assessment, with corrective action if needed.
implementing roadmaps). In the context of
the SIMPLIFICAR initiative, Portugal is:
− implementing the road map for the
reduction of regulatory burden;
− further making the regulatory environment
more business-friendly, which includes
approving the methodology for assessing
the impact of legislation including the
"one-in/one-out" rule;
− broadening the scope of the existing
inventory of the most burdensome
regulations to cover new sectors, such as
tourism, construction and agriculture. A
centralised governance framework for
regulatory simplification activities is being
set up for this purpose, based on interministerial coordination and stakeholder
engagement mechanisms.
− Portugal has also implemented the
Municipality Support Fund (FAM), a debt
work-out mechanism for over-indebted
municipalities which was formally
established in August 2014. Preparations
have started for the 2015 roll-out of the
"Aproximar" strategy (designed to
reorganise the public services network at
local level).
• Some progress has been made in
enhancing the efficiency of the judicial
system and increasing transparency. The
code of civil procedures has been adopted
but no data are yet available on the
clearance rate and disposition time under
the new regime. Judicial reorganisation has
had a slow start. It remains to be seen the
real benefits in the coming years. IT
applications
for
the
Tax
and
Administrative
Courts
are
still
underdeveloped. Some progress has been
made on improving transparency and
combating corruption. Measures have been
taken to further improve transparency in
public procurement and private-public
partnerships. Some challenges remain in
implementing transparency requirements
by local and regional authorities and in
effectively applying the existing legal
58
A. Overview Table
framework for the prevention of corruption
and conflict of interests.
• No progress has been made in evaluating
the implementation of reforms undertaken
under the macroeconomic adjustment
programme as well as planned and future
reforms. No progress was observed in
setting up a functionally independent
central evaluation unit.
Europe 2020 (national targets and progress)
Employment rate target (20-64 years old):75%
The employment rate has fallen on a yearly
basis since the start of the economic crisis,
from 73.1% in 2008 to 66.3% in 2012 and
65.4 % in 2013. Despite some recent labour
market reforms to encourage job creation, the
achievement of the national target of 75% by
2020 proves challenging.
R&D target: 1.36% of GDP
Portugal set a national R&D intensity target
for 2020 of 3%, where public-sector R&D
intensity would reach 1 % and business R&D
intensity 2%.
From 2000 up to the crisis years, Portugal
made very significant progress towards the
R&D intensity target. However, R&D
intensity fell from 1.58% in 2009 to 1.36% in
2013, where public sector R&D intensity was
0.59% and business R&D intensity 0.65 %.
Limited progress has been made. Portugal
should make a major effort to ensure that
investment in research and innovation is
sustainable and efficient and to stimulate
knowledge absorption by businesses.
Greenhouse gas (GHG) emissions target:
-National Greenhouse gas (GHG) emissions target:
1% in 2020 compared to 2005 (in non-ETS sectors)
On the basis of the latest national projections
and taking into account existing measures, it is
expected that target will be met: -31% in 2020
compared to 2005 (with a margin of 32%
percentage points).
Key measures are being implemented: the
national
climate
change
programme
"Programa Nacional para as Alterações
Climáticas" for the period 2013-2020 (PNAC
2020) and the national low-carbon strategy "
Roteiro Nacional de Baixo Carbono".
59
A. Overview Table
2020 Renewable energy target for Portugal: 31%
Share of renewable energy in all modes of transport:
10%
Energy Efficiency target.
Portugal has set an indicative national energy
efficiency target of 25% reduction of final energy
consumption in 2020, which implies reaching a 2020
level of 22.5 Mtoe primary consumption and 17.4
Mtoe final energy consumption.
In 2013, renewable energy production
accounted for 25.7% of the final energy
demand, (Source; EurObserv'ER). Portugal is
above the trajectory but more action is needed
to maintain this situation until 2020.
Portugal is on track to meet its national target,
which is however, somewhat unambitious.
Although primary and final energy
consumption fell between 2005 and 2012,
Portugal should implement further policies to
bring about structural changes and a
sustainable reduction in energy consumption.
Discussions with the national authorities in the
framework of ESIF revealed problems with
transposing the Energy Performance in
Buildings Directive that need urgent action.
Early school leaving target: 10%
Early school leaving has fallen gradually over
the last decade from 45% in 2002 to 20.8% in
2012 and 18.9% in 2013. However, the rate of
early school leaving remains among the EU's
highest.
Tertiary education target: 40%
See paragraph above.
Tertiary education attainment was 30% in
2013. There has been remarkable progress
from rates of about 11% at the beginning of
last decade. However, attainment remains
significantly below the EU average.
Some efforts are being made to address the
skills mismatch and lack of employability of
higher education graduates in Portugal. They
include reforming the VET system, publishing
employment rates and the rationalising career
offer. However, more robust actions would be
needed to improve its quality, labour market
relevance and attractiveness of tertiary
education.
The target envisages reducing the number of persons
in or at risk of poverty and social exclusion by 200
000 persons in 2020.
The number of people living at risk of poverty
or social exclusion rose by 210,000, from
2,667,000 in 2012 to 2,877,000 in 2013.
Sustained efforts will be needed in the future,
specially taking into account the latest data
and the projected demographic trends.
60
ANNEX B
Standard Tables
Table B.1:
Macroeconomic indicators
19962000
Core indicators
GDP growth rate
Output gap 1
HICP (annual % change)
Domestic demand (annual % change) 2
Unemployment rate (% of labour force) 3
Gross fixed capital formation (% of GDP)
Gross national saving (% of GDP)
General government (% of GDP)
Net lending (+) or net borrowing (-)
Gross debt
Net financial assets
Total revenue
Total expenditure
of which: Interest
Corporations (% of GDP)
Net lending (+) or net borrowing (-)
Net financial assets; non-financial corporations
Net financial assets; financial corporations
Gross capital formation
Gross operating surplus
Households and NPISH (% of GDP)
Net lending (+) or net borrowing (-)
Net financial assets
Gross wages and salaries
Net property income
Current transfers received
Gross saving
Rest of the world (% of GDP)
Net lending (+) or net borrowing (-)
Net financial assets
Net exports of goods and services
Net primary income from the rest of the world
Net capital transactions
Tradable sector
Non-tradable sector
of which: Building and construction sector
20012005
20062010
2011
2012
2013
2014
2015
2016
4.1
2.8
2.4
5.0
0.9
0.7
3.2
0.8
0.6
-0.9
1.7
0.5
-1.8
-3.5
3.6
-5.7
-3.3
-6.1
2.8
-6.6
-1.4
-6.4
0.4
-2.3
1.0
-4.9
-0.2
1.8
1.6
-3.1
0.1
1.6
1.7
-1.4
1.1
1.5
6.5
26.5
19.7
7.0
24.7
16.0
9.9
21.9
11.6
12.9
18.4
13.0
15.8
16.3
14.0
16.4
15.1
15.2
14.2
15.1
15.2
13.4
15.3
16.1
12.6
15.6
16.7
-3.8
53.6
-31.5
38.9
42.7
3.6
-5.0
59.5
-41.9
40.2
45.2
2.7
-6.4
77.8
-54.6
41.0
47.4
2.9
-7.4
111.1
-53.0
42.6
50.0
4.3
-5.5
124.8
-76.3
43.0
48.5
4.9
-4.9
128.0
-83.7
45.2
50.1
5.0
-4.6
128.9
n.a.
44.0
48.6
5.0
-3.2
124.5
n.a.
43.9
47.1
4.9
-2.8
123.5
n.a.
44.2
47.0
4.8
0.3
0.7
-162.6 -164.1
1.2
-1.1
10.4
10.0
21.5
21.4
0.8
n.a.
n.a.
10.4
21.8
0.0
n.a.
n.a.
10.6
22.2
0.3
n.a.
n.a.
10.4
23.5
-3.2
-4.5
-5.5
0.6
-137.2 -131.5 -149.9 -164.2
-9.7
-7.5
-5.4
-2.5
13.7
13.0
13.0
10.9
19.7
19.4
20.5
21.0
1.3
154.4
38.3
5.3
20.3
8.0
2.2
124.6
38.2
4.6
21.5
7.2
2.3
119.3
36.8
6.0
23.0
5.9
2.6
121.8
36.1
5.5
24.8
5.3
4.6
129.4
34.9
6.5
25.5
6.9
5.5
139.3
34.6
7.0
26.8
7.3
5.1
n.a.
34.3
8.4
25.9
6.8
5.2
n.a.
34.1
8.8
25.9
6.9
4.8
n.a.
33.5
9.2
25.5
6.5
-5.7
28.6
-9.1
-0.6
2.0
45.4
42.2
6.3
-7.3
60.3
-8.6
-1.6
1.7
42.0
45.3
6.4
-9.6
95.7
-8.0
-3.5
1.2
39.8
47.6
5.7
-4.1
106.9
-4.3
-2.1
1.5
40.2
47.4
4.8
-0.6
118.0
-0.7
-2.9
2.0
41.3
46.2
4.2
1.3
116.4
1.0
-2.2
1.5
41.8
46.1
3.7
1.3
n.a.
0.9
-2.2
1.6
n.a.
n.a.
n.a.
2.0
n.a.
1.6
-2.3
1.6
n.a.
n.a.
n.a.
2.2
n.a.
2.0
-2.3
1.6
n.a.
n.a.
n.a.
(1) The output gap constitutes the gap between the actual and potential gross domestic product at 2010 market prices.
(2) The indicator of domestic demand includes stocks.
(3) Unemployed persons are all those who were not employed, had actively sought work and were ready to begin working
immediately or within two weeks. The labour force is the total number of people employed and unemployed. The
unemployment rate covers the age group 15-74.
Source: European Commission 2015 winter forecast; Commission calculations
61
B. Standard Tables
Table B.2:
Financial market indicators
1)
Total assets of the banking sector (% of GDP)
Share of assets of the five largest banks (% of total assets)
Foreign ownership of banking system (% of total assets)
Financial soundness indicators:
2)3)
- non-performing loans (% of total loans)
- capital adequacy ratio (%)
- return on equity (%)
2)3)
2)3)
Bank loans to the private sector (year-on-year % change)
1)
1)
Lending for house purchase (year-on-year % change)
1)
Loan to deposit ratio
4)
Central Bank liquidity as % of liabilities
Private debt (% of GDP)
5)
Gross external debt (% of GDP)
- public
- private
Long-term interest rate spread versus Bund (basis points)*
Credit default swap spreads for sovereign securities (5-year)*
2009
308.6
70.1
23.1
2010
323.3
70.9
22.2
2011
335.0
70.8
21.4
2012
337.4
69.9
20.6
2013
310.9
70.6
19.4
2014
278.4
n.a.
n.a.
4.8
10.5
5.2
10.3
7.5
9.8
9.8
12.6
10.6
13.3
11.2
12.0
7.3
7.5
-5.5
-5.4
-11.0
-24.8
3.1
1.7
-3.3
-6.0
-5.0
-5.0
4.2
3.5
-0.5
-2.8
-3.5
-3.6
133.3
123.9
116.1
119.5
111.4
106.3
3.5
204.1
8.3
201.5
9.1
204.2
11.0
207.8
10.9
202.8
9.2
n.a.
58.8
42.8
98.9
72.4
55.6
40.2
265.3
253.0
57.5
45.5
763.3
772.8
80.0
46.7
905.3
818.7
87.2
47.7
472.4
355.8
94.7
47.6
259.1
173.0
(1) Latest data November 2014.
(2) Latest data Q2 2014.
(3) A new calculation method for nonperforming loans that follows the methodology of the Financial Soundness Indicators
Compilation Guide was introduced in September 2011. Historical annual data have been revised accordingly, back to 2006.
(4) Latest data September 2014.
(5) Latest data June 2014. Monetary authorities, monetary and financial institutions are not included.
* Measured in basis points.
Source: IMF (financial soundness indicators); European Commission (long-term interest rates); World Bank (gross external
debt); ECB (all other indicators).
62
B. Standard Tables
Table B.3:
Taxation indicators
Total tax revenues (incl. actual compulsory social contributions, % of GDP)
Breakdown by economic function (% of GDP)1
Consumption
of which:
- VAT
- excise duties on tobacco and alcohol
- energy
- other (residual)
Labour employed
Labour non-employed
Capital and business income
Stocks of capital/wealth
p.m. Environmental taxes2
VAT efficiency3
Actual VAT revenues as % of theoretical revenues at standard rate
2002
2006
2008
2010
2011
2012
31.4
32.1
32.8
31.5
33.2
32.4
12.0
13.2
12.3
11.7
12.2
12.1
7.6
1.0
2.1
1.3
11.3
0.6
5.1
2.5
3.0
8.6
1.1
2.0
1.5
11.4
0.8
4.4
2.3
2.9
8.4
0.9
1.9
1.2
11.7
0.9
5.5
2.4
2.6
7.8
1.0
1.8
1.1
12.2
1.0
4.3
2.3
2.5
8.3
1.0
1.8
1.1
12.7
1.2
4.9
2.3
2.4
8.5
1.0
1.7
1.0
12.2
1.2
4.4
2.4
2.2
53.3
52.9
53.4
46.7
46.7
48.8
(1) Tax revenues are broken down by economic function, i.e. according to whether taxes are raised on consumption, labour
or capital. See European Commission (2014), Taxation trends in the European Union, for a more detailed explanation.
(2) This category comprises taxes on energy, transport and pollution and resources included in taxes on consumption and
capital.
(3) VAT efficiency is measured via the VAT revenue ratio. It is defined as the ratio between the actual VAT revenue collected
and the revenue that would be raised if VAT was applied at the standard rate to all final (domestic) consumption
expenditures, which is an imperfect measure of the theoretical pure VAT base. A low ratio can indicate a reduction of the
tax base due to large exemptions or the application of reduced rates to a wide range of goods and services (‘policy gap’)
or a failure to collect all tax due to e.g. fraud (‘collection gap’). It should be noted that the relative scale of cross-border
shopping (including trade in financial services) compared to domestic consumption also influences the value of the ratio,
notably for smaller economies. For a more detailed discussion, see European Commission (2012), Tax Reforms in EU Member
States, and OECD (2014), Consumption tax trends.
Source: European Commission
63
B. Standard Tables
Table B.4:
Labour market and social indicators
2008
2009
2010
2011
2012
2013
2014
Employment rate
(% of population aged 20-64)
73.1
71.1
70.3
68.8
66.3
65.4
67.5
Employment growth
(% change from previous year)
0.4
-2.7
-1.4
-1.9
-4.1
-2.9
1.6
Employment rate of women
(% of female population aged 20-64)
67.1
66.1
65.6
64.6
63.0
62.3
64.0
Employment rate of men
(% of male population aged 20-64)
79.4
76.4
75.4
73.2
69.8
68.7
71.2
Employment rate of older workers
(% of population aged 55-64)
50.7
49.7
49.5
47.8
46.5
46.9
47.9
Part-time employment (% of total employment,
age 15 years and over)
12.2
11.9
11.9
13.6
14.6
14.3
13.1
Part-time employment of women (% of women employment,
age 15 years and over)
17.4
16.6
15.7
16.5
17.0
16.4
14.8
Part-time employment of men (% of men employment, age 15
years and over)
7.6
7.7
8.4
11.0
12.5
12.3
11.6
Fixed term employment (% of employees with a fixed term
contract, age 15 years and over)
22.7
22.0
22.8
22.0
20.5
21.4
21.4
Transitions from temporary to permanent employment
33.7
20.3
29.6
28.8
26.3
n.a.
n.a.
Unemployment rate1 (% of labour force,
age group 15-74)
8.7
10.7
12.0
12.9
15.8
16.4
14.1
Long-term unemployment rate2 (% of labour force)
4.1
4.7
6.3
6.2
7.7
9.3
8.5
Youth unemployment rate
(% of youth labour force aged 15-24)
21.5
25.3
27.9
30.3
37.9
38.1
34.7
Youth NEET rate (% of population aged 15-24)
10.2
11.2
11.4
12.6
13.9
14.1
n.a.
Early leavers from education and training (% of pop. aged 18-24
with at most lower sec. educ. and not in further education or
training)
34.9
30.9
28.3
23.0
20.5
18.9
n.a.
Tertiary educational attainment (% of population aged 30-34
having successfully completed tertiary education)
21.6
21.3
24.0
26.7
27.8
30.0
n.a.
Formal childcare (from 1 to 29 hours; % over the population
aged less than 3 years)
2.0
2.0
5.0
1.0
n.a.
n.a.
n.a.
Formal childcare (30 hours or over; % over the population aged
less than 3 years)
31.0
34.0
32.0
34.0
34.0
n.a.
n.a.
Labour productivity per person employed (annual % change)
-0.2
-0.3
3.4
0.1
0.8
1.6
-0.7
Hours worked per person employed (annual % change)
-0.7
0.0
0.1
-1.2
0.3
0.6
0.9
Labour productivity per hour worked (annual % change;
constant prices)
0.5
-0.3
3.2
1.4
0.5
1.0
-1.6
Compensation per employee (annual % change; constant prices)
0.9
1.3
1.4
-1.6
-1.7
1.2
-1.5
Nominal unit labour cost growth (annual % change)
3.5
3.1
-1.4
-0.9
-3.0
1.9
n.a.
Real unit labour cost growth (annual % change)
1.9
2.2
-2.1
-1.1
-2.7
0.1
n.a.
(1) Unemployed persons are all those who were not employed, but had actively sought work and were ready to begin
working immediately or within two weeks. The labour force is the total number of people employed and unemployed. Data
on the unemployment rate of 2014 includes the last release by Eurostat in early February 2015.
(2) Long-term unemployed are persons who have been unemployed for at least 12 months.
Source: European Commission (EU Labour Force Survey and European National Accounts)
64
B. Standard Tables
Table B.5:
Expenditure on social protection benefits (% of GDP)
2007
2008
2009
2010
2011
2012
Sickness/healthcare
6.4
6.5
7.3
7.0
6.3
6.4
Invalidity
2.3
2.1
2.1
2.1
2.1
1.9
11.3
11.9
12.9
13.1
13.8
13.9
Family/children
1.2
1.3
1.4
1.4
1.2
1.2
Unemployment
1.1
1.0
1.4
1.4
1.4
1.7
Housing and social exclusion n.e.c.
0.0
0.0
0.0
0.0
0.0
0.0
22.6
23.2
25.5
25.4
25.0
25.4
2.1
2.3
2.6
2.5
2.2
2.3
Old age and survivors
Total
of which: means-tested benefits
Social inclusion indicators
2008
2009
2010
2011
2012
2013
1
People at risk of poverty or social exclusion
(% of total population)
26.0
24.9
25.3
24.4
25.3
27.5
Children at risk of poverty or social exclusion
(% of people aged 0-17)
29.5
28.7
28.7
28.6
27.8
31.7
Elderly at risk of poverty or social exclusion
(% of people aged 65+)
27.7
26.0
26.1
24.5
22.2
20.3
At-risk-of-poverty rate2 (% of total population)
18.5
17.9
17.9
18.0
17.9
18.7
Severe material deprivation rate3 (% of total population)
9.7
9.1
9.0
8.3
8.6
10.9
Proportion of people living in low work intensity households4
(% of people aged 0-59)
6.3
7.0
8.6
8.3
10.1
12.2
In-work at-risk-of-poverty rate (% of persons employed)
11.8
10.3
9.7
10.3
9.9
10.5
Impact of social transfers (excluding pensions) on reducing
poverty
25.7
26.3
32.2
29.1
29.2
26.7
4770.3
4725.9
4997.5
4776.7
4565.1
4363.5
123499.0
122959.0
126612.0
124810.0
122848.0
121997.0
23.2
23.6
22.7
23.2
24.1
27.4
6.1
6.0
5.6
5.7
5.8
6.0
Poverty thresholds, expressed in national currency at constant
prices5
Gross disposable income (households)
Relative median poverty risk gap (60% of median equivalised
income, age: total)
Inequality of income distribution (S80/S20 income quintile
share ratio)
(1) People at risk of poverty or social exclusion (AROPE): individuals who are at risk of poverty (AROP) and/or suffering from
severe material deprivation (SMD) and/or living in households with zero or very low work intensity (LWI).
(2) At-risk-of-poverty rate (AROP): proportion of people with an equivalised disposable income below 60 % of the national
equivalised median income.
(3) Proportion of people who experience at least four of the following forms of deprivation: not being able to afford to i) pay
their rent or utility bills, ii) keep their home adequately warm, iii) face unexpected expenses, iv) eat meat, fish or a protein
equivalent every second day, v) enjoy a week of holiday away from home once a year, vi) have a car, vii) have a washing
machine, viii) have a colour TV, or ix) have a telephone.
(4) People living in households with very low work intensity: proportion of people aged 0-59 living in households where the
adults (excluding dependent children) worked less than 20 % of their total work-time potential in the previous 12 months.
(5) For EE, CY, MT, SI and SK, thresholds in nominal values in euros; harmonised index of consumer prices (HICP) = 100 in 2006
(2007 survey refers to 2006 incomes).
(6) 2014 data refer to the average of the first three quarters.
Source: For expenditure for social protection benefits ESSPROS; for social inclusion EU-SILC.
65
B. Standard Tables
Table B.6:
Product market performance and policy indicators
2004-08
2009
2010
2011
2012
2013
2014
1.5
0.2
3.3
0.8
1.6
1.9
n.a.
1
3.2
-2.6
10.0
2.6
4.3
5.8
n.a.
1
n.a.
n.a.
n.a.
n.a.
n.a.
n.a.
na
1
0.5
-2.1
-2.3
3.1
5.0
3.0
n.a.
n.a.
n.a.
n.a.
n.a.
n.a.
n.a.
n.a.
0.8
-2.8
-5.0
3.9
0.1
-3.0
n.a.
0.0
0.0
0.0
0.0
n.a.
n.a.
n.a.
Labour productivity1 in total economy (annual growth in %)
Labour productivity in manufacturing (annual growth in %)
Labour productivity in electricity, gas (annual growth in %)
Labour productivity in the construction sector (annual growth in %)
Labour productivity1 in the wholesale and retail sector (annual growth
in %)
1
Labour productivity in the information and communication sector
(annual growth in %)
Patent intensity in manufacturing2 (EPO patent applications divided
by gross value added of the sector)
Policy indicators
2004-08
3
Enforcing contracts (days)
3
Time to start a business (days)
R&D expenditure (% of GDP)
Total public expenditure on education (% of GDP)
2009
2010
2011
2012
2013
2014
577
547
547
547
547
547
547
28.5
5
5
4
4
3
3
1.0
1.6
1.5
1.5
1.4
1.4
n.a.
5.1
5.8
5.6
5.3
n.a.
n.a.
n.a.
2008
1.69
2009
n.a.
2010
n.a.
2011
n.a.
2012
n.a.
2013
1.29
2014
n.a.
4
3.97
n.a.
n.a.
n.a.
n.a.
1.83
n.a.
4
3.08
n.a.
n.a.
n.a.
n.a.
2.92
n.a.
2.55
2.55
2.37
2.31
2.31
2.18
n.a.
(Index: 0=not regulated; 6=most regulated)
4
Product market regulation , overall
Product market regulation , retail
Product market regulation , professional services
4
Product market regulation , network industries
5
(1) Labour productivity is defined as gross value added (in constant prices) divided by the number of persons employed.
(2) Patent data refer to applications to the European Patent Office (EPO). They are counted according to the year in which
they were filed at the EPO. They are broken down according to the inventor’s place of residence, using fractional counting
if multiple inventors or IPC classes are provided to avoid double counting.
(3) The methodologies, including the assumptions, for this indicator are presented in detail here:
http://www.doingbusiness.org/methodology.
(4) Index: 0 = not regulated; 6 = most regulated. The methodologies of the OECD product market regulation indicators are
presented in detail here: http://www.oecd.org/competition/reform/indicatorsofproductmarketregulationhomepage.htm
(5) Aggregate OECD indicators of regulation in energy, transport and communications (ETCR).
Source: European Commission; World Bank — Doing Business (for enforcing contracts and time to start a business); OECD (for
the product market regulation indicators)
66
B. Standard Tables
Table B.7:
Green growth
Green growth performance
Macroeconomic
Energy intensity
Carbon intensity
Resource intensity (reciprocal of resource productivity)
Waste intensity
Energy balance of trade
Energy weight in HICP
Difference between energy price change and inflation
Ratio of environmental taxes to labour taxes
Ratio of environmental taxes to total taxes
Sectoral
Industry energy intensity
Share of energy-intensive industries in the economy
Electricity prices for medium-sized industrial users**
Gas prices for medium-sized industrial users***
Public R&D for energy
Public R&D for the environment
Recycling rate of municipal waste
Share of GHG emissions covered by ETS*
Transport energy intensity
Transport carbon intensity
Security of energy supply
Energy import dependency
Diversification of oil import sources
Diversification of energy mix
Renewable energy share of energy mix
2003-2007
2008
2009
2010
2011
2012
kgoe / €
kg / €
kg / €
kg / €
% GDP
%
%
ratio
ratio
0.17
0.54
1.25
n.a.
-3.3
8.5
1.5
24.3%
9.2%
0.16
0.49
1.43
0.23
-4.8
9.9
1.8
20.3%
7.8%
0.16
0.48
1.31
n.a.
-2.9
10.9
1.3
19.3%
8.1%
0.15
0.45
1.21
0.11
-3.5
11.7
4.5
18.9%
7.9%
0.15
0.44
1.24
n.a.
-4.3
12.7
6.6
17.0%
7.1%
0.15
0.45
n.a.
0.09
-4.8
13.8
10.9
16.3%
6.7%
kgoe / €
% GDP
€ / kWh
€ / kWh
% GDP
% GDP
ratio
%
kgoe / €
kg / €
0.24
9.2
n.a.
n.a.
n.a.
n.a.
35.3%
n.a.
1.21
3.32
0.22
9.3
0.09
0.03
0.01
0.02
35.5%
38.3
1.07
2.80
0.23
8.4
0.09
0.03
0.02
0.03
39.2%
37.7
1.12
2.95
0.22
9.3
0.09
0.03
0.02
0.03
38.0%
34.2
1.09
2.83
0.21
9.2
0.10
0.04
0.02
0.03
41.1%
36.1
1.01
2.58
0.19
n.a.
0.11
0.04
0.02
0.03
45.6%
36.8
n.a.
n.a.
%
HHI
HHI
%
84.7
0.06
n.a.
15.3
83.4
0.06
0.35
17.0
81.4
0.06
0.33
19.1
75.1
0.07
0.35
22.5
77.6
0.07
0.32
21.7
79.5
0.09
0.29
19.8
Country-specific notes:
2013 is not included in the table due to lack of data.
General explanation of the table items:
All macro intensity indicators are expressed as a ratio of a physical quantity to GDP (in 2000 prices)
Energy intensity: gross inland energy consumption (in kgoe) divided by GDP (in EUR)
Carbon intensity: Greenhouse gas emissions (in kg CO2 equivalents) divided by GDP (in EUR)
Resource intensity: Domestic material consumption (in kg) divided by GDP (in EUR)
Waste intensity: waste (in kg) divided by GDP (in EUR)
Energy balance of trade: the balance of energy exports and imports, expressed as % of GDP
Energy weight in HICP: the proportion of "energy" items in the consumption basket used for the construction of the HICP
Difference between energy price change and inflation: energy component of HICP, and total HICP inflation (annual % change)
Environmental taxes over labour or total taxes: from DG TAXUD’s database ‘Taxation trends in the European Union’
Industry energy intensity: final energy consumption of industry (in kgoe) divided by gross value added of industry (in 2005 EUR)
Share of energy-intensive industries in the economy: share of gross value added of the energy-intensive industries in GDP
Electricity and gas prices for medium-sized industrial users: consumption band 500–2000MWh and 10000–100000 GJ; figures excl. VAT.
Recycling rate of municipal waste: ratio of recycled municipal waste to total municipal waste
Public R&D for energy or for the environment: government spending on R&D (GBAORD) for these categories as % of GDP
"Proportion of GHG emissions covered by ETS: based on greenhouse gas emissions (excl LULUCF) as reported by Member States to the
European
Environment Agency "
Transport energy intensity: final energy consumption of transport activity (kgoe) divided by transport industry gross value added (in
2005 EUR)
Transport carbon intensity: greenhouse gas emissions in transport activity divided by gross value added of the transport sector
Energy import dependency: net energy imports divided by gross inland energy consumption incl. consumption of international bunker
fuels
Diversification of oil import sources: Herfindahl index (HHI), calculated as the sum of the squared market shares of countries of origin
Diversification of the energy mix: Herfindahl index over natural gas, total petrol products, nuclear heat, renewable energies and solid
fuels
Renewable energy share of energy mix: %-share of gross inland energy consumption, expressed in tonne oil equivalents
* European Commission and European Environment Agency
** For 2007 average of S1 & S2 for DE, HR, LU, NL, FI, SE & UK. Other countries only have S2.
*** For 2007 average of S1 & S2 for HR, IT, NL, FI, SE & UK. Other countries only have S2.
Source: European Commission unless indicated otherwise; European Commission elaborations indicated below
67
Download