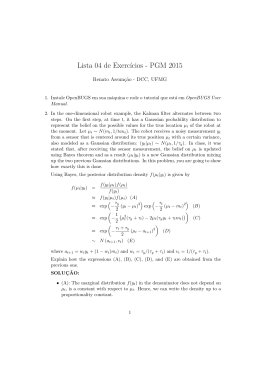
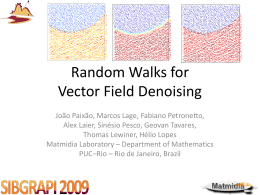
REGRESSION MODELS WITH RESPONSES ON THE UNIT
INTERVAL: SPECIFICATION, ESTIMATION AND COMPARISON
Wagner Hugo BONAT 1
Paulo Justiniano RIBEIRO JR 1
Walmes Marques ZEVIANI 1
ABSTRACT: Regression models are widely used on a diversity of application areas to
describe associations between explanatory and response variables. The initially and
frequently adopted Gaussian linear model was gradually extended to accommodate
different kinds of response variables. These models were latter described as particular
cases of the generalized linear models (GLM). The GLM family allows for a diversity
of formats for the response variable and functions linking the parameters of the
distribution to a linear predictor. This model structure became a benchmark for
several further extensions and developments in statistical modelling such as generalized
additive, overdispersed, zero inflated, among other models. Response variables with
values restricted to an interval, often (0, 1), are usual in social sciences, agronomy,
psychometrics among other areas. Beta or Simplex distributions are often used although
other options are mentioned in the literature. In this paper, a generic structure is used to
define a set of regression models for restricted response variables, not only including the
usually assumed formats but allowing for a wider range of models. Individual models are
defined by choosing three components: the probability distribution for the response; the
function linking the parameter of the distribution of choice with the linear predictor; and
the transformation function for the response. We report results of the analysis of four
different datasets considering Beta, Simplex, Kumaraswamy and Gaussian distributions.
For the link and transformation functions the logit, probit, complementary log-log,
log-log, Cauchit and Aranda-Ordaz are considered. Likelihood based analysis for model
fitting, comparison and model choice are carried out on a unified way and a computer
code is made available. Results show there is no prominent model within this class
highlighting the importance of investigating a wide range of models for each problem at
hand.
1 Departamento
de Estatı́stica - DEST, Laboratório de Estatı́stica e Geoinformação - LEG,
Universidade Federal do Paraná - UFPR, CEP: 81531-990, Curitiba, Paraná, Brasil, E-mail:
wagner,paulojus,[email protected]
Rev. Bras. Biom., São Paulo, v.20, n.1, p.1-10, 2013
1
KEYWORDS: maximum likelihood ; restricted variables ; proportions ; indexes ; rates.
1
Introduction
Widespread modelling by statistical regression started with the classic linear
Gaussian model as the main tool to investigate relations between a response variable
with possible explanatory variables. Despite of being largely used, the model has
severe limitations for non Gaussian responses for which other models were gradually
developed. Nelder & Wedderburn (1972) and McCullagh & Nelder (1989) are
benchmarks for advances in regression models, unifying several model specifications
under the flexible class of generalised linear models (GLM).
It is possible to build appropriate models for different types of responses such
as binary, count, polytomous and continuous variables under the GLM structure.
It is also possible to model both, the mean and the dispersion parameters as
function of covariates. Starting from the explicit specification of a model within
this class, generic forms for the likelihood function follows directly, allowing for
standard point and interval estimation and the construction of hypothesis tests and
model comparison measures. In summary, all the elements needed for the practice
of statistical modelling.
Although flexible, the GLM’s have limitations for response variables with
values confined within an interval (a, b), usually the unity (0, 1) interval. Such kind
of data is common to several areas. Examples in social sciences include indexes
such as human development, life quality and measures of well-being. For such
situations values of an observable or latent scale are bounded below and above.
Latent variables such as IQ, degree of agreement with an opinion and level of
skills are common in psychometrics’ tests. Yet another example is the case of
a continuous proportion of a whole, such as the percentage of the budget spent
with food, one of the examples considered here. Crop or tissue disease levels are
expressed as percentages in agronomic sciences. Response variables restricted to
the (a, b) interval can always be represented in the unity interval for the analysis
with results expressed back in the original scale if necessary.
Extended forms of GLM’s are proposed in the literature. Kieschinick &
McCullough (2003) revises alternative model building approaches for responses
on restricted intervals. They consider the classical linear regression model, which
ignores the natural restriction and the heterocedasticity, the restricted domain Beta
and Simplex models and semi-parametric models estimated by quasi-likelihood
methods. Based on the analysis of real data they consider the Beta regression
as a standard choice. Ferrari & Cribari-Neto (2004) provides a more detailed
mathematical and computational description of the Beta regression model including
the analysis of residuals. Further developments follows in the literature. Mean and
dispersion modelling is adopted by Cepeda & Gamerman (2005) and Simas et al.
(2010). Analysis of residuals and diagnostics are presented by Espinheira et al.
(2008a), Espinheira et al. (2008b) and Rocha & Simas (2010). Bias correction
2
Rev. Bras. Biom., São Paulo, v.20, n.1, p.1-10, 2013
for maximum likelihood estimators are presented by Vasconcellos & Cribari-Neto
(2005), Ospina et al. (2006, 2011) and Simas et al. (2010). Branscum et al. (2007)
uses Bayesian inference under Beta models for assessing virus genetic distances.
Smithson & Verkuilen (2006) consider Beta models on a psychometric study. Beta
mixture models are discussed by Verkuilen & Smithson (2011). Lima (2007) adapts
the RESET test for linear model specification to Beta regression.
The Beta regression model is implemented by the betareg (Cribari-Neto &
Zeileis, 2010) package for the R software (R Development Core Team, 2013).
Extended functionalities are described by Grün et al. (2011) including bias
corrections, recursive partitioning and finite mixture models. McKenzie (1985),
Grünwald et al. (1993) and Rocha & Simas (2010) provide further developments
for time series analysis. Da-Silva et al. (2011) presents a Bayesian dynamic Beta
for modelling and forecasting Brazilian unemployment rates. Bonat et al. (2013)
includes random effects to model dependence structures which occur in repeated
measures and longitudinal studies, among others.
Despite the dissemination of Beta regression, there are few comparisons with
alternative and less adopted approaches such as the Simplex (Miayshiro, 2008), the
Kumaraswamy (Lemonte et al., 2013) or even the Gaussian model for transformed
responses. An example of the latter is the logit transformation of data to the (0, 1)
interval which return values on the real line and then modelled by the Gaussian
distribution. McCullagh & Nelder (1989, pg. 378) briefly discuss the differences
between specifying Gaussian models for transformed responses versus adopting
other probabilities distributions. The transformation is required to ensure additive
effects and constant variance, however uniqueness and existence of transformation
cannot be guaranteed.
GLM offers an attractive option accommodating both, structures for covariate
effects and mean variance relationships determined by the choice of the probability
distribution for the response. The classical Box-Cox (Box & Cox, 1964) family
defines power transformations which are not directly applicable to responses on
restricted intervals. Another possibility is its usage as a link function for a GLM.
We follow a specification for regression models for responses on the unity
interval which is generic in the sense that previously mentioned models are
particular cases. Under this generic form we present and compare different model
specifications. We show that a wide class of models can be considered under
a common framework instead of adopting a particular choice of model for data
analysis. Based on likelihood estimation we compare models for real data from
agronomic and social sciences. Specification of each individual model consists of
choices for the tree basic components in the generic model format. Combining
them allows for a diversity of options for distribution of the response variable and
relations with the covariates, including non-linear models.
The generic specification is presented in the next Section. It is followed by the
analysis of the case studies on different contexts and focusing on model comparisons.
We conclude with a general discussion and recommendations for the practice of data
analysis and point some possible future directions.
Rev. Bras. Biom., São Paulo, v.20, n.1, p.1-10, 2013
3
2
Model specification
Assume the following model format for independent response variables Yi :
T (Yi |xi ; λ) ∼ d(µi , φ)
(1)
µi = f (xi , βx ; δ)
where xi is a vector of covariates associated to the ith observation and
θ = (λ, φ, βx , δ) are model parameters.
An individual model is defined by choices of functions d(·), T (·) and f (·). The
first defines a two parameter probability distribution for the response variable. The
location parameter µi is typically the expectation or median of the response variable
or, more generally, any quantity to be related to the covariates. The dispersion
parameter φ is simply regarded here as an extra parameter in the likelihood,
though more generally may also be modelled by covariates. Choices for d(·) imposes
restrictions on possible choices for the remaining functions.
The second, T (·), defines a transformation of the response and the function
can be indexed by a shape parameter λ. This function is required to have a (0, 1)
domain and counter-domain compatible with d(·). The link function f (·) depends
on a (vector) parameter βx associated to the covariates and a shape parameter δ.
This function has a real domain to allow for any value for the covariates and counter
domain in the parameter space of µi . For simplicity we assume that T (·) and f (·)
are monotone and twice differentiable.
The likelihood funtion for a given random sample has the form:
n
Y
∂T (Yi |xi , λ) .
d(f (xi , βx , δ), φ) (2)
L(θ; y) =
∂Y
i
i=1
Parameter estimates of θ = (βx , δ, λ, φ) are obtained by maximization of (2). The
likelihood function is also used to obtain confidence intervals with usual options
of quadratic approximation (Wald type) or profiled likelihoods. The likelihood is
a measure of compatibility of the model with the actual data and can be used to
compare choices for T (·), d(·) and f (·). Under general conditions, models with the
same dimension, i.e. same number of parameters, can be directly compared by the
maximised values of the likelihoods whereas nested models can be compared by
likelihood ratio tests. Otherwise, alternative criteria such as the Akaike’s (AIC) or
BIC can be used for model comparison and choice.
Expressions for the score function, observed and expected information are
obtained from (2) for each particular model specification. Closed expressions
for estimating the parameters in θ cannot be obtained in general and, for some
cases, even expressions for the gradient and hessian functions are not available.
Maximisation of (2) usually requires numerical methods and algorithms must be
carefully calibrated to ensure convergence.
Algorithms1 implemented in the R language (R Development Core Team, 2013)
are used for the analyses reported here and follows principles described by Bonat
1 available
4
at http://www.leg.ufpr.br/papercompanions/regression01
Rev. Bras. Biom., São Paulo, v.20, n.1, p.1-10, 2013
et al. (2012). A function is defined to return log-likelihood values for the general
model format. Maximization uses R’s native algorithms in the function optim().
The general strategy is to use the BFGS algorithm (Byrd, 1995) combined with the
SANN Simulated Annealing (Belisle, 1992) for cases of difficulties with convergence.
Such strategy proved satisfactory for the analysis reported here. After convergence,
standard errors and confidence intervals can be obtained. Likelihood is profiled
for different combinations of parameters. Profiled based likelihood intervals are
in general more realistic than those based on quadratic approximations and their
computations provide a check for the likelihood maximization.
2.1
Model specifications
With appropriate choices for each of the components in the generic model
structure (1) it is possible to specify usual models such as the logit link Beta
regression and the more recently proposed Kumaraswamy with complementary
log-log link.
Four options are considered here for the responses’ distribution d(·): Gaussian,
Beta, Simplex and Kumaraswamy (Kw), all parametrised with a location parameter
µ to be related to the covariates with E[Yi ] = µi for the former three and md[Yi ] = µi
for the latter. The densities are:
• Gaussian: d(y; µ, φ) =
• Beta: d(y; µ, φ) =
√1
2πφ
exp{− 2φ1 2 (y − µ)2 } ;
Γ(φ)
µφ−1
(1
Γ(µφ)Γ((1−µ)φ) y
− y)(1−µ)φ−1 ;
n
n
oo
(y−µ)2
• Simplex : d(y; µ, φ) = (2πφ2 {y(1 − y)3 })−1/2 exp − 2φ1 2 y(1−y)µ
;
2 (1−µ)2
• Kumaraswamy (Kw): d(y; µ, φ) =
φ ln(1−0.5) φ−1
y
(1
ln(1−µφ )
ln(1−0.5)
− y φ ) ln(1−µφ )
−1
.
The Beta, Simplex and Kumaraswamy are defined for y, µ ∈ (0, 1), whereas for
the Gaussian y, µ ∈ <, with φ > 0. Even with f (·) mapping to the unity interval,
the Gaussian does not consider the data being bounded above and below. Even
though, this is a frequently choice in the literature as, for instance, models for plant
disease progress.
The function T (·) (0, 1) 7→ R can be chosen to ensure transformed responses
in the unity interval. Six options are considered here:
y
• logit: T (y) = ln 1−y
;
• probit: T (y) = Φ(y), with Φ(·) denoting the cumulative Gaussian density;
• complementary log-log: T (y) = ln(− ln(1 − y));
• log-log: T (y) = − ln(− ln(y));
• cauchit: T (y) = tan(π · (y − 1/2)) ;
Rev. Bras. Biom., São Paulo, v.20, n.1, p.1-10, 2013
5
• Aranda-Ordaz : T (y; λ) = ln
n
(1−y)−λ −1
λ
o
, com λ > 0.
Even though the function T (·) is a function of the response Y whereas the
inverse of f (·) is a function of µi , it is possible to adopt the same functional form
since both Y, µ ∈ (0, 1). We therefore consider the inverse forms of the above
function as the choices for f (·).
A total for 30 possible models are defined by combining the above choices
for d(·), T (·), f (·). Six are defined by options for T (·) assuming the Gaussian
distribution for the transformed responses and the identity link function. The
remaining 24 are given by the combination of the six options for the identity f (·)
and the four options for d(·). For such cases T (·) is the identity function. All these
30 models are fitted in the following four case studies.
3
Results
3.1
Curitiba’s interurban life quality index - IQVC
The interurban life quality index of the municipality of Curitiba (IQVC,
acronym in Portuguese) results from 18 indicator, split in 5 thematic areas: housing,
health, education, security and transportation. The index is built based on the
UN’s human development index (IDH)2 and values are expressed within the unity
interval. The higher the index, the better is considered to be the life quality on a
given district. The data come from the 2000’s census microdata provided by IBGE3
(the Brazilian agency for population studies) and processed by Curitiba’s Institute
for Urban Planning (IPPUC).
The objective of the analysis is to relate the IQVC mean income of the district,
expressed by multiples of official minimum wage at the time. This is a simple
data structure with a response on the unity interval and a continuous covariate
for the 75 districts for Curitiba. Table 1 provides the log-likelihoods for the 30
models described in Section 2. Table columns correspond to the options for the
link functions f (·) and options for d(·) are on table rows, except for the last which
provides values for the choices of T (·).
Most of the proposed models have the same number of parameters and can be
directly compared by the log-likelihoods. The exceptions are for the models with the
Aranda-Ordaz link or transformation functions with one extra parameter. Models
with logit link function are particular cases of the Aranda-Ordaz setting λ = 1.
Overall, better fits are obtained choosing Kw for d(·) and cauchit for f (·). The
former is better for all choices of link function whereas the latter is better fitted for
all distributions for the responses. The choice of the link function has less impact
on the log-likelihoods.
The transformed models are clearly worse in all cases. The probit option for
T (·) provides the best fit among the transformed models, with likelihood values
2 http://hdr.undp.org/en/humandev/
3 http://www.ibge.gov.br
6
Rev. Bras. Biom., São Paulo, v.20, n.1, p.1-10, 2013
Table 1 - Log-likelihoods for the fitted models with choices for the link (columns),
distribution (rows) and transformation (last row) - IQVC.
Link or transformation function
Distributions
Logit Probit Cloglog Loglog Cauchit Aranda
Beta
56.84 56.14
54.18
57.75
59.34
58.47
Gaussian
57.19 56.74
55.40
57.78
58.71
58.20
Kw
60.49 60.04
58.48
61.36
62.17
62.16
Simplex
51.57 50.76
48.73
52.94
55.87
54.29
trans-Gaussian 54.79 54.95
52.95
53.01
46.68
54.85
Table 2 - Point estimates and standard errors for models with cauchit link or
transformation (last column) - IQVC.
Probability distribution
Effects
Beta
Gaussian
Kw
Simplex trans-Gaussian
Intercept -0.53(0.11) -0.57(0.10) -0.59(0.10) -0.57(0.09)
-0.56(0.14)
Income
7.82(0.93) 8.51(1.08) 8.67(1.15) 8.99(1.19)
8.99(1.08)
closer to the obtained for the Aranda-Ordaz and its particular case, the logit.
Table 2 provides the coefficient’s point estimates and associated standard
errors for the options of d(·) and with the cauchit as the link or transformation
function. The income was divided by 100 for easier visualisation of the coefficients.
Results shows similar values for all cases with slightly different values for the Beta
distribution.
0,1
0,8
IQVC
●
0,6
0,4
0,1
0,2
0,3
Kw
Simplex
trans−Gaussian
● ●
● ●●
●
● ●●
●●
●
●
● ●
●
●●
● ●
● ●●
●
● ●●
●●
●
●
● ●
●
●●
● ●
● ●●
●
● ●●
●●
●
●
● ●
●
●●
● ●
● ●●
●
● ●●
●●
●
●
● ●
●
●●
● ●
● ●●
●
● ●●
●●
●
●
● ●
●
●●
●
●
●
●
●
●● ●
●
●●
●●
●
●
●●
●
●
● ●●●
●
●●
●
●●● ●
●●●●
●
●
●
●
●
●●
●
●
●●●
●
●
0,3
Gaussian
●
●
●
0,2
0,2
Beta
●
●
●
●
●
●
●● ●
●
●●
●●
●
●
●●
●
●
● ●●●
●
●●
●
●●● ●
●●●●
●
●
●
●
●
●●
●
●
●●●
●
●
●
●
0,1
0,2
0,3
●
●
●
●
●
●
●
●
●● ●
●
●●
●●
●
●
●●
●
●
● ●●●
●
●●
●
●●● ●
●●●●
●
●
●
●
●
●●
●
●
●●●
●
●
●
●
●
●
●
●
●
●
●
●
●● ●
●
●●
●●
●
●
●●
●
●
● ●●●
●
●●
●
●●● ●
●●●●
●
●
●
●
●
●●
●
●
●●●
●
●
●
●
0,1
0,2
0,3
●
●
●
●
●
●
●
●
●● ●
●
●●
●●
●
●
●●
●
●
● ●●●
●
●●
●
●●● ●
●●●●
●
●
●
●
●
●●
●
●
●●●
●
●
●
●
●
●
●
0,1
0,2
0,3
Income
Figure 1 - Original data and predicted IQVC as functions of the income for models
on Table 2.
Figure 1 shows the fitted models with prediction bands superimposed on
the observed data. Predicted values are visually alike for the different models.
Confidence bands are close to symmetric for the transformed model, with subtle
Rev. Bras. Biom., São Paulo, v.20, n.1, p.1-10, 2013
7
Table 3 - Log-likelihoods for models with different distributions and link functions
and transformed models (last row) - Food Expenditure.
Link or transformation function
Distribution
Logit Probit Cloglog Loglog Cauchit Aranda
Beta
45.33 45.09
45.77
44.55
46.96
47.51
Gaussian
45.80 45.50
46.34
44.78
47.68
47.87
Kw
48.88 48.65
49.25
48.10
50.19
50.51
Simplex
45.60 45.43
45.90
45.04
46.78
47.40
trans-Gaussian 45.22 45.27
45.00
44.77
41.41
45.22
Table 4 - Point estimates and standard errors for models with cauchit link or
transformation (last column) - Food Expenditure.
Probability distribution
Effects
Beta
Gaussian
Kw
Simplex
trans-Gaussian
Intercept -0.50(0.21) -0.53(0.21) -0.71(0.19) -0.54(0.24)
-0.51(0.31)
Budget
-14.15(3.23) -14.96(3.19) -10.54(2.36) -12.68(3.19)
-12.85(4.12)
Residents 13.50(3.58) 15.17(3.48) 14.48(2.86) 12.55(3.69)
10.13(4.83)
differences. The differences in log-likelihoods, parameter estimates, standard errors
and predicted values allow for the overall conclusion the models do not differ
substantially and that the model choice has little impact, if any, on practical
conclusions.
3.2
Food expenditure
This second example revisits the food expenditure data analysed by Ferrari
and Cribari-Neto (2004) when introducing the Beta regression model. The data
consists of a sample of 38 family economies from a US large city and is available as
the FoodExpenditure object in the betareg package (Cribari-Neto e Zeileis, 2010).
Table 3 shows log-likelihood values for the 30 models with the percentage of
family budget as the response variable and the total family income and number
of residents as covariates. The Kw distribution and cauchit link have higher loglikelihood values and combined provide the better fit overall. Larger differences in
log-likelihoods were found between the distributions for the response variable.
Table 4 provide parameter estimates and associated standard errors for the
different choices for d(·) combined with the logit link function. Total income values
were divided by 100 for better display of the coefficients. The model intercept is
higher for the Kw distribution and with the smallest standard error. Coefficients
associated with the covariate number of residents shows larger variation among the
choices for d(·). Estimates varies from 10.13 for the transformed model, to 15.17 for
the Gaussian model, a difference of 49.75%. The estimate under the Kw is 14.482
and a standard error of 2.857, the smallest among all the distributions.
8
Rev. Bras. Biom., São Paulo, v.20, n.1, p.1-10, 2013
Figure 2 shows the original data and the models for each of the 7 possible
values for the number of residents. All models have the cauchit as the choice for
link or transformation function. The model with Kw distribution follows the data
more closely, in particular when residents number equals 6. Confidence bands are
narrower, reflecting the smaller standard error.
0,04
Beta
0,06
0,08
0,04
Gaussian
●
Kw
●
0,06
0,08
Simplex
●
trans−Gaussian
●
●
●
●
Gaussian
●
●
●
●
●
Simplex
●
●
0.06
0.06
●
●
Kw
trans−Gaussian
●
●
●
●
●
0,5
●
0.06
Beta
0.07
0.07
0.07
●
0,1
0.06
0,2
0.06
0,3
0.07
0,4
0.07
0,5
●
0,4
●
0,3
0,2
Beta
●
Gaussian
●
Kw
●
Simplex
●
0,1
trans−Gaussian
●
●
●
●●
●
●
●
●●
●●
●
●
●●
●
●
Kw
●
●
●
●
Gaussian
●
●
●
●
Beta
●
●
●
●
0,1
●
Simplex
trans−Gaussian
●
●
● ●
●
●
Beta
●
● ●
●
●
●
Gaussian
0,4
0.04
●
● ●
0.04
● ●
0.04
0.04
0,5
0.04
Food expenditure
●
●
0.05
●●
0.05
●
0,2
0.05
0,3
0.05
0,4
0.05
0,5
● ●
Kw
●
0,3
●
●
●
Simplex
●
0,2
●
0,1
trans−Gaussian
●
●
●
●
●
●
0,1
●
●
●
●
●
●
●
●
●
●
Beta
●
●
●
●
●
●
Gaussian
●
●
●
0.03
●
0.03
●
●
0,2
0.03
0,3
0.03
0,4
0.03
0,5
●
●
●
●
●
●
●
Kw
●
●
●
●
●
Simplex
trans−Gaussian
●
●
●
Beta
●
●
●
Gaussian
●
●
●
●
●
● ●
●
Kw
●
●
0,4
0.02
●
●
●
● ●
0.02
●
●
●
● ●
0.02
0.02
0.02
0,5
●
●
● ●
●
●
●
● ●
●
Simplex
●
●
0,3
●
●
trans−Gaussian
0,2
0,1
●●
●
●
●
●
●●
●●
0.01
●
0.01
●
0,2
0.01
0,3
0.01
0,4
0.01
0,5
●
●
●
●
●●
●●
0,1
0,04
0,06
0,08
0,04
0,06
0,08
0,04
0,06
0,08
Total budget
Figure 2 - Original data and predictions of food expenditure as function of budget
and number of residents for models on Table 4.
3.3
Brazilian industry workers’ life quality index - IQVT
The Brazilian industry worker’s life quality index (IQVT, acronym in
Portuguese) combines 25 indicators from eight thematic areas: housing, health,
education, integral health and workplace safety, development of skills, attributed
Rev. Bras. Biom., São Paulo, v.20, n.1, p.1-10, 2013
9
Table 5 - Log-likelihoods for models with different distributions and link functions
and transformed models (last row) - IQVT.
Link or transformation functions
Distribuições
Logit Probit Cloglog Loglog Cauchit Aranda
Beta
567.03 566.87 566.23 567.39 567.77 567.68
Gaussian
564.34 564.20 563.63 564.65 564.98 564.88
Kw
564.81 564.67 564.06 565.27 565.71 565.79
Simplex
568.72 568.53 567.77 569.15 569.63 569.50
trans-Gaussian 568.63 567.64 561.31 572.28 573.90 574.54
value to work, corporate social responsibility, participation and stimulus to
performance. The index is constructed following premisses of the united nations
human development index4 . Values are expressed in the unity interval and, the
closer to one, the higher the industry worker’s life quality.
A pool was conducted in the year 2010 by the Industry Social Service5 in order
to assess worker’s life quality in the Brazilian industries. The survey included 365
companies from nine out of the 27 Brazilian federative units. IQVT was computed
for each company from questionnaires applied to workers, following a sampling
design. Companies provided additional questionnaire information on the budget for
social benefits and other quality of life related initiatives.
For the current analysis, a suitable model is aimed to assess whether IQVT
varies according to two company related covariates: company’s average income and
federative unity - FU. The first expressing the capacity to fulfil workers basic needs
such as food, health, housing and education and is simply the total of salaries
divided by the number of the industry’s workers. The federative unit where the
company is located is expected to be influential due to varying local legislations,
taxing and further economic and local political conditions.
The data consists of a response variable expressed in the unity interval (IQVT)
and two covariates, one continuous (income) and one categorical (FU ) with State
of Amazon as the reference level in the parametrisation.
Log-likelihood for the fitted models are presented in Table 5. Higher loglikelihoods were obtained for the log-log, cauchit and Aranda-Ordaz transformed
response models. Simplex models are the best fitted among the other distributions.
The complementary log-log transformation has the worse results, with the lower
log-likelihood among all considered models. The log-likelihoods are more variable
for this example in comparison with the previous, ranging from 561.30 to 574.54,
implying the model fit is more sensitive to the choice of model. In contrast with
the previous examples the choices for T (·) and f (·) have now impacted the choices
of d(·).
The Aranda-Ordaz response transformed model has the highest log-likelihood
(574.54) with one extra parameter and a difference of only 0.64 in log-likelihood
4 http://hdr.undp.org/en/humandev/
5 Serviço
10
Social da Indústria - SESI
Rev. Bras. Biom., São Paulo, v.20, n.1, p.1-10, 2013
Table 6 - Point estimates and standard errors for models with cauchit link or
transformation (last column) - IQVT.
Probability distributions
Coefficients
Beta
Gaussian
Kw
Simplex trans-Gaussian
Intercept
-0.02(0.04) -0.03(0.04) 0.01(0.03) -0.02(0.04)
-0.01(0.04)
Income
3.27(0.29) 3.31(0.31) 3.11(0.26) 3.24(0.27)
3.26(0.26)
CE
0.03(0.04) 0.03(0.04) 0.02(0.03) 0.03(0.04)
0.03(0.04)
DF
-0.24(0.04) -0.24(0.04) -0.20(0.03) -0.24(0.04)
-0.25(0.04)
MT
-0.10(0.04) -0.10(0.04) -0.08(0.03) -0.10(0.04)
-0.10(0.04)
MS
0.02(0.04) 0.02(0.04) 0.01(0.03) 0.01(0.04)
0.02(0.04)
PA
0.11(0.04) 0.11(0.04) 0.09(0.03) 0.11(0.04)
0.11(0.04)
PR
0.01(0.03) 0.01(0.03) 0.01(0.03) 0.01(0.03)
0.01(0.03)
RO
-0.20(0.05) -0.20(0.05) -0.11(0.04) -0.20(0.05)
-0.19(0.05)
RR
-0.15(0.05) -0.15(0.05) -0.14(0.04) -0.15(0.05)
-0.16(0.06)
when compared with the response transformed cauchit model. The cauchit is the
best choice among options for link or transformation function. Models with the
cauchit link have higher log-likelihoods for Beta, Simplex and Gaussian distribution.
Point estimates and standard errors are shown in Table 6. The effects differ
in magnitude but conclusions about significance are the same for all models. The
covariate income is expressed in thousand of reais, the local currency. Estimated
coefficient values are similar for different models with larger differences for the Kw
distribution, the only one with a positive value for the intercept and slightly smaller
value for the coefficient of income. Effects of the federative units are smaller under
the Kw. Less clear are the patterns of standard errors. Under the Kw estimates are
−0.115 for RO and around −0.19 to −0.20 for other federative units, a substantial
difference.
Figure 3 shows original data and fitted curves for the models listed on Table 6
without noticeable differences, even with the larger differences in the log-likelihoods
obtained for the considered models.
3.4
Progress of Plant disease
Alves (2012) describes a field study on the temporal progress of peach rust
incidence (Tranzschelia discolor ). The experimental units consist of 11 trees, each
one from a different cultivar. Total numbers of leaves and number of infected leaves
were recorded for six stems per plant fortnightly between November and April
during two consecutive years. The number of days (dia) since the beginning of
the monitoring was also recorded.
Gaussian non-linear models are widely used to fit disease progress curves. The
logistic, monomolecular and Gompertz models (Spósito et al., 2004) are the most
frequently adopted in the literature. The tree models can be specified under the
general model format considered here choosing the link function f (·) as the logit for
Rev. Bras. Biom., São Paulo, v.20, n.1, p.1-10, 2013
11
●
●
DF
●
●
●●
●
●
●
●●
● ●
●●●
●●
●●
●●●
●
●●
●
●●
● ●
●
0,4
● ●
●
●
●
●
●
●
●● ●
●
●
● ●
●
●
●
●●
●
●
●
●●
●
●
●
●●
●●●●
●
●
●
●
●
●
●
●
●
●●● ●
● ●
●
●●●
● ●●
●
●●
●●●●
●
● ●
●
●
●●
●
●●
●●
●
●● ●
●
●
●
●
●
● ●
●
●●
●●●●
●
●●
●●
●
●●
●●●
●●
●
●
●
●
●
●
●
●
●
●
●●
●
●
●
PB
● ●
● ●
●●
●●●●
●
●
●●
●●
●
●●
●●●
●
●
●
●
●
●
●●
●
●
●
●
●●
●
●
●
●
RO
●
●
RR
Simplex
Simplex
●
●
0,7
●
●●
●
0,6
●
●
●
●
●● ●
●
0,5
●
0,4
RO
●
RR
●
●
●
●
Kw
Kw
●●
●
●●●
●●●
●
●●
● ●
●
●
●
●
●
●
●
●● ●
●
●
RO
●
RR
●
●
●
●
●●●
●●●
●
●●
● ●
●
●
0,7
●
●●
●
0,6
●
●
●
●
●● ●
●
0,5
●
PR
●
●
●
●●
●●●● ●●
●●●
●●
●
●●●
●
●●●
●
● ●
●
●
●
●●●
●
●
●
●
● ●
●
●
●
●●
●
●
●
●
●
●
●●●
●●● ●●
●●
●
●
●
●
●●
●
●
●●
●
●
●
●
●● ●
●
●
●
●●●
●●●
●
●●
● ●
PR
●
●
●
●●
●●●● ●●
●●●
●●
●
●●●
●
●●●
●
● ●
●
●
●
●●●
●
●
●
●
● ●
●
●
●
●●
●●
●
●
●●
●●●
●
●
●
●●
●●
●
●
● ●
●
●
●
●
●●
●
●●
●
●
PR
●
●
●
●●
●●●● ●●
●●●
●●
●
●●●
●
●●●
●
● ●
●
●
●
●●●
●
●
●
●
● ●
●
●
●
●●
●●
●
●
●●
●●●
●
●
●
●
●
●●●
●●
● ●
●
●
●
●●
trans−Gaussian
trans−Gaussian
trans−Gaussian
●
●●●
●●●
●
●●
● ●
Simplex
trans−Gaussian
Simplex
trans−Gaussian
MS
PB
●
●
●
MT
●
●
●●
●●●
●
●●
●
●
●
●
●●
●●
●
●
●
●●●
●
●
●
●
●
●
●●
●
Beta
●●
● ●
MS
●●● ●
● ●
●
●●●
● ●●
●
●●
●●●●
●
● ●
●
●
●●
●
●●
●●
●
●
● ●
●
PR
●
●
●
●●
●●●● ●●
●●●
●●
●
●●●
●
●●●
●
●●
●
●
●
●●●
●
●
●
●
● ●●
●
●
●
●
●
●●
● ●●
●●●
●
●
●
●●
●●
●
●
● ●
●
●
●
●
●●
RR
●
●
Gaussian
Gaussian
●
●●
●
●
●
●●
● ●
●●●
●●
●●
●●●
●
●●
●
●●
CE
Beta
0,5
Beta
0,6
● ●● ●
●●● ●
●●
●●●●
●
●
●
●
●
●
●
●
●
●● ● ●●
●●
●
●
●●●
●● ●
●
●
●●
●●●
●
●
●
MT
● ●
●
●
●
●
●
●
●● ●
●
●
● ●
●
●
●
●●
●
●
●
●●
●
●
●
●●
●●●●
●
●
●
●
●
●
●
●
●
0,25
0,4
RO
●
RR
●
●
●
●
●
●●●
●●●
●
●●
● ●
●
●
Beta
AM
0,7
●
DF
●
●
●●
●●●
●
●●
●
●
●
●
●●
●●
●
●
●
●●●
●
●
●
●
●
●
●●
●
● ●
●
●●
●●●●
●
●●
●●
●
●●
●●●
●●
●
●
●
●
●
●
●
●
●
●
●
●●
●
Gaussian
CE
●●
Gaussian
Gaussian
AM
PB
●
●
●
●
●
●●
●●●● ●●
●●●
●●
●
●●●
●
●●●
●
●
●
●
●●●
● ●●
●
●
●●
●
●
●
●
●●
●
●
●
●
●
●
●●●
●●● ●●
●●
●
●
● ●
●
●
●
●
●●
Beta
●
●
PB
● ●
● ●
●●
●●●●
●
●
●●
●●
●
●●
●●●
●●
●
●
●
●
●
●
●
●
●
●
●●
●
0,15
RO
Kw
● ●
●
MS
●●● ●
● ●
●
●●●
● ●●
●
●●
●●●●
●
● ●
●
●
●●
●
●
●●
●
●
●● ●
0,05
PR
Gaussian
●
●●
●
●
●
●●
● ●
●●●
●●
●●
●●●
●
●
●●
●●
Kw
●
●
●
●
MT
● ●
●
●
●
●
●
●
●● ●
●
●
● ●
●
●
●
●●
●
●
●
●●
●
●
●
●●
●●●●
●
●
●
●
●
●
●
0,25
Beta
DF
●
●
●●
●●●
●
●●
●
●
●
●
●●
●●
●
●
●
●●●
●
●
●
●
●
●
●●
●
●
●
●
Kw
●
MS
●●● ●
● ●
●
●●●
● ●●
●
●●
●●●●
●
● ●
●
●
●●
●
●●
●●
●
●● ●
● ●
●
●●
●●●●
●
●●
●●
●
●●
●●●
●●
●
●
●
●
●
●
●
●
●
●
●●
●
Gaussian
●
●
●●
●●●●
●
●
●
●
●
●
●
●
●
●
●
MT
● ●
●
●
●
●
●
●
●● ●
●
●
● ●
●
●●
●
●●●
●●
●
●
●
Beta
●
●●● ●
● ●
●
●●●
● ●●
●
●●
●●●●
●
● ●
●
●
●●
●
●●
●●
●
●● ●
Simplex
● ●
0,15
PB
Kw
●
●●
●
●
●
●●
● ●
●●●
●●
●●
●●●
●
●●
●
●
●
0,4
● ●● ●
●●● ●
●●
●●●●
●
●
●
●
●
●
●
●
●
●● ● ●●
●●
●
●
●●●
●● ●
●
●
●●
●●●
●
Simplex
●
0,05
MS
Gaussian
0,5
DF
CE
●●
●
● ●
●
●
●
●
●
●
●● ●
●
●
● ●
●
●
●
●●
●
●
●
●●
●
●
●
●
●
●●●●
●
●
●
●
●
●
●
●
●
●●
●●●
●
●●
●
●
●
●
●●
●●
●
●
●
●●●
●
●
●●
●
●
●●
●
Kw
Kw
IQVT
0,6
● ●● ●
●●● ●
●●
●●●●
●
●
●
●
●
●
●
●
●
●● ● ●●
●●
●
●●●
●● ●
●
●
●
●●
●●●
● ●
Gaussian
●●
AM
0,7
●
●●
●
●
●
●●
● ●
●●●
●●
●●
●●●
●
●●
●
●●
0,25
MT
Beta
● ●● ●
●●● ●
●●
●●●●
●
●
●
●
●
●
●
●
●
●● ● ●●
●●
●
●
●●●
●● ●
●
●
●●
●●●
●
CE
Simplex
Simplex
AM
●
0,15
Beta
●
●●
●●●
●
●●
●
●
●
●
●●
●●
●
●
●
●●●
●
●
●
●
●
●
●●
●
trans−Gaussian
●●
Simplex
0,4
0,05
DF
Kw
0,5
● ●● ●
●●● ●
●●
●●●●
●
●
●
●
●
●
●
●
●
●● ● ●●
●●
●
●
●●●
●● ●
●
●
●●
●●●
0,25
CE
trans−Gaussian
0,6
trans−Gaussian
0,7
0,15
trans−Gaussian
0,05
AM
●●
●
●
●
●
●
●● ●
●
●
●
0,05
0,15
0,25
0,05
0,15
0,25
0,05
0,15
0,25
0,05
0,15
0,25
0,05
0,15
0,25
Income
Figure 3 - Original data and predicted IQVT against income for the federative units
(columns) an under different distributions for the responses (rows).
the logistic, the cloglog for the monomolecular and log-log for the Gompertz. Such
modelling strategy ignores the response variable, disease incidence or severity, is
restricted to the unity interval. The wider class considered here provides potentially
more realistic and better options for modelling the disease progress ensuring the
values of estimated models and confidence bands lies within the unity interval.
The 30 models were fit individually for each cultivar and the likelihood values
are summarised in Figure 4. Results show the widely used Gaussian non-linear
models are clearly worse than the alternatives. They assume homocedasticity which
does not impact if values are within a narrow range but inappropriate otherwise,
with greater impact when there are observed values close to the limits of the unity
interval, which is common in practice.
Log-likelihoods do not vary substantially for the models with Beta, Kw and
Simplex distributions. For these models, the choice of the link function, which
determines the shape of the disease progress curve has little impact. The response
transformed models are more sensitive to the choice of T (·) and the cauchit, proved
better in the previous examples, is the worse case here.
Although having an extra parameter and expected to have better results, the
Aranda-Ordaz transformation was not uniformly superior. One of the alternative
link functions was always able to provide a similar fit with one less parameter.
Although superior to the naı̈ve Gaussian model, none of the options for d(·)
12
Rev. Bras. Biom., São Paulo, v.20, n.1, p.1-10, 2013
Aranda
Cauchit
Cloglog
PREMIER
Logit
Loglog
Probit
MARLI
250
200
150
100
50
GRANADA
ELDORA
VANGUA
AURORA
MACIEL
LEONENS
250
200
log−verossimilhança
150
100
50
250
200
150
100
50
CORAL
CHIRIPA
CHIMAR
250
200
150
100
50
beta
gaussiana
Kw
simplex
trans−
gaussiana
beta
gaussiana
Kw
simplex
trans−
gaussiana
beta
gaussiana
Kw
simplex
trans−
gaussiana
Figure 4 - Log-likelihoods of fitted models for each cultivar.
Rev. Bras. Biom., São Paulo, v.20, n.1, p.1-10, 2013
13
which respects the unity interval restriction was clearly better than the others.
Despite not frequently adopted in the literature, the transformed response would
be the model of choice for 9 out of the 11 cultivars, however with little differences
in log-likelihoods to the others.
Conclusions
A general and flexible regression model specification for response variables
with values on the unity interval was presented. Several models adopted in the
literature can be identified as particular cases. Inference is performed under
a common framework based on likelihood methods for parameter estimates,
confidence intervals, prediction of curves and confidence bands. Likelihood values
are used to compare 30 different model specifications. The generality of the
model format and the method of inference allow for a flexible computational
implementation, which can be extended to options not considered here for the mode
components.
Response transformed models are the only ones with closed expressions for
the parameter estimators. This case is equivalent to standard least squares
for linear regression and model fitting is straightforward. This is an advantage
over the alternatives which require numerical algorithms for maximization of the
likelihood function with usual concerns about starting values, parametrisations
and convergence. On the other hand, transformed models become less attractive
if predictions are requested in the original scale for which, in general, numerical
(integration or simulation) methods are required, although such methods can still
be less computationally demanding in comparison with numerical maximizations.
Difference in log-likelihoods for the case studies reached up to 10 units, even for
models with the same number of parameters. Larger differences were found among
choices for the response distribution for three out of the four case studies whereas
choices of link functions have impact upon the values of the log-likelihoods. The
cauchit was the best option for link or transformation function for the initial three
examples, however not for the last one which has responses more widely distributed
over unity interval.
Effects of the covariates measured by the estimated coefficients were impacted
by the choices of model for some cases, although without affecting significance.
Fits of the response transformed model are comparable to the alternatives with
the advantage of the easy computation with closed expressions for the parameter
estimators. This places such models as an attractive option for initial and
screening analysis or cases where large number and/or frequent mode fitting is
to be performed.
Overall, we argue that the practice of modelling responses on the unity interval
should be based on the analysis of a wide range of alternative models, instead of
restricting the choice to a particular family. Our analysis and algorithms illustrate
this can be accomplished in a practical manner.
Further studies, possible based on simulations, can be directed to identify
specific aspects of data which may be better captured for a particular choice of
14
Rev. Bras. Biom., São Paulo, v.20, n.1, p.1-10, 2013
model. Extensions incorporating random effects are also to be better investigated.
Acknowledgements
To IPPUC (Instituto de Pesquisa e Planejamento Urbano de Curitiba) for
the Curitiba’s interurban life quality index. To Sonia Beraldi de Magalhães from
the Paraná section and Milton Matos de Souza from the Departamento Nacional
do Serviço Social da Indústria (SESI) for the industry workers life quality index
data. To Giselda Alves and Larissa May de Mio from the peach rust data. To two
anonymous referees and Silvia Emiko Shimakura for their valuable comments on
the manuscript.
BONAT, W. H.; RIBEIRO Jr, P. J.; ZEVIANI, W.M. Regression models for
responses in the unit interval: specification, estimation and comparison. Rev.
Mat. Estat., São Paulo, v.xx, n.x, p.xx-xx, 2013. Rev. Bras. Biom. (São
Paulo), v. 20, n.1, p. 1-10, 2013.
Rev. Bras. Biom., São Paulo, v.20, n.1, p.1-10, 2013
15
RESUMO: Modelos de regressão são largamente utilizados em diversas áreas de aplicação
para descrever associações entre uma variável resposta e variáveis explicativas. Os
modelos lineares gaussianos muito utilizados inicialmente foram gradualmente estendidos
para diversos tipos de variáveis resposta. Muitas destas extensões foram posteriormente
descritas como casos particulares da classe mais geral de modelos lineares generalizados
(MLG) que, sob uma mesma abordagem, acomodam uma diversidade de formas para
a variável resposta e funções ligando parâmetros das distribuições a um preditor linear.
Desde então a estrutura dos MLG tem sido estendida em diversos desenvolvimentos
subsequentes em modelagem estatı́stica como modelos aditivos generalizados, de
superdispersão, dentre outros. Variáveis respostas com valores restritos a um certo
intervalo, em geral (0, 1) são comuns em ciências sociais, agronomia, psicometria dentre
outras áreas. As distribuições beta e simplex são usualmente adotadas, dentre outras
opções na literatura. Neste artigo modelos de regressão para respostas restritas são
especificados na forma de uma classe geral que inclui as formas usuais bem como
permite explorar uma maior diversidade de modelos. Casos particulares são definidos
pelas escolhas de três componentes: a distribuição de probabilidades para a resposta,
a função de ligação de um parâmetro da distribuição escolhida e o preditor linear
a uma função de transformação da resposta. São mostrados resultados das análises
de quatro diferentes conjuntos de dados considerando as distribuições beta, simplex,
Kumaraswamy e gaussiana, e as funções logit, probit, complemento log-log, log-log,
Cauchit e Aranda-Ordaz como opções para ligação e transformação da variável resposta.
Analises baseadas na verossimilhança são conduzidas de forma unificada para ajuste,
comparação e escolha de modelos e códigos são disponibilizados. Os resultados mostram
que não há uma forma de modelo que se destaque ilustrando a importância de se explorar
uma ampla classe de modelos a cada análise.a
a Uma
versão em Português do texto está disponı́vel em http://www.leg.ufpr.br/papercompanions/regression01
PALAVRAS-CHAVE: máxima verossimilhança ; variáveis restritas ; proporções ; ı́ndices
; taxas.
References
ALVES, G. Caracterı́sticas fitotécnicas e comportamento de cultivares de pessegueiro
em relação à podridão parda e à ferrugem na Lapa/PR, 2012. Tese Doutorado UFPR - Universidade Federal do Paraná, Curitiba, 2012.
BELISLE, C. J. P. Convergence theorems for a class of simulated annealing
algorithms on Rd. Applied Probability, v.29, p.885-895, 1992.
BYRD, R. H. ; LU, P. ; NOCEDAL, J. ; ZHU, C. A limited memory algorithm
for bound constrained optimization. SIAM - Journal on Scientific Computing, v.16,
p.1190-1208, 1995.
16
Rev. Bras. Biom., São Paulo, v.20, n.1, p.1-10, 2013
BONAT, W. H. ; RIBEIRO Jr, P. J. ; ZEVIANI, W. M. Likelihood
analysis for a class of beta mixed models. Relatório Técnico - LEG, 2013
(www.leg.ufpr.br/papercompanions).
BONAT, W. H. ; KRAINSKI, E. T. ; RIBEIRO Jr, P. J. ; ZEVIANI, W. M. Métodos
computacionais para inferência com aplicações em R. João Pessoa: 20º Simpósio
Brasileiro de Probabilidade e Estatı́stica - SINAPE, 2012. 260p.
BOX, G. E. P. ; COX, D. R. An analysis of transformations. Journal of the Royal
Statistical Society, Series B (Methodological), v.26(2), p.211-252, 1964.
BRANSCUM, A. J. ; JOHNSON, W. O. ; THURMOND, M. C. Bayesian beta
regression: Applications to household expenditure data and genetic distance between
foot-and-mouth disease viruses.Australian and New Zealand Journal of Statistics,
v.49(3), p.287-301, 2007.
CEPEDA, C. E. ; GAMERMAN, D. Bayesian methodology for modelling parameters
in the two parameter exponential family. Psychological Methods, v.57(1), p.93-105,
2005.
CRIBARI-NETO, F. ; ZEILEIS, A. Beta regression in R. Journal of Statistical
Software, v.34(2), p.1-24, 2010.
Da-SILVA, C. Q. ; MIGON, H. S. ; CORREIA, L. T. Dynamic Bayesian beta models.
Computational Statistics and Data Analysis, v.55(6), p.2074-2089, 2011.
ESPINHEIRA, P. ; FERRARI, S. ; CRIBARI-NETO, F. Influence diagnostics in
beta regression. Computational Statistics and Data Analysis, v.52(9), p.4417-4431,
2008a.
ESPINHEIRA, C. Q. ; FERRARI, S. ; CRIBARI-NETO, F. On beta regression
residuals. Journal of Applied Statistics, v.35(4), p.407-419, 2008b.
FERRARI, S. ; CRIBARI-NETO, F. Beta regression for modelling rates and
proportions. Journal of Applied Statistics, v.31(7), p.799-815, 2004.
GRÜN, B. ; KOSMIDIS, I. ; ZEILEIS, A. Extended beta regression in R: Shaken,
stirred, mixed, and partitioned. Journal of Statistical Software, v.48(11), p.1-25,
2012.
GRUNWALD, G. K. ; RAFTERY, A. E. Times series of continuous proportions.
Journal of the Royal Statistical Society: Series B, v.9(4), p.586-597, 1993.
KIESCHINICK, R. ; McCULLOUGH, B. D. Regression analysis of variates observed
on (0,1): percentages, proportions and fractions. Statistical Modelling, v.3(3),
p.193-213, 2003.
LEMONTE, A. J. ; BARRETO-SOUZA, W. CORDEIRO, G. The exponentiated
Kumaraswamy distribution and its log-transform. Brazilian Journal of Probability
and Statistics, v.27(1), p.31-53, 2013.
LIMA, L.B. Um teste de especificação correta em modelos de regressão beta.
Dessertação, Universidade Federal de Pernambuco, 2007. 107p.
Rev. Bras. Biom., São Paulo, v.20, n.1, p.1-10, 2013
17
McCULLAGH, P.; NELDER, J. A. Generalized linear models. 2.ed. London:
Chapman and Hall, 1989. 511p.
McKENZIE, E. An autoregressive process for beta random variables. Management
Sciences, v.31(8), p.988-997, 1985.
MIYASHIRO, E. S. Modelos de regressão Beta e Simplex para a análise de
proporções, 2008. 84p. Dissertação de Mestrado - USP - Universidade de São Paulo,
São Paulo, 2008.
NELDER, J. A. ; WEDDERBURN, W. M. Generalized linear models. Journal of
the Royal Statistical Society. Series A, v.135(3), p.370-384, 1972.
OSPINA, R. ; CRIBARI-NETO, F. ; VASCONCELLOS, K. L. P. Improved point
and interval estimation for a beta regression model. Computational Statistics and
Data Analysis, v.51(2), p.960-981, 2006.
OSPINA, R. CRIBARI-NETO, F. ; VASCONCELLOS, K. L. P. Erratum:
”Erratum to Improved point and interval estimation for a beta regression model”.
Computational Statistics and Data Analysis, v.55(7), p.2445, 2011.
R Development Core Team. 2012. R: A language and environment for statistical
computing. R Foundation for Statistical Computing, Vienna, Austria.
ROCHA, A. V. ; SIMAS, A. B. Influence diagnostics in a general class of beta
regression models. Test, v.20(1), p.95-119, 2010.
SIMAS, A. B. ; BARRETO-SOUZA, W. ; ROCHA, A. V. Improved estimators for a
general class of beta regression models. Computational Statistics and Data Analysis,
v.54(2), p.348-366, 2010.
SMITHSON, M. J. ; VERKUILEN, J. A better lemon squeezer? Maximum likelihood
regression with beta-distributed dependent variables. Psychological Methods, v.11(1),
p.54-71, 2006.
SPÓSITO, M.B. ; BASSANEZI, R.B. ; AMORIM, L. Resistência à mancha preta
dos citros avaliada por curvas de progresso da doença. Fitopatologia Brasileira,
v.29(5), p.532-537, 2004.
VASCONCELLOS, K. L. P. ; CRIBARI-NETO, F. Improved maximum likelihood
estimation in a new class of beta regression models. Brazilian Journal of Probability
and Statistics, v.19, p.13-31, 2005.
VERKUILEN, J. ; SMITHSON, M. Mixed and mixture regression models for
continuous bounded responses using beta distribution. Journal of Educational and
Behavioural Statistics, v.37(1), p.82-113, 2012.
Received in 01.01.2013.
18
Approved after revised in 01.01.2013.
Rev. Bras. Biom., São Paulo, v.20, n.1, p.1-10, 2013
Baixar